
Blog
6 Most Important Market Intelligence Metrics
By: Auras Tanase -
04 August 2025


We love our data, and now that you're here, you're one step closer to loving it too.
A wide sample of data, so you can explore what is possible with our data
Choose ->
built with procurement in mind. Focused on manufacturers, products and more
Choose ->
built with insurance in mind. Focused on classifications, business activity tags and more
Choose ->
built with sustainability in mind. Focused on sustainability commitments, and environmental and social governance insights.
Choose ->
built with strategic insights in mind. Focused on market trends, competitor analysis, and industry-specific data
Choose ->

Keep up to date with our technology, what our clients are doing and get interesting monthly market insights.

Key Takeaways:
Businesses leverage market intelligence to guide their strategic and operational decision-making.
As such, it plays a crucial role in helping companies stay competitive, responsive, and forward-looking.
But not all data carries equal weight.
The key lies in focusing on the right metrics—the ones that reveal shifts in customer behavior, market dynamics, and competitive positioning.
In this article, we’ll break down the six essential categories of market intelligence metrics that every business should be tracking.
Competitor understanding, also known as competitive analysis, is a group of market intelligence metrics focused on tracking your rivals’ position, behavior, and performance.
More specifically, with a strong grasp of its competitors, your company can:
Oleg Boyko, COO of GroupBWT, a Ukrainian software company, makes the purpose even clearer:
Illustration: Veridion / Quote: GroupBWT
In other words, competitor understanding enables smarter decisions across departments, from the C-suite to product development, marketing, procurement, and beyond.
The key metrics in competitive analysis can be broadly grouped into five categories, as shown in the table below.
| Metric | What it reveals |
|---|---|
| Market share | Competitor’s positioning within the industry |
| Pricing | Shifts in pricing strategy and discounting behavior |
| Product features | Gaps in differentiation and innovation |
| Marketing strategy | Messaging focus, channel mix, and targeting approach |
| Market share dynamics | Momentum shifts and emerging competitive threats |
Each of these categories can be broken down into more specific, measurable indicators.
For market share, competitor metrics include revenue share by region, customer segment penetration, or share of wallet.
Pricing metrics involve unit price comparisons, discount frequency, bundling tactics, or shipping cost structures.
In marketing strategy, KPIs include a competitor’s ad spend by channel, engagement rates, or share of voice.
Despite the strategic value of these indicators, a 2020 SCIP study revealed that fewer than half of companies have defined competitive intelligence KPIs.
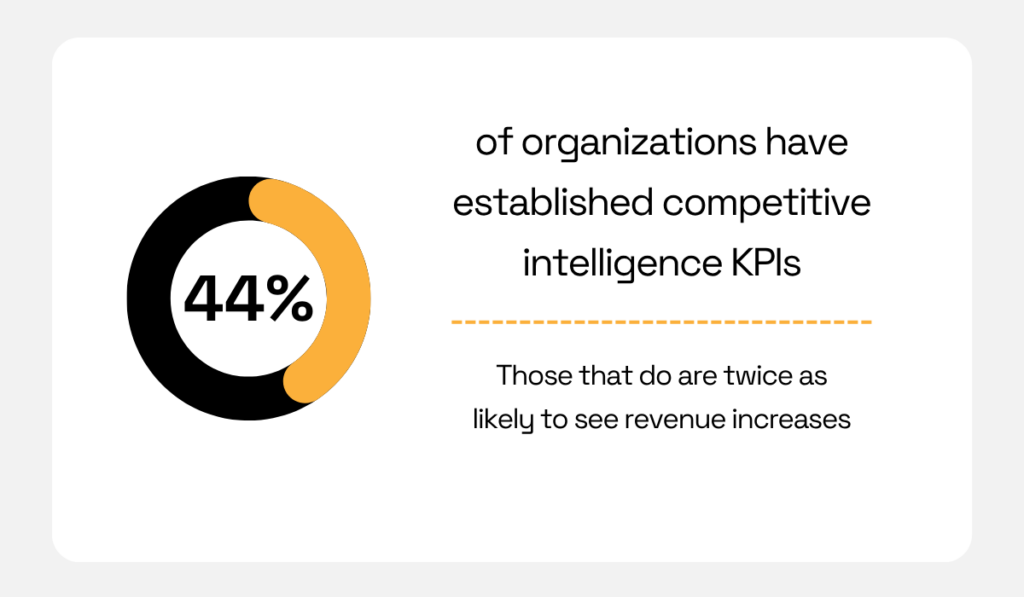
Illustration: Veridion / Data: SCIP
We can reasonably assume that global developments and technological advancements have pushed this percentage higher in the years since the study.
It’s also worth noting that some metrics—like customer satisfaction and brand awareness, covered in the sections below—can apply to competitors as well.
However, these are rarely publicly available and typically need to be inferred through:
The same is true for competitor churn rates, which are often considered sensitive internal data and are seldom disclosed.
So, when selecting your KPIs for competitor understanding, prioritize those you can reliably benchmark externally.
Now, let’s turn to more internal-facing metrics, starting with customer satisfaction and retention.
Customers are the lifeblood of any business, and understanding how satisfied and loyal they are is essential to long-term success.
Customer satisfaction and retention metrics help companies assess how well they’re meeting expectations, nurturing relationships, and delivering on their brand promise.
These insights go beyond surface-level happiness. They inform product decisions, service improvements, and long-term customer value strategies.
Whether you’re in sales, marketing, or strategy, knowing which customer groups are thriving and which are slipping away helps align internal efforts with real-world needs.
The table below highlights the core metrics in this category:
| Metric | What it reveals |
|---|---|
| Customer satisfaction | How well your product or service meets customer expectations |
| Customer retention rate | Percentage of customers who stay with you over time |
| Customer churn rate | Percentage of customers lost during a specific period |
| Customer acquisition cost (CAC) | Cost of acquiring a new customer |
| Customer lifetime value (CLV) | Projected revenue a customer generates over their lifecycle |
| Net promoter score (NPS) | Customer willingness to recommend your brand |
While customer segmentation isn’t a KPI itself, it amplifies the value of these metrics by helping companies assess performance more precisely across different customer groups.
For example, knowing your overall churn rate is useful, but knowing churn is 5% among enterprise clients and 20% among SMBs gives you actionable insight.
That level of granularity enables more targeted decisions, whether you’re refining onboarding, tailoring product features, or adjusting pricing models.
And since retention and churn are mathematically linked, tracking one often provides signals about the other.
Here’s how the retention rate is calculated:
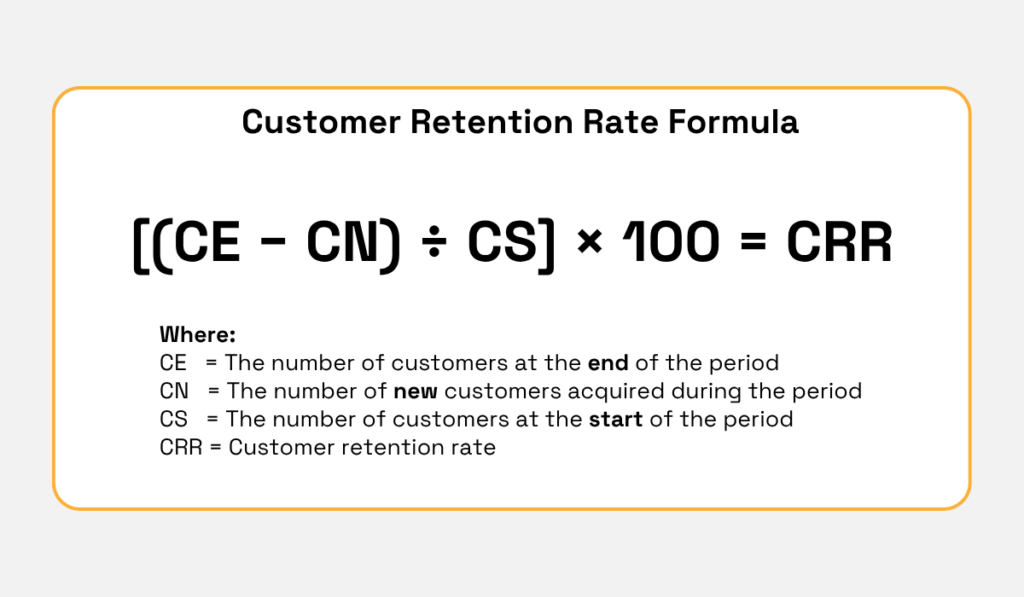
Illustration: Veridion / Data: Medium
Because churn rate is simply the inverse of retention, it can be derived by subtracting CRR from 100%. For example, if your retention rate is 85%, your churn rate is 15%.
But numbers alone don’t tell the full story.
To turn these insights into strategy, you need context:
For instance, is churn rising due to service issues, or are rivals offering better value?
A clear example comes from Verizon.
It lost nearly 290,000 wireless subscribers in Q1 2025 due to both internal price hikes and aggressive promotions from competitors.
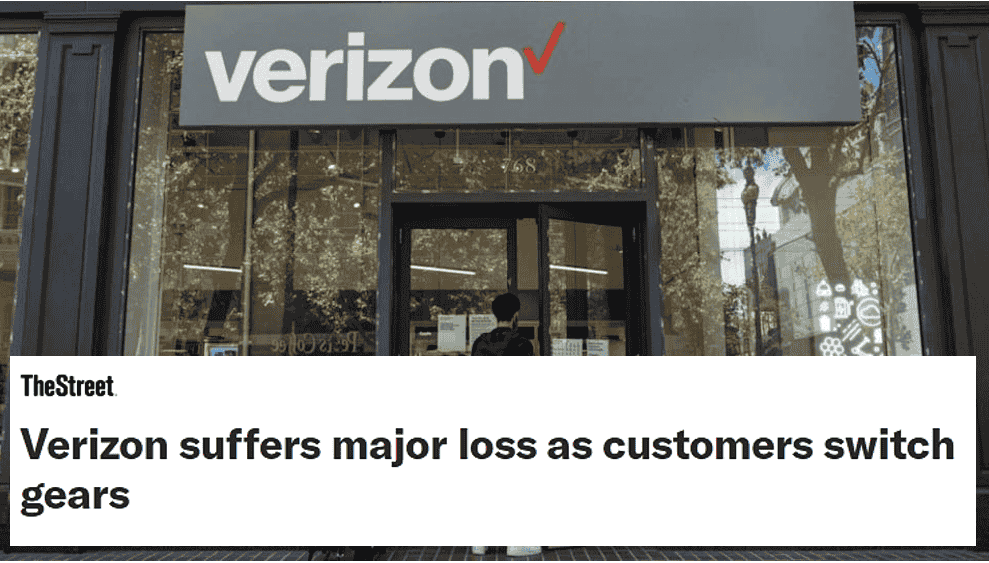
Source: Yahoo Finance
Getting to the root of churn and similar issues is where market intelligence becomes essential.
Internal metrics may show a dip in retention, but without external context—such as Verizon’s price hikes or a competitor’s aggressive promotions—you’re left guessing at the cause.
By layering in third-party data like news coverage, sentiment analysis, competitor NPS benchmarks, and industry trends, your team can validate internal signals and uncover hidden drivers.
Ultimately, integrating internal metrics with external context helps fine-tune strategies to strengthen customer satisfaction and loyalty.
Beyond understanding competitors and customers, companies also need a clear view of their broader market—its size, structure, dynamics, and direction.
Enter market trend intelligence, which focuses on external factors that shape your industry, such as:
These trends often evolve gradually but can have outsized effects on demand, pricing power, product relevance, and competitive strategy.
Here are some of the key metrics to track market trends:
| Metric | What it reveals |
|---|---|
| Market growth rate | Pace of your industry’s expansion or contraction |
| Trend velocity | Speed at which a new trend is gaining traction |
| Emerging technologies | Disruptive innovations that may reshape your industry |
| Consumer behavior shifts | Changing habits, values, or spending patterns |
| Economic and geopolitical indicators | Inflation, interest rates, employment, political instability, trade impacts |
By monitoring these metrics and analyzing their impacts, your team can align internal goals with external realities, uncover new growth opportunities, and avoid being blindsided by disruption.
As such, market trend intelligence plays a crucial role in long-term planning, risk management, and resource allocation.
It enables businesses to anticipate shifts before they fully materialize, adjust product roadmaps, and adapt marketing strategies to evolving consumer preferences and technological advances.
These market shifts can be driven by factors such as the rise of AI, climate change impacts, or generational changes in buying habits—like those seen with Gen Z consumers, who are reshaping retail in profound ways.

Source: NIQ
Understanding such shifts and tracking market trends are essential for staying ahead in today’s market.
By recognizing emerging consumer behaviors and technological changes early, your company can prioritize innovation and investment where they matter most.
This group of metrics evaluates how effectively your product or service meets customer needs and supports business goals by tracking performance, usage, and impact.
While we’ve already covered some relevant metrics in earlier sections—such as feature comparisons, innovation gaps, churn, retention, and NPS—product performance takes a broader perspective.
It combines financial, behavioral, and operational indicators to assess how well your offerings deliver value in the market and where improvements are needed.
Here are several additional product-focused metrics that may be relevant depending on your industry and business model:
| Metric | What it reveals |
|---|---|
| Product penetration | The share of your target market using the product or service |
| Key offering adoption | How widely core product features or service components are used |
| Customer engagement rate | Frequency and consistency of product/service usage over time |
| Win/loss rate | Competitive effectiveness in B2B or high-consideration B2C sales |
| Revenue per unit/user | Average revenue generated per product sold or customer account |
| Conversion rate | Percentage of prospects completing a desired action (e.g., purchase, sign-up) |
Essentially, tracking these metrics in context helps teams uncover where their product excels and where adjustments are needed.
For example, low conversion rates paired with high engagement may signal friction in pricing or user experience.
In B2B, a declining win/loss rate could reflect stronger competitor positioning or shifting buyer expectations.
By combining performance data with external benchmarks or customer feedback, product teams can make more informed decisions about feature prioritization, positioning, and go-to-market strategies.
This clarity is critical not just for refining the product itself, but also for shaping how it’s perceived in the market.
Brand awareness metrics measure how well your target audience recognizes and recalls your brand.
They reflect your brand’s visibility and mindshare in the market and provide valuable insights into the effectiveness of marketing campaigns and outreach efforts.
By tracking brand awareness through both quantitative data and qualitative customer feedback, your team can optimize strategies to boost recognition, trust, and customer acquisition.
The table below shows some key brand awareness metrics:
| Metric | What it reveals |
|---|---|
| Brand impressions | Number of times your brand is seen across channels |
| Brand search volume | How often your brand is searched online |
| Share of voice | Your brand’s mention share compared to competitors |
| Website traffic | Visitor volume and engagement on your website |
| Social media reach | Total audience exposed to your content on social platforms |
| Social media engagement | Likes, shares, comments reflecting audience interaction |
| Customer feedback | Insights from surveys and reviews about brand perception |
The above metrics focus primarily on digital and perception-based indicators of brand awareness.
However, brand awareness can also be reflected through offline signals, such as:
Michelle Noel, Strategy Director at Studio Noel, a UK marketing firm, highlights the importance of brand awareness:
Illustration: Veridion / Quote: Studio Noel
She emphasizes that brand awareness goes hand in hand with reach, which measures the number of unique individuals exposed to your brand content.
As a metric, reach is slightly different from brand impressions, as it excludes repeat exposures by the same person.
Overall, these metrics help your team understand the brand’s market presence, assess the effectiveness of marketing efforts, and guide strategic decisions to boost visibility and drive customer acquisition.
While regulatory and ESG developments are technically part of broader market trend monitoring, their far-reaching consequences warrant a dedicated focus.
Shifts in compliance standards, sustainability mandates, or government policy can affect supply chains, market access, brand reputation, and investor decisions.
Monitoring these changes isn’t just a risk mitigation tactic—it’s a strategic advantage.
Relevant metrics help assess your company’s (and your suppliers’) alignment with evolving laws, regulations, and environmental, social, and governance (ESG) expectations.
Here are some metrics to track:
| Metric | What it reveals |
|---|---|
| Industry-specific compliance rate | Adherence to key industry regulations (e.g., financial, health, data privacy) |
| ESG rating | ESG performance scores of your company and suppliers |
| Carbon footprint | Environmental impact data, often used for compliance and sustainability tracking |
| Supply chain risk score | Exposure to third-party regulatory or ESG non-compliance risks |
| Incident & violation reports | Recorded legal, regulatory, or ESG-related issues indicating potential red flags |
While not a formal metric, regulatory change tracking—ongoing monitoring of laws, policies, and ESG standards—is essential for maintaining compliance and shaping long-term strategy.
It helps businesses anticipate operational impacts, adapt to evolving requirements, and mitigate legal or reputational risk across their operations and supply chains.
To manage ESG and regulatory risk at scale, organizations increasingly rely on real-time intelligence platforms that offer both depth and coverage.
At the same time, some of these platforms serve a broader role.
They collect structured data that supports many of the market intelligence metrics we’ve discussed.
Veridion is one of them.
With unparalleled global coverage, AI-powered data gathering, and weekly refresh cycles, it provides a rich foundation for strategic market insight.
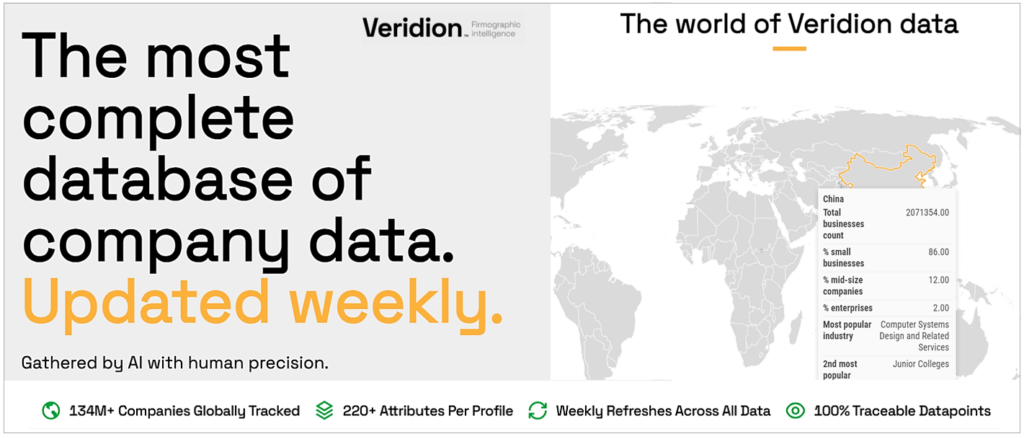
Source: Veridion
Veridion’s data capabilities span a wide range of market intelligence use cases—from analyzing competitors and industry trends to discovering suppliers in seconds.
It also enables real-time ESG risk monitoring at scale.
Veridion’s structured data powers key metrics across procurement, vendor management, and compliance, helping teams stay ahead of regulatory changes and rising sustainability demands.
To recap, monitoring regulatory and ESG changes at the local, regional, and supplier level requires a structured approach, robust metrics, and the right market intelligence and screening tools.
Today, market intelligence is essential.
It reveals how your business is performing, how it’s perceived, and how it stacks up against the competition.
The metrics we’ve covered don’t operate in isolation. Together, they offer a connected, strategic view of your market landscape.
The next step is to identify gaps in your market intelligence, align your teams around the right metrics and intelligence tools, and start turning insight into impact.