
Blog
Leveraging B2B Market Intelligence: Step-by-Step Process
By: Auras Tanase -
03 December 2025


We love our data, and now that you're here, you're one step closer to loving it too.
A wide sample of data, so you can explore what is possible with our data
Choose ->
built with procurement in mind. Focused on manufacturers, products and more
Choose ->
built with insurance in mind. Focused on classifications, business activity tags and more
Choose ->
built with sustainability in mind. Focused on sustainability commitments, and environmental and social governance insights.
Choose ->
built with strategic insights in mind. Focused on market trends, competitor analysis, and industry-specific data
Choose ->

Keep up to date with our technology, what our clients are doing and get interesting monthly market insights.

Key Takeaways:
In B2B markets, the difference between leading and lagging often comes down to how well a company uses its data.
The most successful businesses don’t just collect information, but transform it into insight that drives every decision.
That’s what we call market intelligence (MI).
This article will show you how to collect and leverage it strategically in six simple steps.
So, let’s dive in!
Every market intelligence effort should begin with a clearly defined purpose.
Otherwise, you risk wasting time and resources on activities that don’t yield justifiable results.
So, start by deciding your main objectives.
They should be aligned with broader business goals, making it clear how your MI strategy relates to and supports your company’s overall priorities.
Common examples of B2B market intelligence objectives include:
However, one thing to note is that starting broadly like this can help break the ice, but it isn’t an ideal final outcome.
In order to genuinely focus your efforts and resources, your final goals should be much more specific than these, so it’s crucial to define them in more detail.
Don’t overthink this.
The good old SMART framework works like a charm, equipping you with all the information you need to keep your strategy focused.
Here’s a refresher of what it entails:
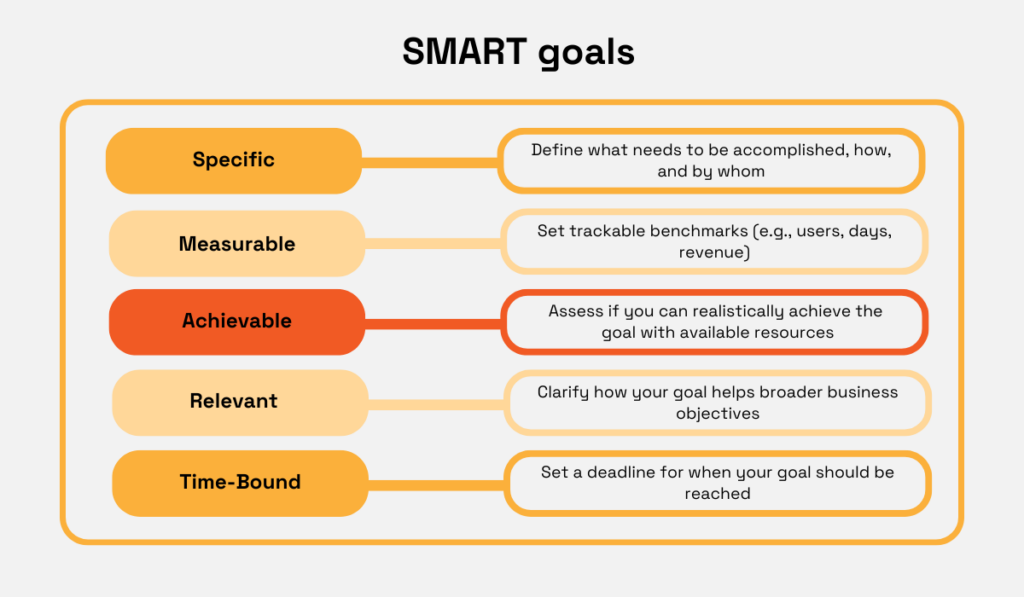
Source: Veridion
Let’s illustrate how this formula works using our previous example of a potential objective: understanding competitors.
This is obviously a very vague goal.
To turn it into a SMART goal, we need to make it Specific, Measurable, Achievable, Relevant, and Time-Bound.
Here’s what that iteration could look like:
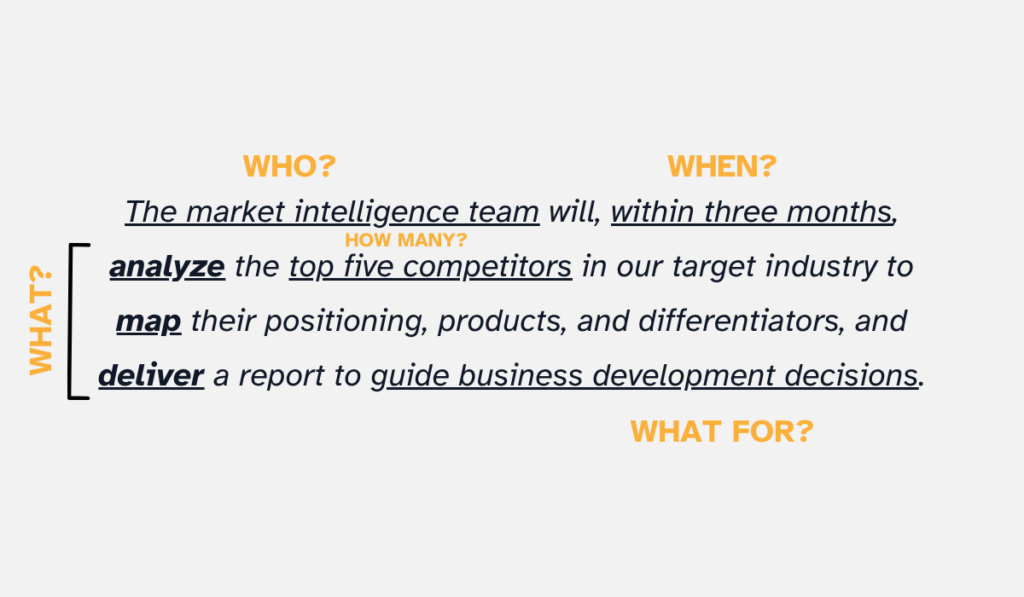
Source: Veridion
Once you have your SMART goals set, all that’s left to do is define your Key Performance Indicators (KPIs).
These metrics will help you track whether your goals have yielded desired results.
Some of your KPIs can be strictly related to whether the goal was achieved as expected.
In other words, they measure output and compliance, not outcome.
For our sample objective, such KPIs could be:
Now, for the KPIs that do measure outcome, we could use the following:
These key parameters will help focus and guide your entire MI strategy.
The second step in any B2B market intelligence strategy is identifying the data sources to use in order to gather actionable insights.
The goals you set earlier now serve as your main selection criteria.
Ask yourself: Does this source provide the information I need to achieve my objectives?
Other key filters, apart from relevance, include source availability and trustworthiness.
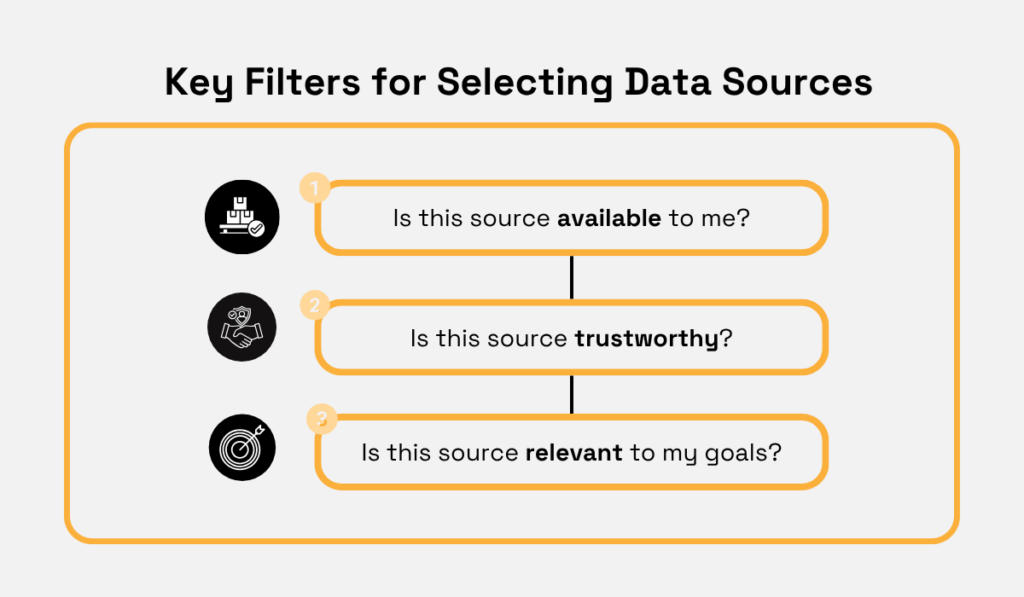
Source: Veridion
Based on this, you can decide which data source to use or not to use.
In any case, however, the more diverse, credible inputs you have, the better. Effective intelligence depends on gathering data from multiple reliable sources.
Generally speaking, there are two main types of data sources: internal and external.
But there’s also a third category, highlighted for its exceptional usefulness: specialized data sources.
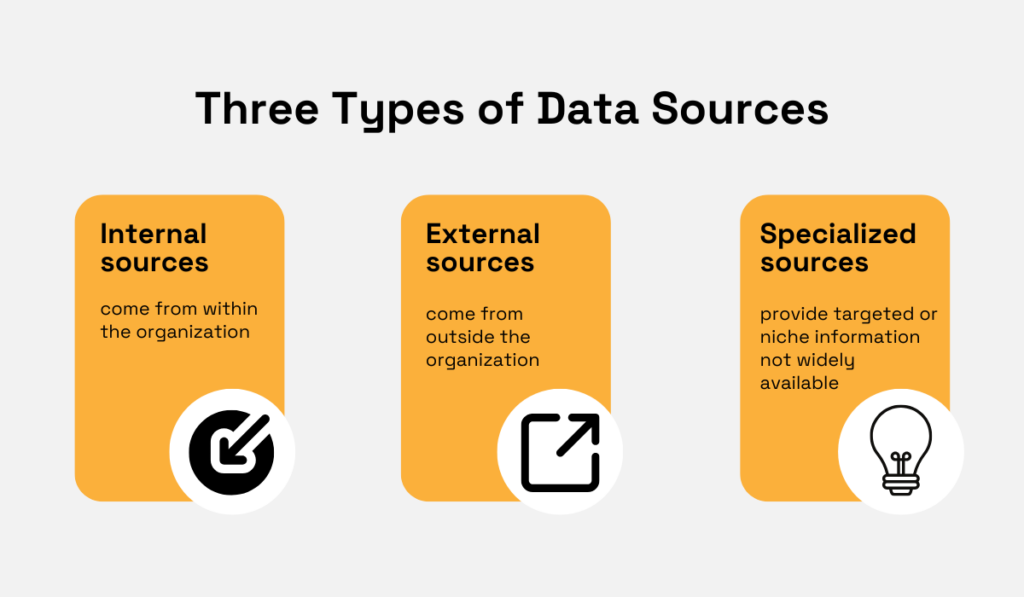
Source: Veridion
For the best results, combine all three types and leverage them collectively.
To give you an idea of what falls into each category, here are some common examples:
The quality and breadth of your sources directly influence the accuracy of insights.
So, if you’re unsure about your data quality, want to double-check it, or simply expand your data pool, consider working with a third-party data provider.
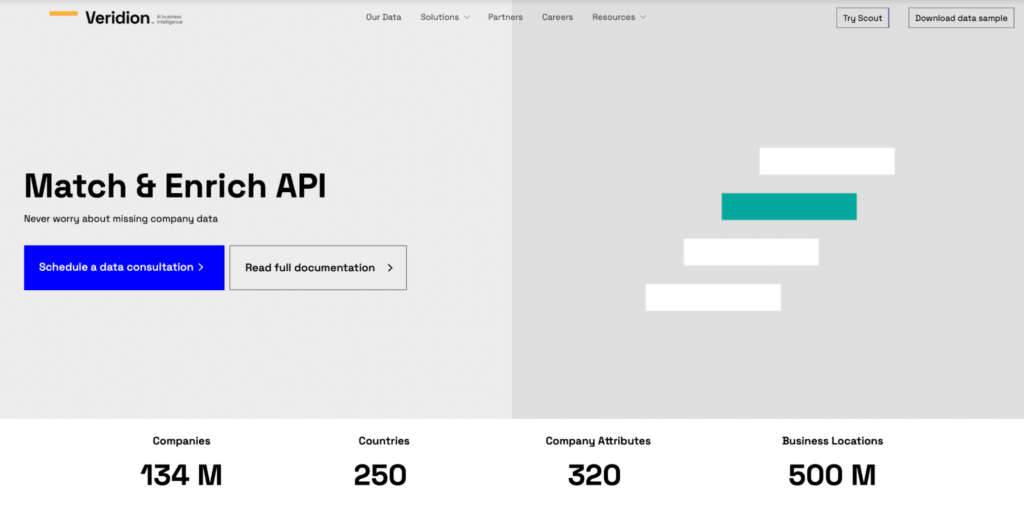
Providers like Veridion can help both enrich and validate existing data with verified, up-to-date firmographics.
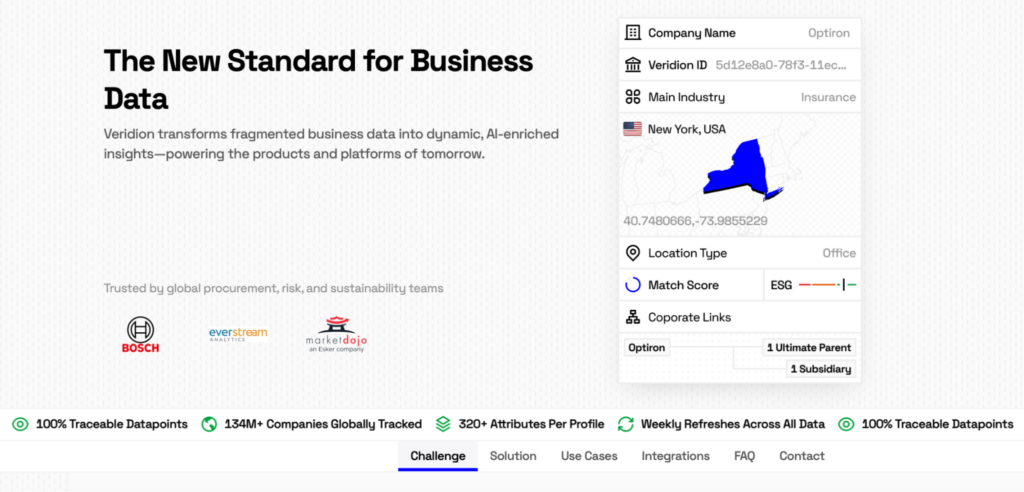
Veridion collects data on over 134M global companies, providing unbiased insights across 320+ different company attributes.
Source: Veridion
This data is also updated weekly, ensuring you can base your decisions on the latest, most relevant information.
Platforms like these can both help you collect new data as well as ensure that the data you already have is correct.
Both processes are crucial in gathering reliable MI insights.
Once you have a list of key data sources, consider whether you need more. If so, think about how you can collect it, especially in an automated way.
This could include using a third-party provider or setting up automated data feeds.
In either case, once you have adequate data, it’s time to bring it all together in one place.
Data centralization is a crucial part of the data collection process.
It provides you with a comprehensive view of your data and, by default, enables more accurate decision-making.
The best way to perform it is, once again, to not do it yourself at all, but rather automate the process.
There are several reasons for this, including the fact that manual data entry is a low-value, yet high-cost task.
According to Parseur’s 2025 survey, American companies spend an average of $28,500 per employee on entering data every year.
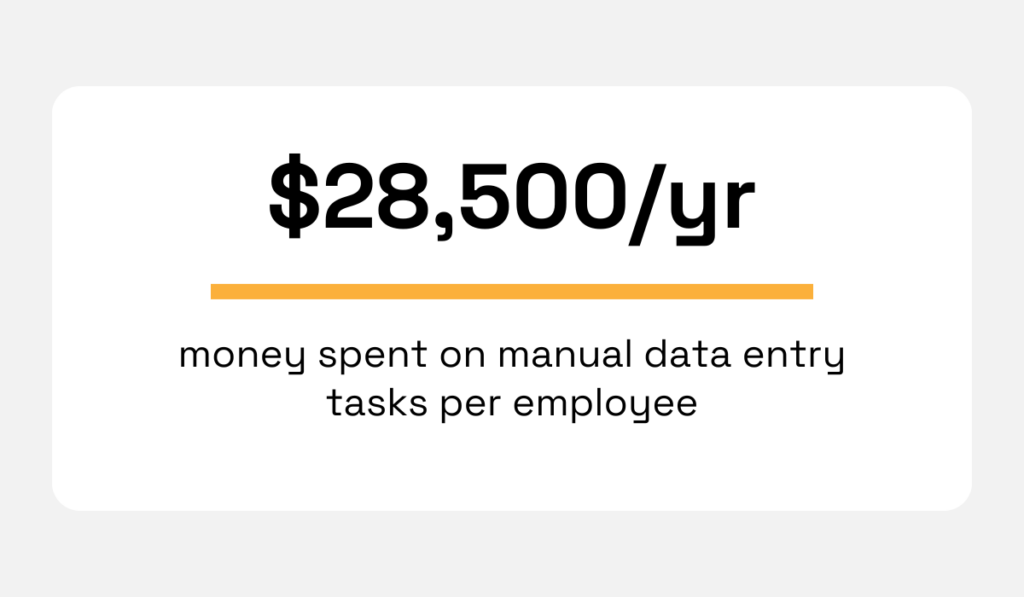
Illustration: Veridion / Data: Parseur
The same survey also showed that over half of employees experience burnout, errors, and delays from such repetitive tasks, making them not just draining but also operationally risky.
Automation solves all these problems.
It’s almost always more cost-effective, less prone to errors, and more efficient than its manual counterpart.
For instance, as the same survey shows, almost all companies that automate data collection significantly reduce workloads.
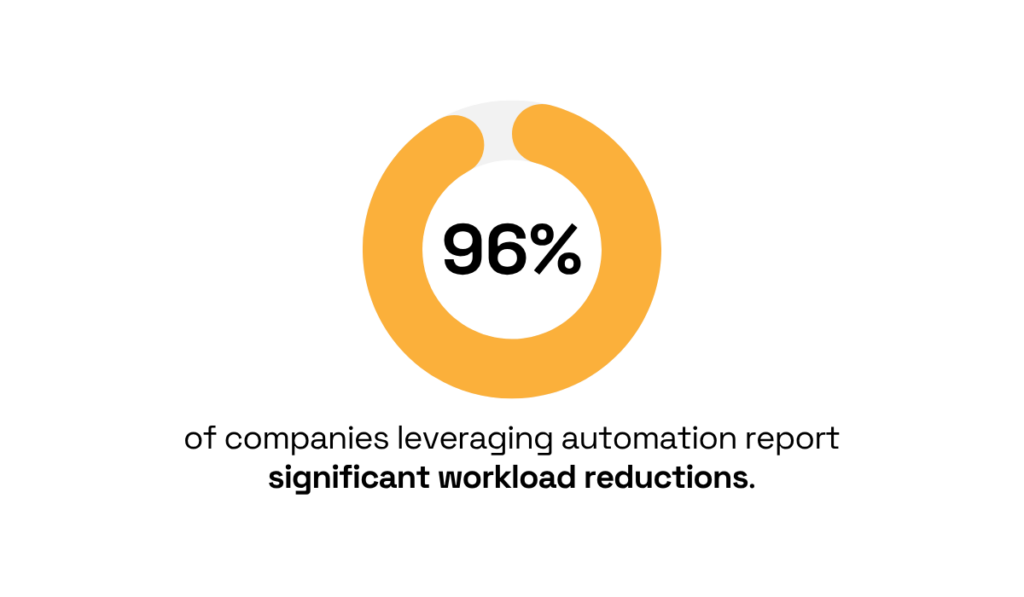
Illustration: Veridion / Data: Parseur
But how can you actually automatically centralize your data in practice?
Well, you’ve already handled the big part of the task by identifying your data sources.
That means you know exactly where your data lives. Now it’s just a matter of bringing it together into a single, unified platform.
That part should be managed by someone with adequate technical expertise.
Still, it might be useful to know that there is more than one way to approach integration, with the most popular methods being:
Discuss the benefits and drawbacks of each method with your IT team.
It’s important that the final decision is made jointly; that is, supported by both business and technical teams.
Data cleanup can be done either before or after integration, depending on the data integration method you chose.
With some, it’s recommended that it be done before loading to prevent “garbage data” from entering your systems in the first place.
For others, this might not matter, so you may want to keep raw data unaltered for a little while longer.
In either case, though, when the time comes, you’ll want to check for the following data issues:
Cleaning your data means ridding it of these problems.
Here’s how to do it, depending on the issue:
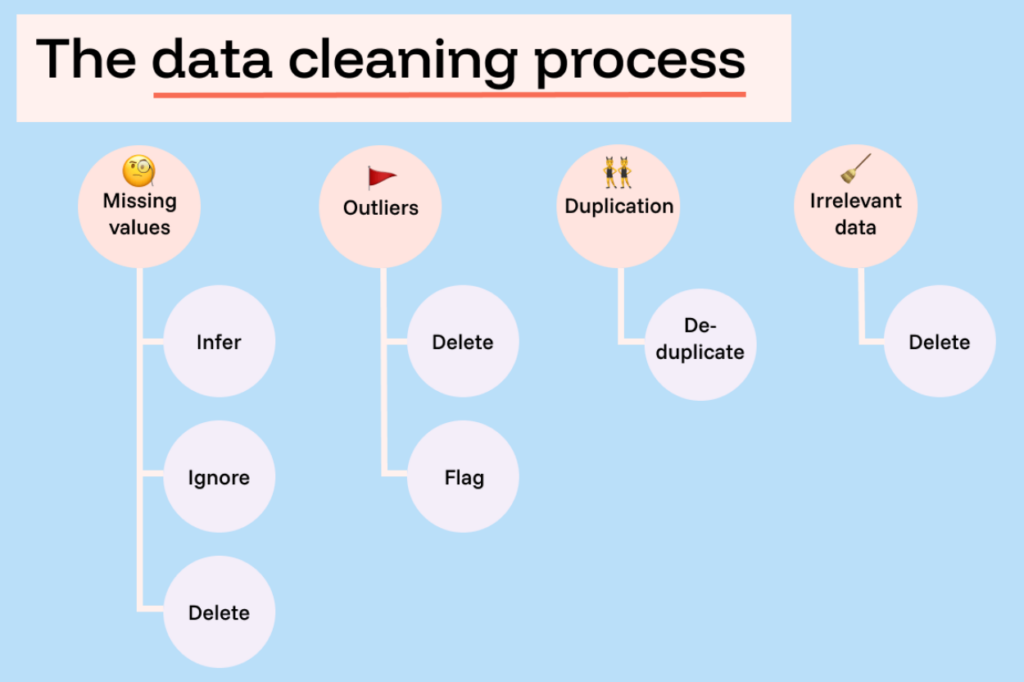
Source: Funnel.io
However, to ensure you’re making the right decisions about what needs to be added, deleted, deduplicated, or ignored, you need another, more reliable source of data you can reference.
Platforms like the aforementioned Veridion can help with this, too.
In particular, Veridion’s Match and Enrich API helps teams verify company records, enrich incomplete profiles, and ensure the freshness of the data in their systems.
Source: Veridion
Teams just need to enter one or two verified company details to receive an enriched company profile.
For instance, they can simply enter the company’s name, website URL, or even phone number to receive all available verified details about a company.
All that’s left to do from there is cross-reference the third-party data with what you already have in your database.
Of course, this data cleansing process should be practiced more than once.
Maintaining ongoing data hygiene practices is essential for keeping your data reliable, so practice it regularly.
Your data is now ready to be mined for actionable MI insights.
To really understand what insights derived from data entail, it might be useful to define them.
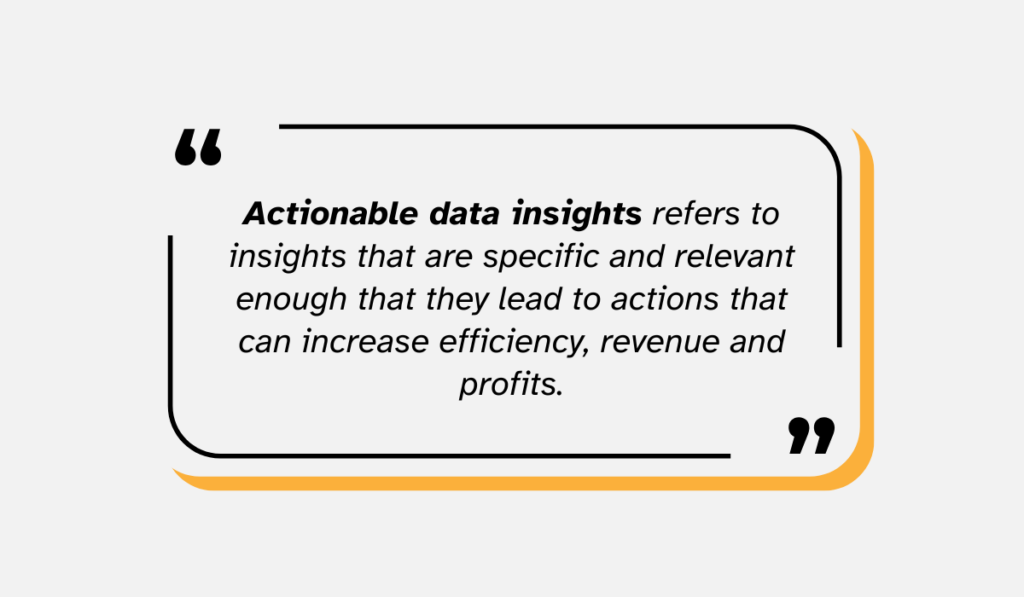
Illustration: Veridion / Definition: Qlik
So, to transform our data points into actionable insights, we need to ensure they offer a deep understanding of the market and are specific and relevant enough to inspire beneficial actions.
We make this possible by interpreting the meaning of the observed numbers and patterns for business performance.
In other words, we need to put our data into an appropriate context and analyze what it implies.
This can be done through various methods, with the three most common ones being:
Consider segmentation a basis for analysis.
It often doesn’t lead to insights directly, but it does enable them by organizing data in a way that lets you see patterns.
This involves dividing your data into distinct groups based on shared characteristics.
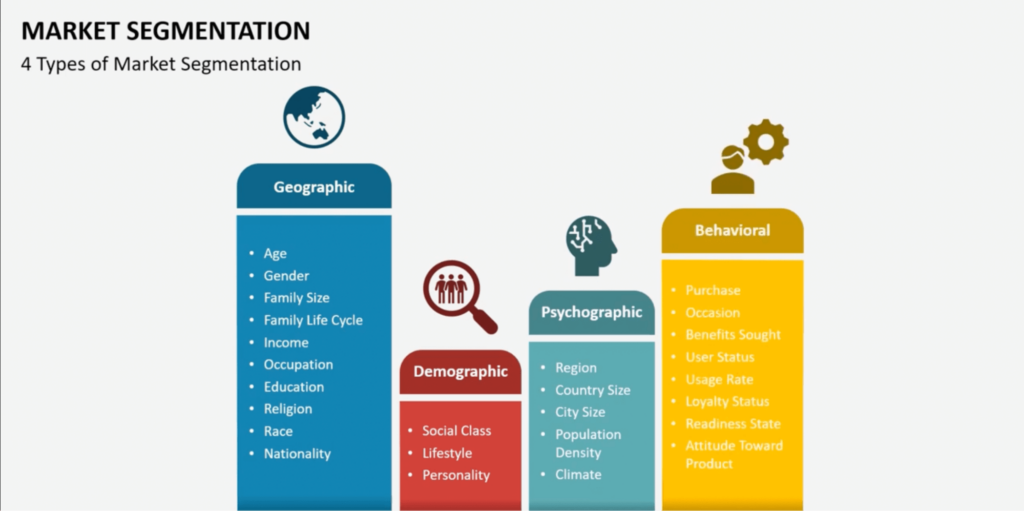
Source: SketchBubble on YouTube
The next step could be doing a trend analysis, or analyzing how things change over time and what opportunities and risks emerge.
Unlike segmentation or competitor benchmarking, trend analysis is a forward-looking method focused on predicting future outcomes rather than identifying current or past market conditions.
Still, to do that, trend analysis relies on historical data patterns, which can be more or less reliable indicators of future outcomes.
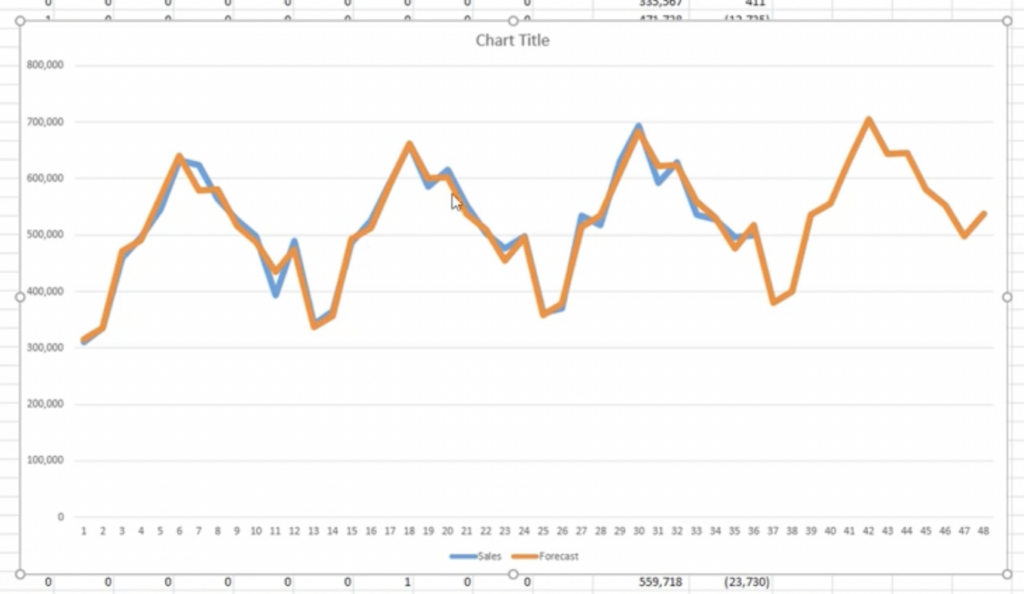
Source: Data Analytics Central on YouTube
Finally, competitor benchmarking involves comparing your company to competitors on metrics like market share, pricing, and customer satisfaction.
This method gives you insights into your current positioning relative to others in your market.
By leveraging it, you can identify opportunities for growth or areas for improvement.
This might result in adjusting your pricing strategies, optimizing product offerings, or making other changes.
Source: Propel AI on YouTube
You can use one of these or all three methods to draw insights from your data.
All that’s left to do from there is share what you’ve learned across the organization.
Too often, market intelligence remains siloed within one department.
For instance, if it were primarily collected for marketing purposes, it stays within the marketing team.
In reality, though, it could be leveraged by many other departments, like sales and product development.
Previn Pillay, CEO of Pyromin Consulting, explains that siloed data is highly inefficient, especially when you already have MI insights ready and all you have to do is share them.
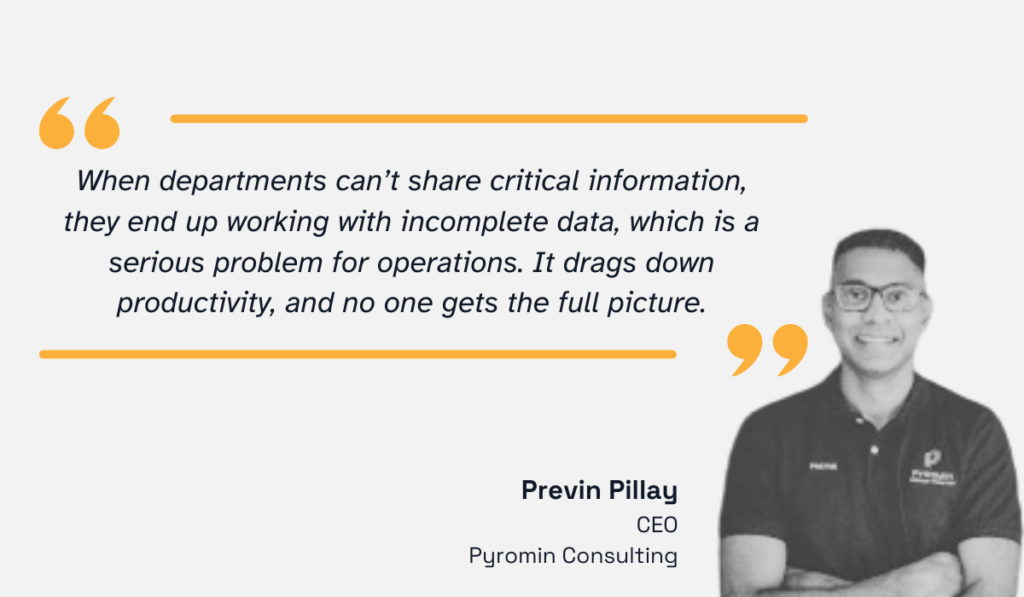
Illustration: Veridion / Quote: HubSpot
To counteract this, you need to normalize sharing insights within your organization and make it easy to do so.
The first step is assigning clear ownership and governance.
This means designating someone responsible for disseminating market intelligence, whether permanently or temporarily, depending on the nature of the research.
Equally important is fostering a culture that values and acts on the information: teams receiving insights should be held just as accountable for reviewing and applying them in their work.
This is critical because, all too often, insights go ignored by key stakeholders.
Gartner, for instance, reports this happens in about one-quarter of cases when marketing analytics are shared.
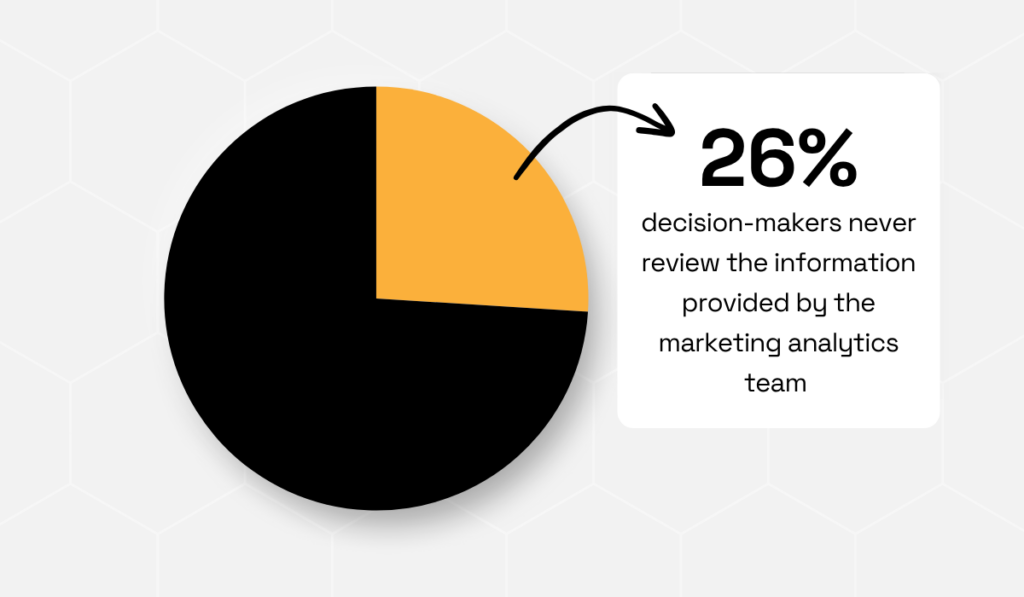
Illustration: Veridion / Data: Gartner
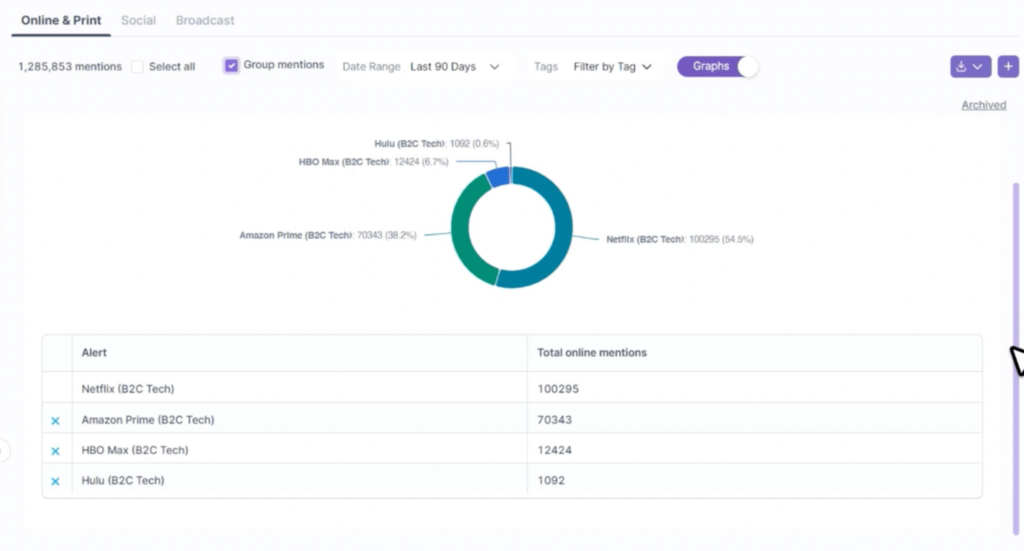
Beyond that, information-sharing should be facilitated through technology.
Creating accessible, visual reports or dashboards can help in sharing insights across marketing, sales, and leadership teams.
For best results, consider coupling them with regular cross-department meetings.
This will allow teams to both internalize the data on their own, as well as discuss things live.
Market intelligence is invaluable.
It helps you understand your current position, analyze previous performance, and even predict the most likely future outcomes.
This should be the foundation of all business planning, especially for B2B companies.
In most cases, in B2B partnerships, every decision holds much more weight and can impact long-term relationships more significantly.
So, the best approach is often making decisions based on clear, data-driven insights.
This six-step approach will help you build the structure you need to draw them. Start today, and face tomorrow fully prepared!