
Blog
How to Implement Insurance Business Intelligence
By: Auras Tanase -
08 December 2025


We love our data, and now that you're here, you're one step closer to loving it too.
A wide sample of data, so you can explore what is possible with our data
Choose ->
built with procurement in mind. Focused on manufacturers, products and more
Choose ->
built with insurance in mind. Focused on classifications, business activity tags and more
Choose ->
built with sustainability in mind. Focused on sustainability commitments, and environmental and social governance insights.
Choose ->
built with strategic insights in mind. Focused on market trends, competitor analysis, and industry-specific data
Choose ->

Keep up to date with our technology, what our clients are doing and get interesting monthly market insights.

Key Takeaways:
Looking to implement business intelligence (BI) in your insurance operations, and actually get real value from it?
You’re in the right place.
In this article, we’ll walk you through a comprehensive, seven-step guide to implementing BI in any insurance organization.
We’ll break down each step with clear explanations, expert insights, and the latest industry research, so you can move forward with confidence, knowing your BI efforts will pay off.
Ready to transform your data into real business impact?
Let’s begin.
Before implementing business intelligence in your operations, it’s important to define what you actually want to achieve.
In other words, it’s not enough to just collect as much data as possible. You need to decide what specific insights or business improvements you’re aiming for.
For instance, you might want to:
This keeps your BI efforts focused, measurable, and aligned with strategic goals, ultimately ensuring their success.
So, start by identifying the key challenges your organization faces.
Ask questions like:
Analyzing internal data and engaging with stakeholders will help pinpoint these issues.
From there, you can translate problems into clear, outcome-oriented goals.
To avoid vague “data for data’s sake” projects, set S.M.A.R.T. objectives: objectives that are Specific, Measurable, Achievable, Relevant, and Time-bound.
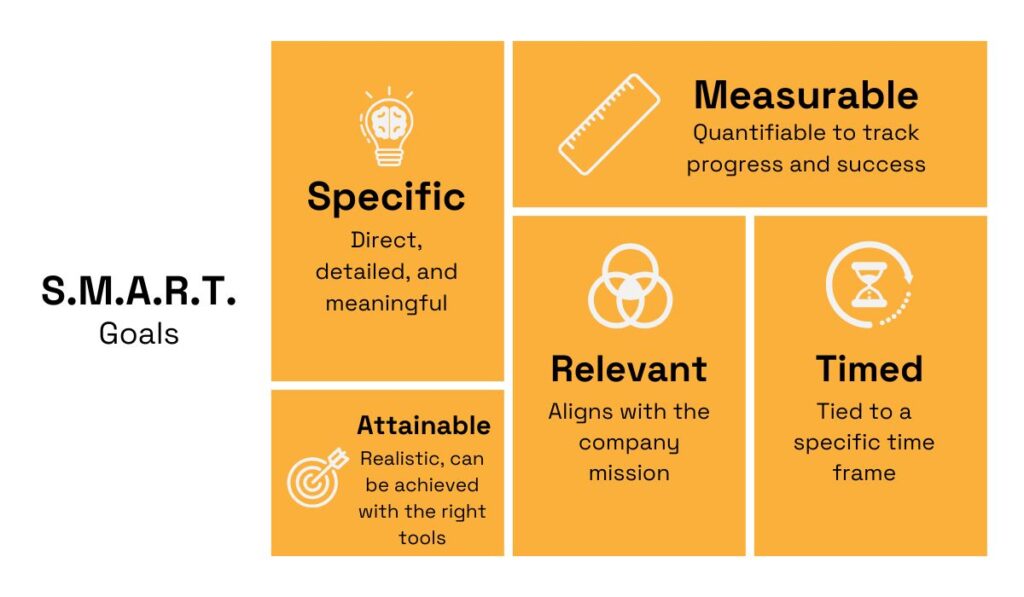
Source: Veridion
With this approach, you’ll be able to enhance focus, motivation, and accountability.
Here’s an example of a S.M.A.R.T. goal:
“Reduce the average time to settle auto insurance claims from 10 days to 7 days within the next 12 months, without increasing operational costs.”
And here’s the breakdown of why this works:
Setting goals this way provides a solid foundation for every subsequent step in your BI journey.
It ensures your initiatives stay business-driven and relevant, while minimizing the risk of information overload.
Next, you’ll need to translate your desired outcomes into measurable performance indicators that can be tracked and visualized in dashboards.
This will make it clear whether business intelligence is actually delivering value over time.
That’s exactly what Allianz does.
Since implementing AI-powered business intelligence across their operations, they’ve also established a set of metrics to consistently track success.
Manuela Diviach, Head of Group Operations, Procurement and Organization at Allianz, explains:
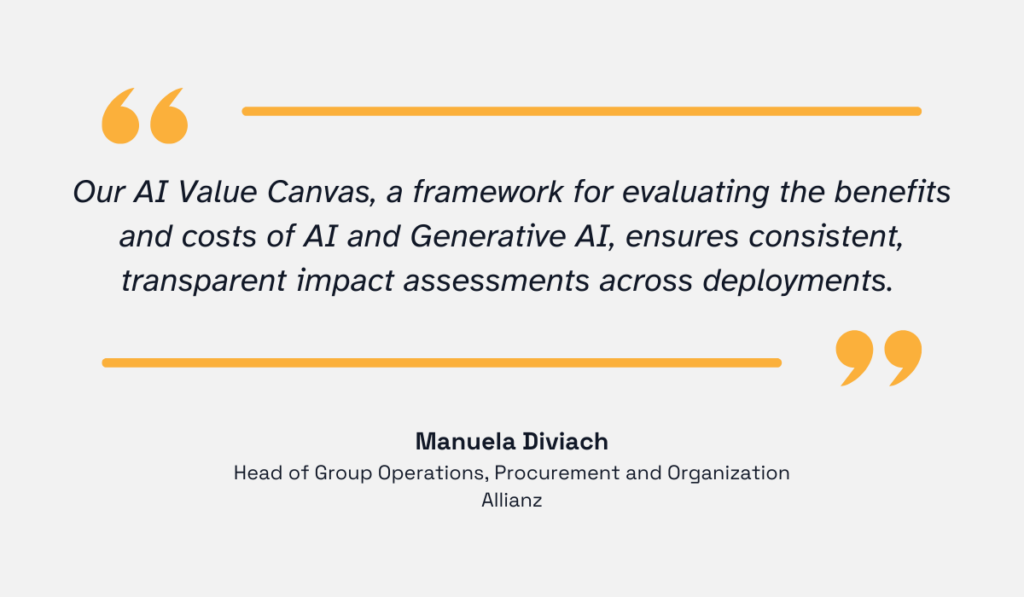
Illustration: Veridion / Quote: Allianz
For such a framework to succeed, however, you need to define your KPIs before implementation and ensure they align with your business objectives.
Otherwise, you risk tracking too many unnecessary metrics, which could lead to data overload and analysis paralysis.
So, revisit the outcomes you defined earlier and set KPIs directly linked to them.
Here are a few examples of common outcomes and their corresponding performance metrics:
| Domain | Outcome | Relevant KPIs |
|---|---|---|
| Claims | Reduce claim settlement time | Average claim processing days, % of claims settled within SLA, claim backlog |
| Underwriting | Improve risk assessment accuracy | % of claims that match predicted risk class, # of underwriting errors |
| Sales & Marketing | Increase policy conversion | Quote-to-bind ratio, new policies sold, cross-sell ratio |
| Customer Experience | Improve retention and satisfaction | Customer retention rate, Net Promoter Score (NPS), CSAT |
Allianz provides another interesting example.
In addition to tracking BI’s impact on financial growth, cost savings, customer satisfaction, service quality, and operational efficiency, they also measure how BI supports their employees.
Diviach calls this people engagement:
“And there is still one more dimension I must mention, which for Allianz is fundamental, and that is people engagement: observing how AI tools enhance job satisfaction.”
As you can see, your metrics can take many forms, as long as they remain relevant to your company’s specific goals and priorities.
Now that you know what you want to achieve, the next step is to determine whether you’re actually ready to achieve it.
In other words, you need to assess your current data readiness.
Phillip Swan, Managing Partner at Pi Partners LLC, offers a simple definition of data readiness:
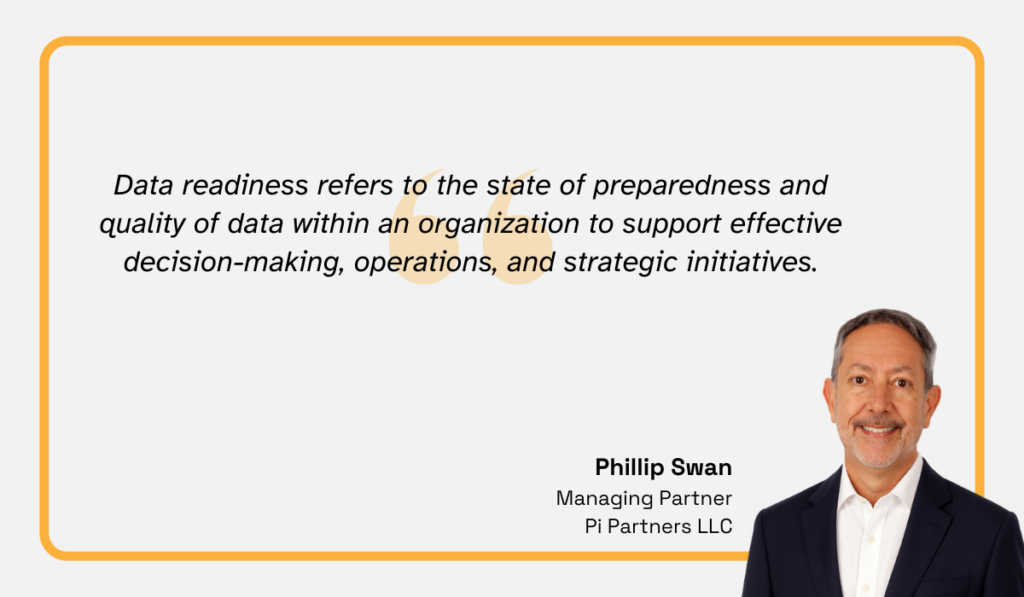
Illustration: Veridion / Quote: LinkedIn
So, before implementing BI, it’s vital to evaluate whether your data is accurate, complete, accessible, and properly structured to support analytics and decision-making.
Poor data quality or fragmented systems can only lead to misleading insights, wasted effort, and ultimately, failed BI initiatives.
Unfortunately, many organizations across industries face these very challenges.
According to an AlphaSense survey, a significant number of businesses worry about missing critical information and lack the ability to share insights effectively across teams.
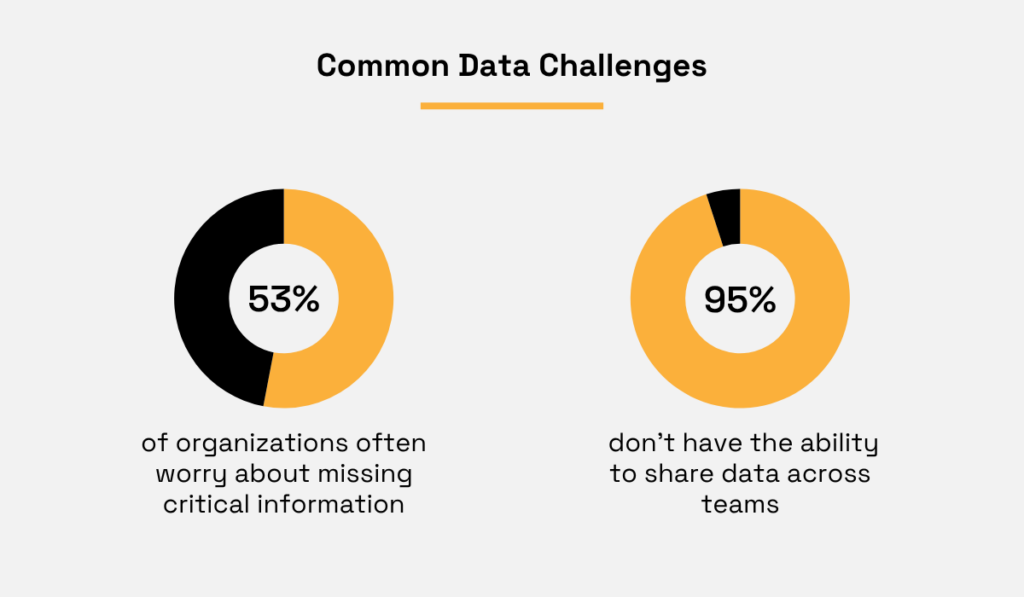
Illustration: Veridion / Data: AlphaSense
To find out if you’re dealing with that same problem, you should perform a formal data audit.
There are six key elements to examine:
| Data infrastructure | Assess the scalability, reliability, and performance of your data storage and processing systems |
| Data integration | Evaluate the efficiency, flexibility, and scalability of your data integration tools and processes |
| Data quality | Examine the accuracy, completeness, consistency, and reliability of data across all sources and systems |
| Data governance | Review the policies, processes, and controls that guide how data is managed and utilized within your organization |
| Data accessibility | Assess data availability, usability, and timeliness to ensure the right people can access the right information when needed |
| Data literacy | Evaluate the level of data skills and knowledge across the organization and identify areas for improvement |
Overall, you can think of data readiness as the foundation of a house.
You can invest in cutting-edge BI tools and set clear, ambitious goals, but if the foundation is weak, the whole structure is at risk.
Even the best BI implementation strategy can fail without strong executive backing.
After all, leadership support is what ensures funding, cross-departmental cooperation, and company-wide adoption.
Unfortunately, securing that support is often easier said than done, especially in the insurance industry.
KPMG research shows that insurance leaders are often hesitant about innovation, particularly when advanced technologies like AI enter the picture.
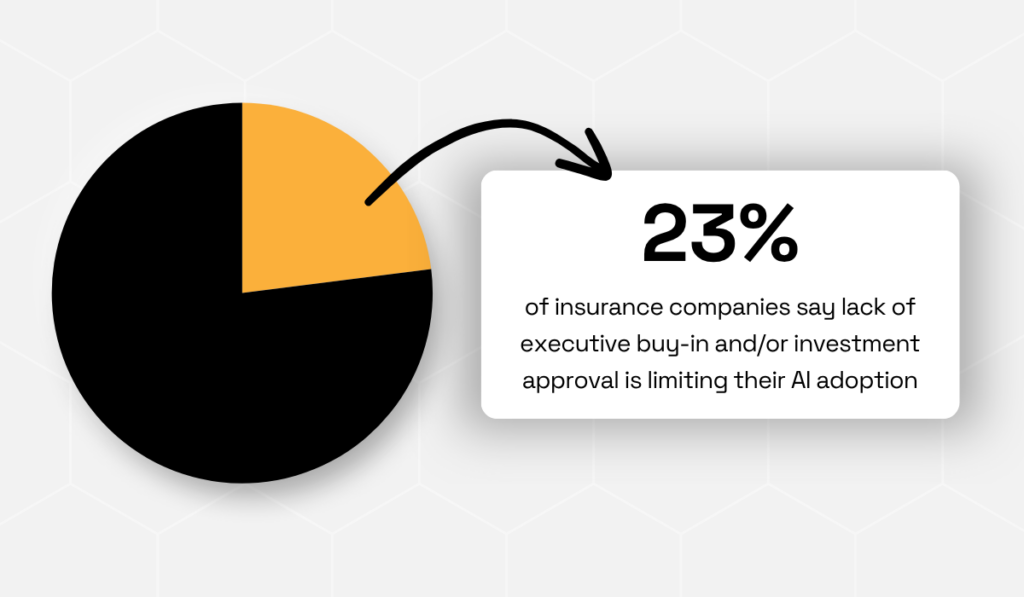
Illustration: Veridion / Data: KPMG
It’s understandable: they’re trained to avoid risk at all costs. Their trust must be earned, not assumed.
Robin Shufelt, CEO of the agricultural insurance company, First Acre Insurance Inc., has seen this firsthand many times.
She’s led innovation projects in environments where ambiguity isn’t welcome, and watched strong ideas stall simply because they didn’t resonate with decision-makers:
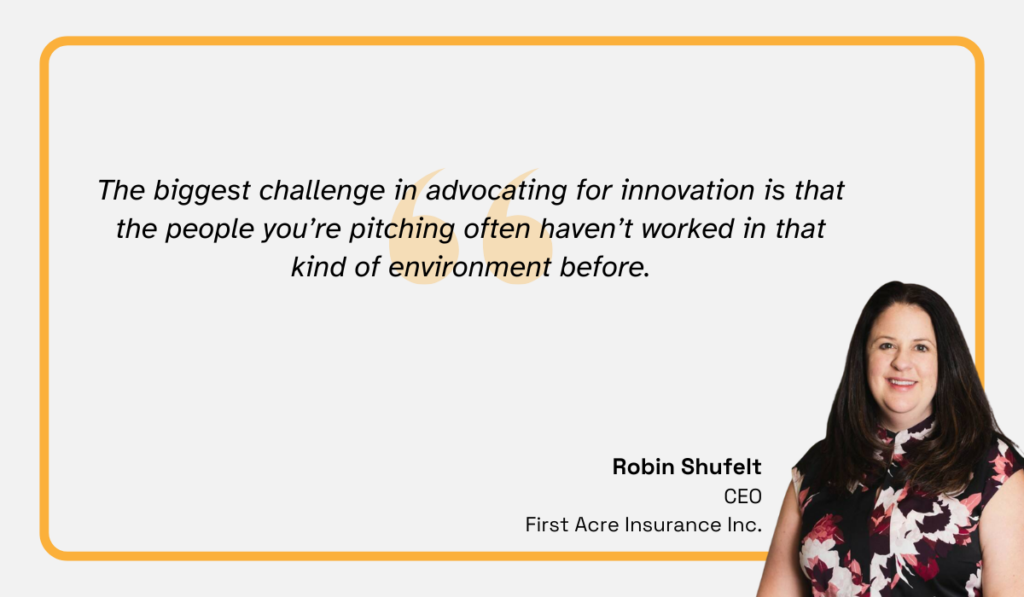
Illustration: Veridion / Quote: Insurance Business Magazine
That’s why, in this step, you need to speak the language of the leadership.
Build a value-driven business case, positioning BI as a strategic enabler, not just another IT project.
Demonstrate the potential ROI and quantify expected benefits. For example:
“Automating claims data pipelines could save $1M annually in operational costs.”
That kind of clarity captures attention.
You should also anticipate and address risk-related concerns up front.
Common objections include:
So be sure to prepare mitigation strategies such as robust data governance policies, phased rollouts, or targeted training programs upfront.
These not only reduce perceived risk but also strengthen your BI implementation roadmap itself.
Now it’s time to choose BI tools and infrastructure that fit your organization’s data maturity, budget, and scalability needs.
Selecting the right technology stack ensures your BI initiative can handle data efficiently, integrate multiple systems, provide actionable insights, and scale over time.
Below is a handy cheat sheet of possible tool types to consider, along with their functions and examples.
Some you may already use, while others might be completely new to you:
| Data storage tools | Centralize structured and unstructured data for analysis | Snowflake, Google BigQuery |
| Data integration/ETL tools | Extract, clean, transform, and consolidate data | Talend, Fivetran |
| Analytics & BI tools | Create dashboards, visualizations, and reports for decision-making | Tableau, Power BI |
All of these tools help organize and make sense of your data, making it more digestible and actionable.
But you might also want a solution that not only organizes your data but also finds relevant information, enriches your existing records, and verifies them automatically.
That’s where our AI-powered business intelligence platform, Veridion, comes in.
Veridion provides weekly-updated, granular data to help insurers monitor new entrants, assess potential partners, and detect competitive shifts before they appear in public filings or reports.
With 134+ million companies across 250 countries, 500 million locations, and 320 attributes per profile, Veridion delivers unprecedented global coverage to serve many commercial insurance use cases.
For example, it can help you:
In short, Veridion delivers high-quality data to improve your BI efforts, whether that means more accurate predictive models, reliable risk scoring, or actionable customer insights.
And the best part?
These advanced capabilities don’t come at the expense of user-friendliness.
You can see how data enrichment with Veridion works here:
Source: Veridion on YouTube
It doesn’t get simpler than that!
All in all, the main goal of this step is to find a solution that actually makes your job easier, faster, and more accurate.
So, be sure to research each tool carefully, and don’t hesitate to reach out to vendors with questions before making a final decision.
Now that you’ve done the hard work—conducted research, completed audits, and selected the right tools—you’re probably eager to dive into full-scale BI implementation.
However, it’s best to start small.
Instead of going full throttle, pick a single area, like claims or underwriting, and run a pilot.
This lets you test your processes, validate results, and fine-tune your approach without taking on unnecessary risk.
The 2025 Sigma report confirms that BI adoption typically comes with real challenges, both technical and cultural.
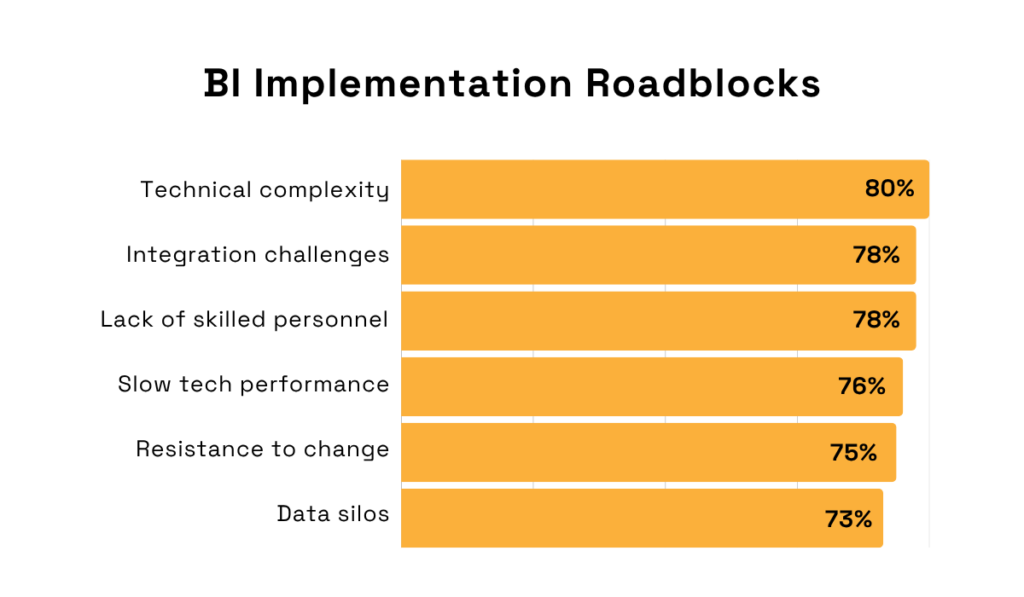
Illustration: Veridion / Data: Sigma
Running a pilot helps identify these issues early so they can be addressed before they escalate into major disruptions.
So, choose an area where BI can deliver visible benefits quickly, without overwhelming complexity, and implement it there first.
Be sure to monitor relevant KPIs to assess effectiveness.
For example, if you’re focusing on claims, track metrics like average processing time and backlog reduction.
Equally important is gathering feedback from stakeholders, so include end-users early to evaluate ease of use, relevance of metrics, and practical impact.
One effective way to compile and analyze feedback is with a feedback grid.
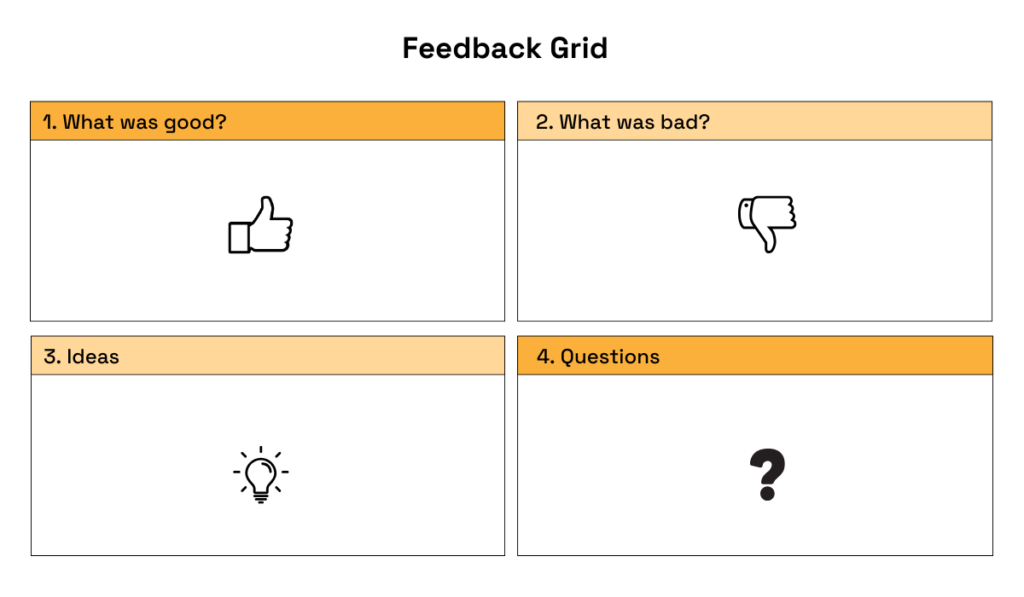
Source: Veridion
With four clearly labeled, color-coded sections, it visually communicates what’s working, what’s not, and where the project should head.
Start with broad categories like “Positive,” “Negative,” “Suggestions,” and “Questions” to keep things flexible; you can refine them as you collect more feedback.
Don’t forget to include this feedback in your final report, along with lessons learned in areas such as:
Do this right, and you’ll have all the insights you need to refine your approach before a full-scale rollout.
As a result, you’ll benefit from a smoother implementation, stronger adoption, and a much higher chance of success.
Insurance BI isn’t a “set-it-and-forget-it” type of project.
It’s an evolving system that must adapt to new goals, regulations, and data realities.
That’s why it’s important to continuously track performance, data quality, and adoption, while also improving iteratively.
This is the only way to ensure your BI continues delivering business value over time.
The 2023 Databox survey shows that regular monitoring really pays off.
As it turns out, an overwhelming majority of professionals across industries reported that monitoring and reporting improved their performance at least to some degree.
In fact, it helped them unlock a wide range of benefits, from increased team effectiveness and easier trend identification to improved financial performance.
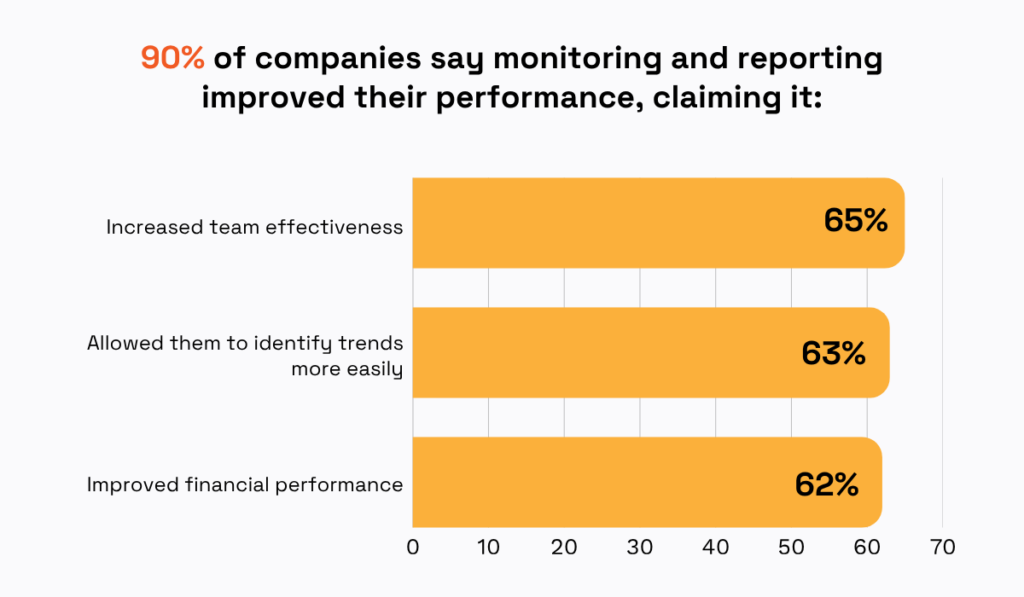
Illustration: Veridion / Data: Databox
You can achieve the same for your BI implementation.
Remember those expected outcomes and KPIs you outlined earlier?
This is where they become truly important.
Once you start using BI regularly, you’ll need to establish a cadence of monthly or quarterly BI performance reviews that compare these outcomes with actual results.
If everything is going according to plan, congratulations! You can continue on your current path or set new goals.
But if you notice signs of falling behind, it’s a signal that something needs improvement.
Perhaps the tool you chose is too complicated for some users, there are lingering data silo issues, or the KPIs you set were off the mark.
No need to panic, but don’t ignore these red flags either.
Instead, perform a root cause analysis to identify the underlying issue.
By digging deeper, you’ll be able to implement effective, long-term solutions that prevent the problem from recurring and get your BI efforts back on track.
Implementing BI in insurance is a lot of work, with every step requiring patience, attention to detail, and extensive research.
It can certainly feel overwhelming.
But when done right, it pays off with clearer insights, faster processes, and measurable business impact.
The key here is constant monitoring: tracking KPIs, reviewing outcomes, and addressing problems as they arise.
Remember, BI isn’t a one-time project; it’s an ongoing process.
So stay vigilant, iterate continuously, and, over time, you’ll create a powerful system that actively drives smarter decisions and long-term success.