
Blog
How to Identify a Company’s Critical Operational Assets During Due Diligence
By: Stefan Gergely -
12 January 2026


We love our data, and now that you're here, you're one step closer to loving it too.
A wide sample of data, so you can explore what is possible with our data
Choose ->
built with procurement in mind. Focused on manufacturers, products and more
Choose ->
built with insurance in mind. Focused on classifications, business activity tags and more
Choose ->
built with sustainability in mind. Focused on sustainability commitments, and environmental and social governance insights.
Choose ->
built with strategic insights in mind. Focused on market trends, competitor analysis, and industry-specific data
Choose ->

Keep up to date with our technology, what our clients are doing and get interesting monthly market insights.

Key Takeaways:
True operational due diligence requires knowing where the business actually exists in the real world.
From physical plants and distribution hubs to data centers and supplier-operated sites, a hidden vulnerability in any location can quietly become a multi-million-dollar disruption.
This guide breaks down how investors can systematically map, validate, and risk-assess operational assets with better clarity and confidence.
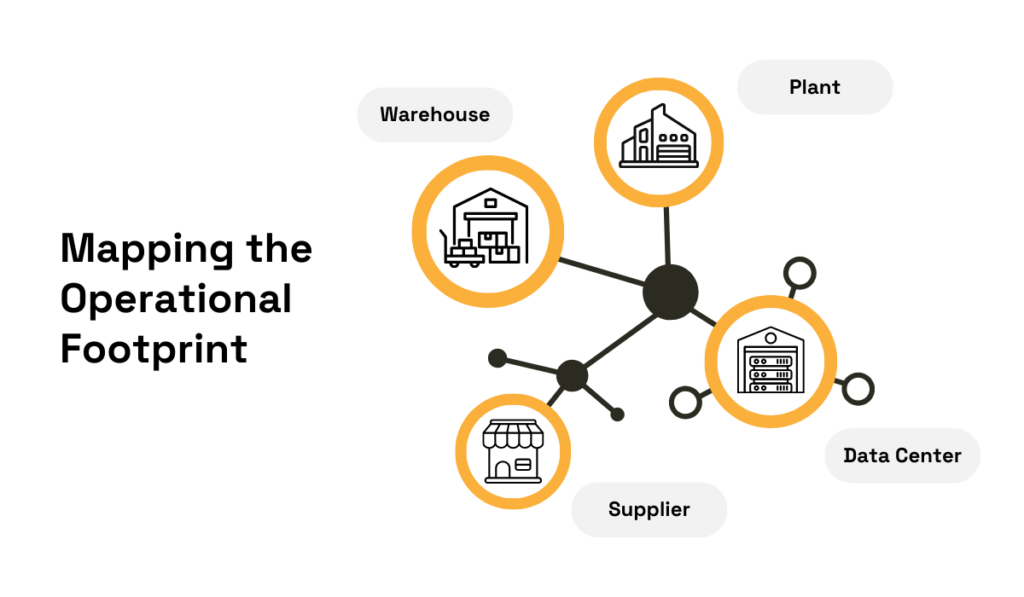
Identifying a company’s critical operational assets begins by constructing a comprehensive physical footprint of where the business actually operates.
Relying solely on management-provided spreadsheets and listing assets as either manufacturing locations or warehouses simply won’t do.
After all, these are often incomplete or outdated, while mapping a complete operational footprint means you’re capturing:
In other words, you need to be able to pinpoint and differentiate between data centers, critical service hubs, regional offices, and supplier-operated facilities that support delivery and continuity.
Source: Veridion
Without such a detailed footprint, you’ll have limited insight into operational capacity, single points of failure, and asset concentration risk.
These visibility gaps mask operational risk until it becomes evident, often only after a disruption has already occurred.
The 2021 OVHcloud Strasbourg data center fire, which affected 3.6 million websites across several countries, is one notable example of hidden dangers.
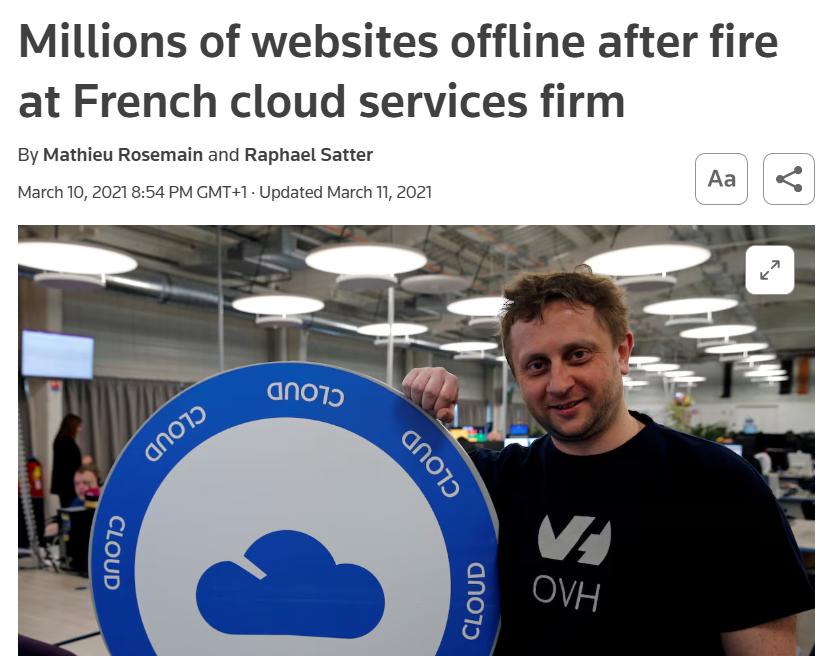
Source: Reuters
The company had no fire prevention system in place.
To make matters worse, some affected customers had paid extra to have OVH back up their data in the event of a disaster.
However, it turned out that these backups were stored in the very same building as the main server, leading to a catastrophic loss of data, fines, and a class-action lawsuit.
Now imagine what the losses would have been like for investors and underwriters who had misclassified Strasbourg as just “one of several data centers.”
So how can investors build this footprint correctly and avoid undervaluing risk and mispricing exposure?
A smart approach starts with structured manual verification, namely:
Once a manual foundation is established, automated location discovery tools can fill in missing pieces.
Orbis by Moody’s is one such corporate due diligence tool.
This tool allows investors to map subsidiaries and related entities, identify connected physical sites, and surface operational facilities associated with those entities.
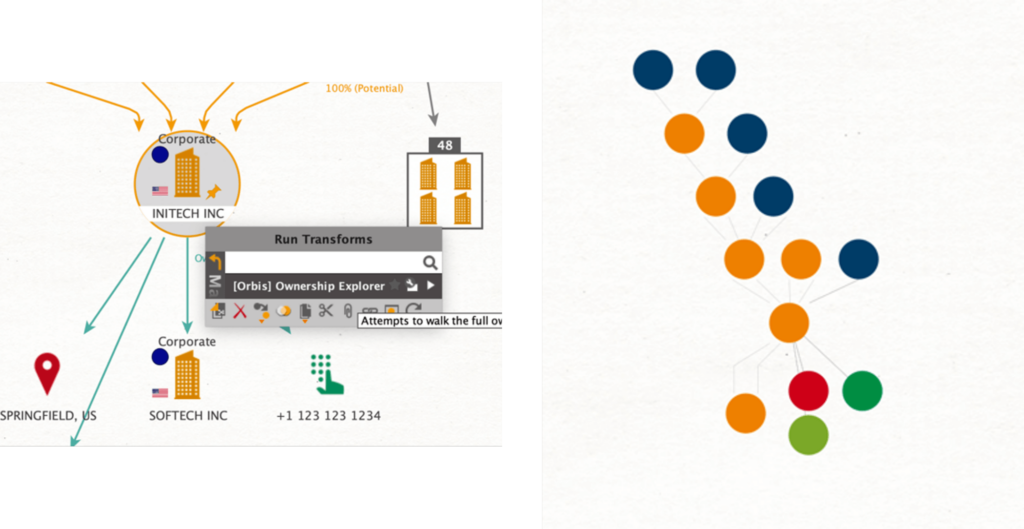
Source: Maltego
Pretty neat, right?
With a fully mapped operational footprint, investors gain visibility into the physical network that underpins the business.
This, in turn, helps establish the clarity you need for evaluating asset criticality in later steps.
Once the operational footprint is mapped, each location needs to be validated and enriched with key operational details such as size, production volume, workforce, and facility function.
Proper enrichment ensures investors understand the relative importance of each site and can spot missing, misclassified, or underappreciated assets.
As we’ve already established, disruption or even destruction of a critical facility can trigger substantial financial losses, which in itself increases the need for site-level clarity.
Manual data validation typically involves reviewing contracts, lease agreements, corporate filings, and local business registries, and cross-checking with internal records.
But when you factor in all the locations and complicating factors, it soon becomes clear that this process is extremely time-consuming and prone to errors.
According to XPLM’s 2023 research, manual data exchange remains prevalent, despite over 70% of respondents recognizing it frequently causes mistakes and miscommunication.
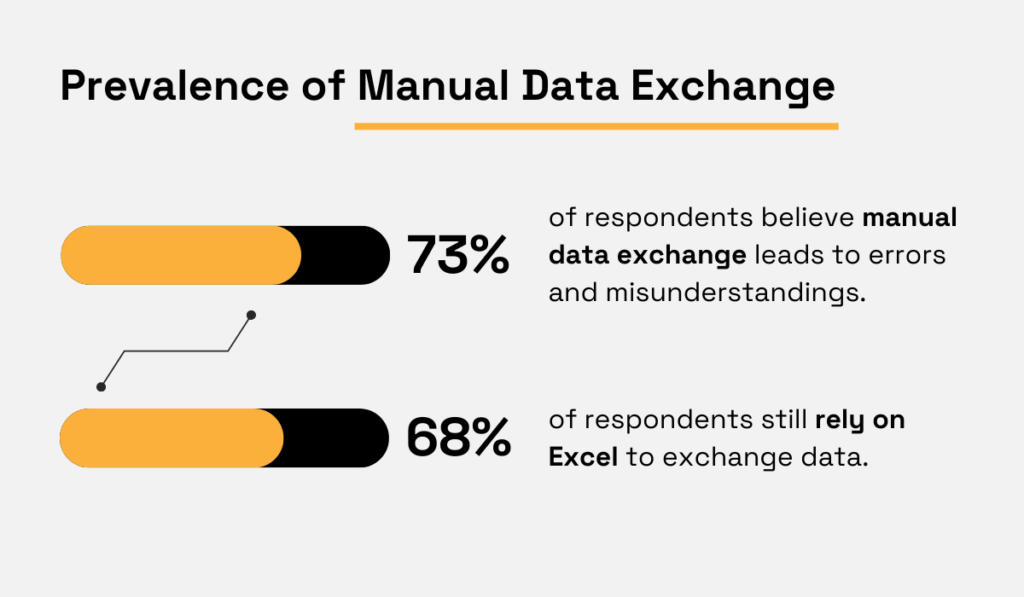
Illustration: Veridion / Data: XPLM
This is why the right software is crucial.
Platforms with global business identity and location enrichment capabilities allow investors to confirm site accuracy, surface previously unknown facilities, and reduce blind spots caused by fragmented data.
One such tool is Veridion, which provides AI-powered insights across a global dataset of over 134 million companies, supplying verified, weekly-updated data suitable for multiple use cases.
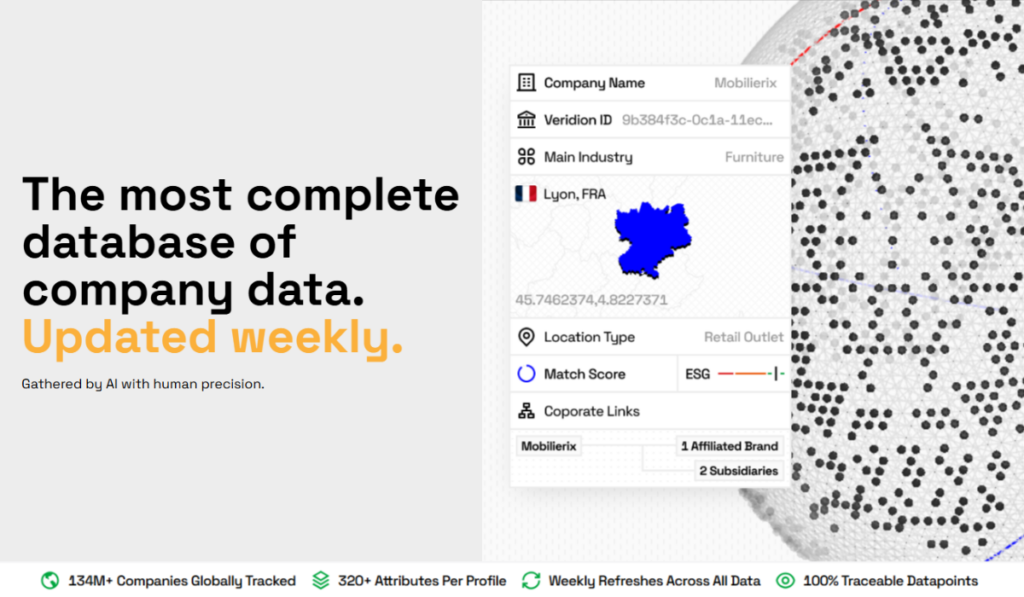
Source: Veridion
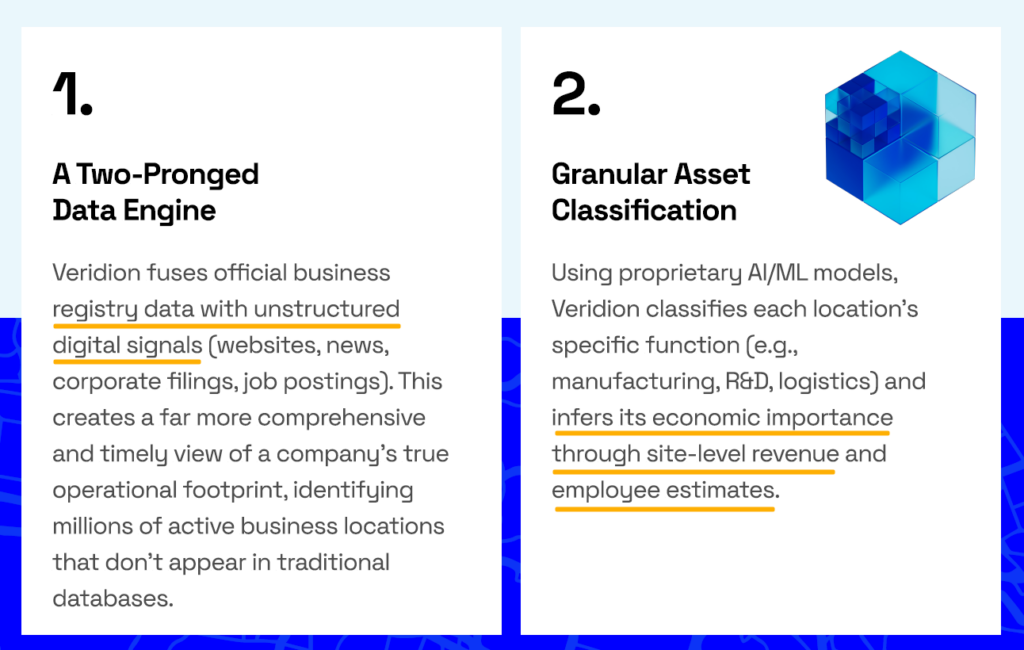
Using proprietary AI/ML models, Veridion fuses official business registry information with unstructured digital signals such as websites, news, filings, and job postings.
That way, you’re identifying millions of active business locations missing from traditional databases while sacrificing none of the depth—quite the contrary.
Source: Veridion
The platform then classifies each location’s function based on multiple operational indicators.
Some of the key enriched data assets include:
| Data Points | Purpose |
|---|---|
| Location & Function | Precise coordinates and classification of each facility |
| Building Intelligence | Area, height, and number of floors to gauge operational scale |
| Site-Level Financial Metrics | Inferred revenue and employee counts per location |
| Co-Tenancy Data | Shared facilities and operational dependencies |
The enrichment dashboard is intuitive, with natural language processing and multiple enrichment options, providing clear summaries of enriched companies at a glance.
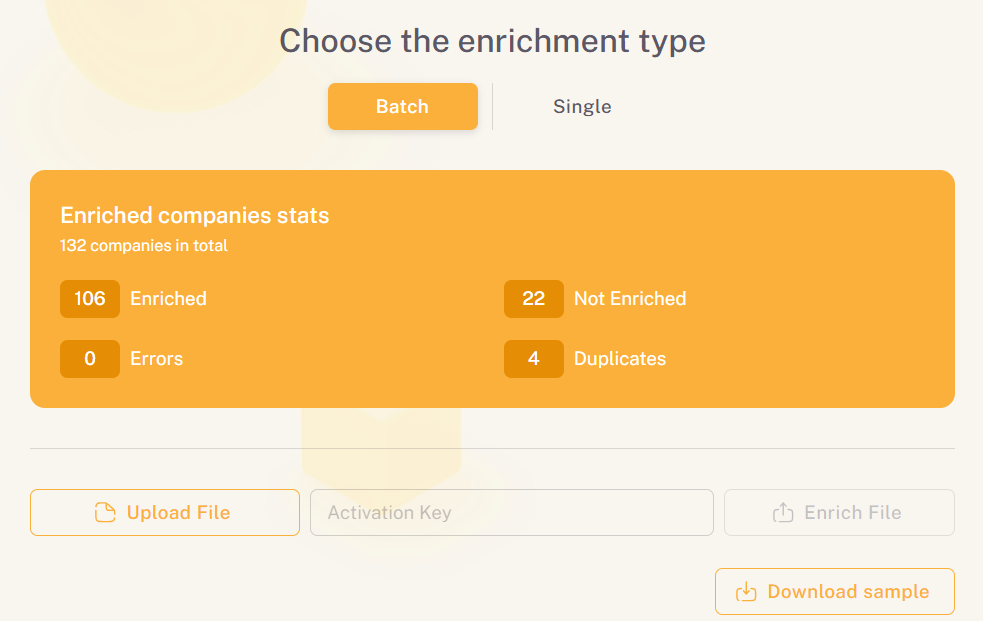
Source: Veridion
By combining foundational manual validation with automated enrichment, you gain in-depth insights into each site’s operational significance.
And the impact?
Smarter risk assessment, more accurate valuation, and reduced exposure to hidden vulnerabilities.
Criticality assessments are essential for investors to distinguish high-value, indispensable assets from lower-impact facilities.
By understanding which assets are truly mission-critical, investors can anticipate operational vulnerabilities and prioritize mitigation strategies.
To evaluate each location’s business impact, investors should consider a mix of operational, financial, and dependency-based metrics.
Flavio Queiroz, a cybersecurity and threat intelligence expert, notes the following:
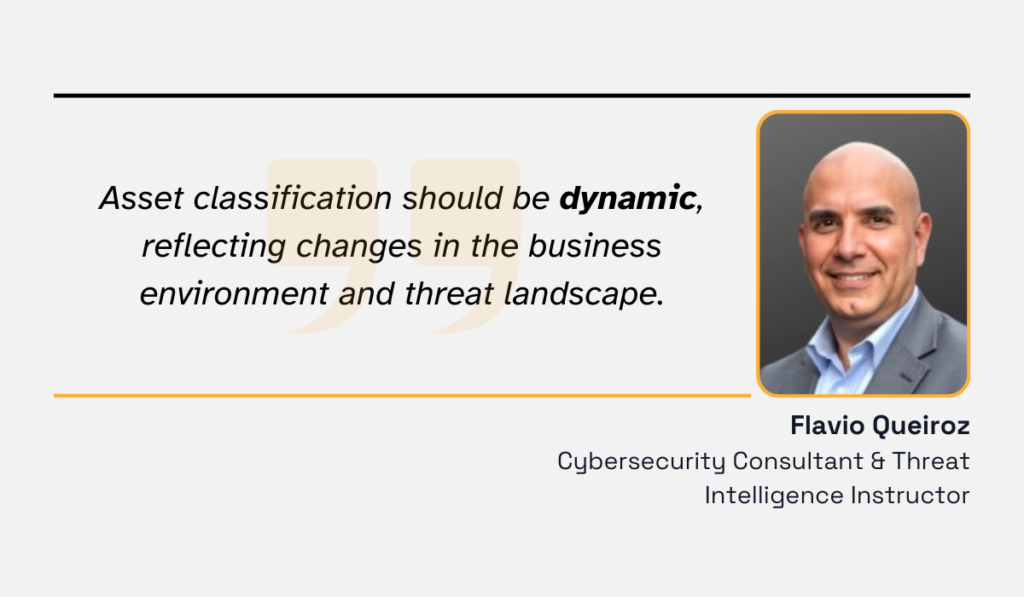
Illustration: Veridion / Quote: LinkedIn
As a core component of due diligence, these assessments directly inform valuation, risk mapping, and investment decisions.
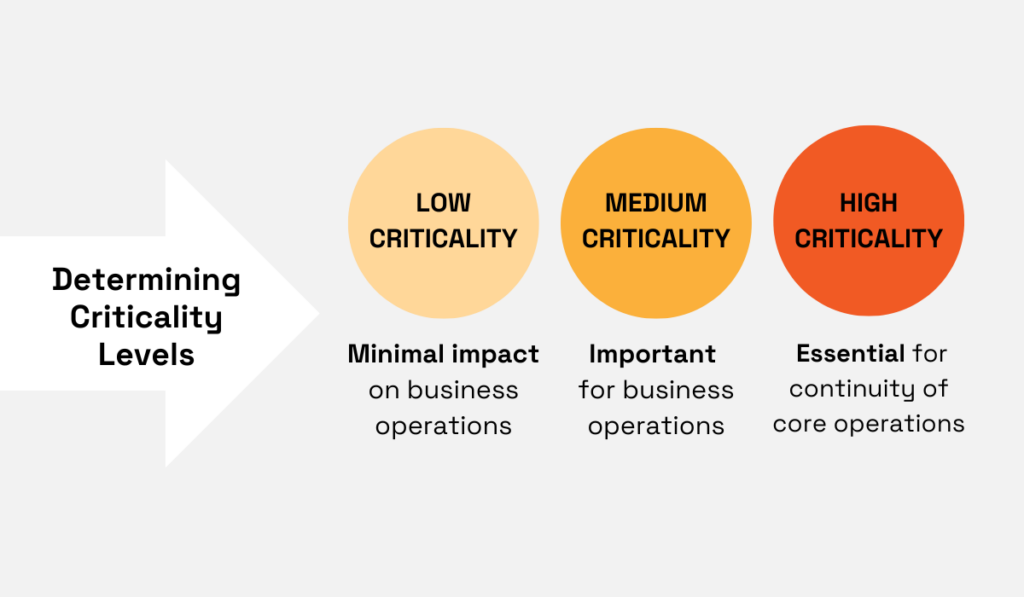
A practical approach is to begin by defining criticality levels for the company in question.
A typical classification scheme will distinguish between three levels:
This is what these levels look like at a glance.
Source: Veridion
With that understanding, the criteria for assessing each asset can include:
| Criteria | Questions to Ask |
|---|---|
| Functionality & Usage | Does this asset support essential operations or services? |
| Data Sensitivity & Regulatory Requirements | Does it process personal data, intellectual property, or regulated information? |
| Recovery Time Objective (RTO) | How quickly must the asset be restored after disruption to avoid significant losses? |
| Dependency | How many other systems or processes rely on this asset? What would be the impact of unavailability? |
Dependencies, in particular, are critical from an investor perspective.
Visualizing how assets connect highlights single points of failure that could trigger cascading operational or financial impacts, such as identifying a warehouse that supports multiple production lines.
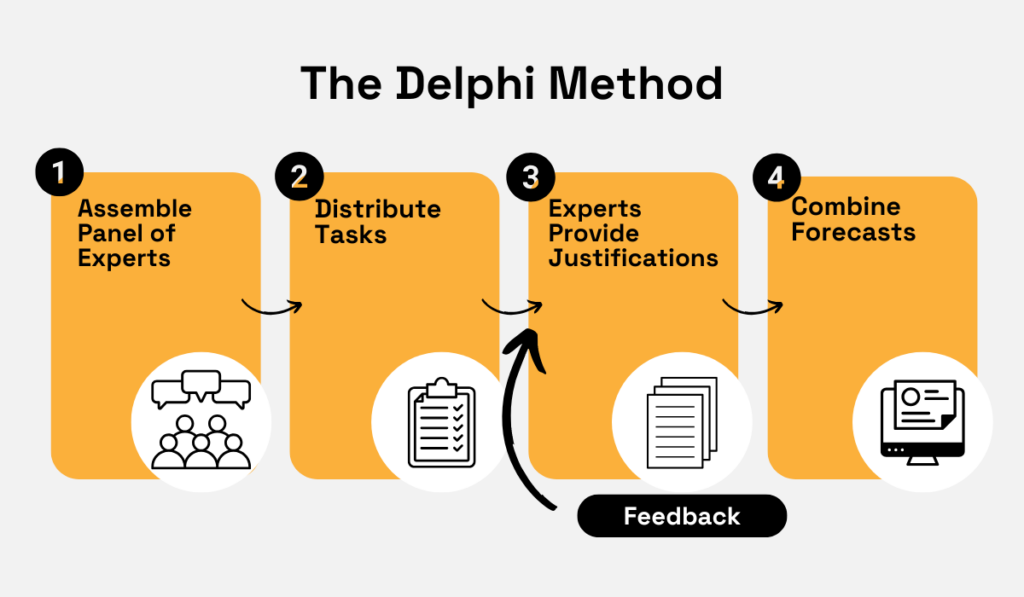
In many cases, especially when it comes to complex or multilocation businesses, no single person holds complete knowledge of how all sites interconnect.
That’s where a structured consensus method like the Delphi Technique becomes relevant.
By assembling a diverse panel of subject-matter experts for multiple rounds of questionnaires, investors can systematically collect judgments on which assets are most critical.
After each round, you aggregate anonymous responses and share them back with expert groups for adjustments until a true consensus is reached and blind spots are eliminated.
Source: Veridion
Ultimately, applying criticality assessments either through metric‑driven scoring or structured expert consensus transforms a raw operational map into a more risk‑aware view, showing you which company assets truly matter.
That output then becomes the foundation for resilient investment, underwriting, and risk mitigation decisions.
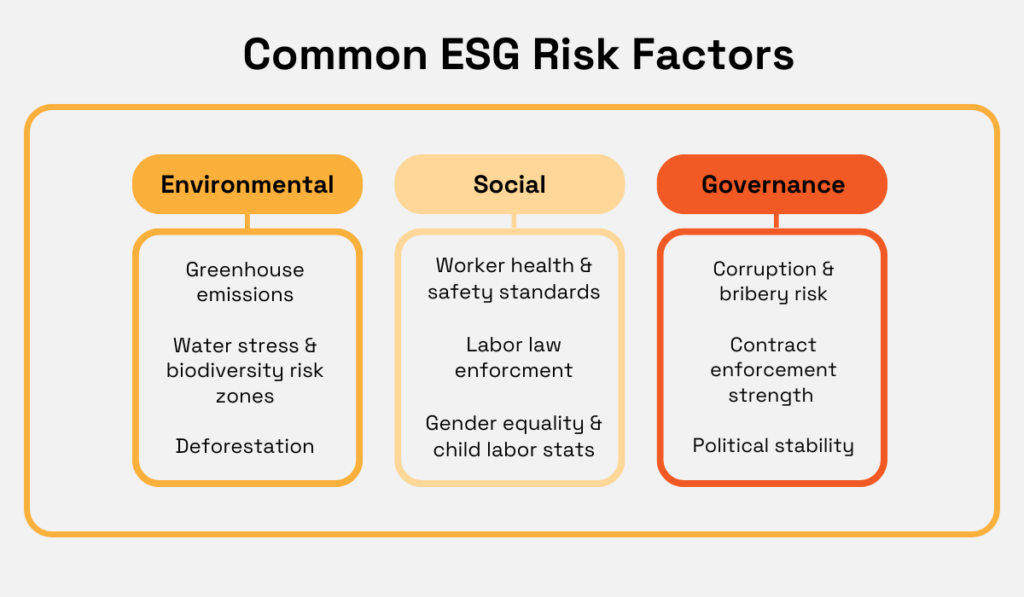
Location-based risk is one of the strongest predictors of long-term asset stability, and applying an ESG lens immediately sharpens the whole process.
Investors who overlay physical climate risk, geopolitical exposure, labor availability, and infrastructure resilience directly onto the operational footprint are in a better position to accurately flag which high-criticality assets sit inside high-risk environments.
This, in turn, helps you distinguish sites that are merely important from those that could trigger systemic disruption, thereby paving the way for more realistic scenario planning.
ESG risk categories span several dimensions, from environmental concerns like water scarcity and biodiversity risk to labor standards and governance signals like corruption risk.
Source: Veridion
Despite notable ESG backlash impacting sustainable investing, the situation on the market indicates that minimizing ESG risk remains one of the key priorities.
To put it differently, ESG transparency directly shapes access to capital, which is why investors can’t and won’t treat ESG as a marketing checkbox.
And research backs this up.
A 2025 ESG Global Study by Capital Group showed that ESG adoption stands at 87%, with investors diligently applying ESG approaches across different asset classes, as outlined below.
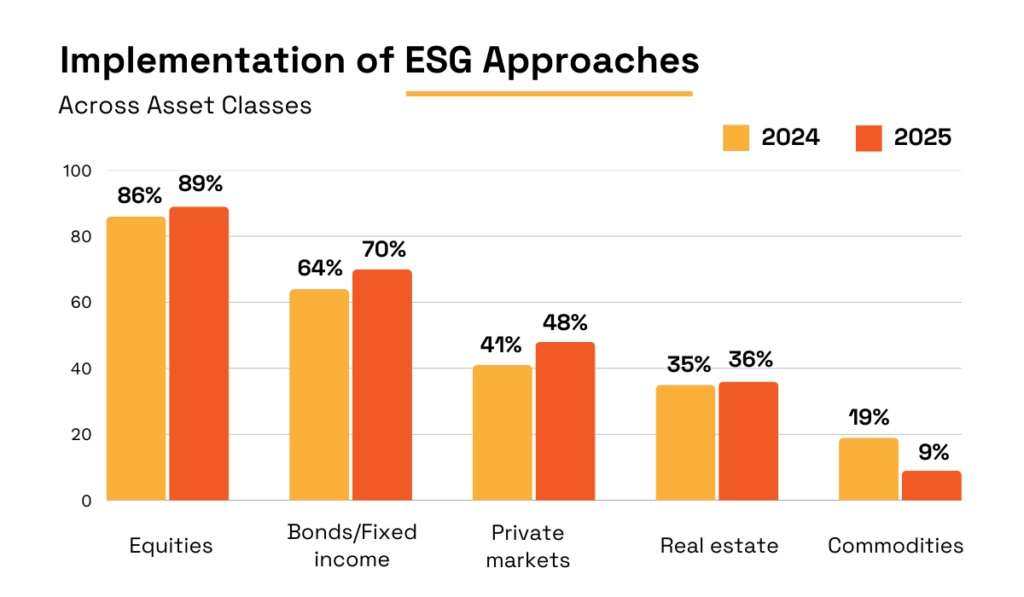
Illustration: Veridion / Data: Capital Group
Only the commodities category recorded a drop in ESG implementation, while equities, bonds, and private markets record a higher adoption rate.
For equities in particular, adoption remains high because public-market companies face greater disclosure pressures, shareholder scrutiny, and reputational sensitivity.
Meanwhile, an investment director at an Australian super fund explains that private market investments require greater ESG scrutiny simply because once the capital is deployed, there’s no easy exit.
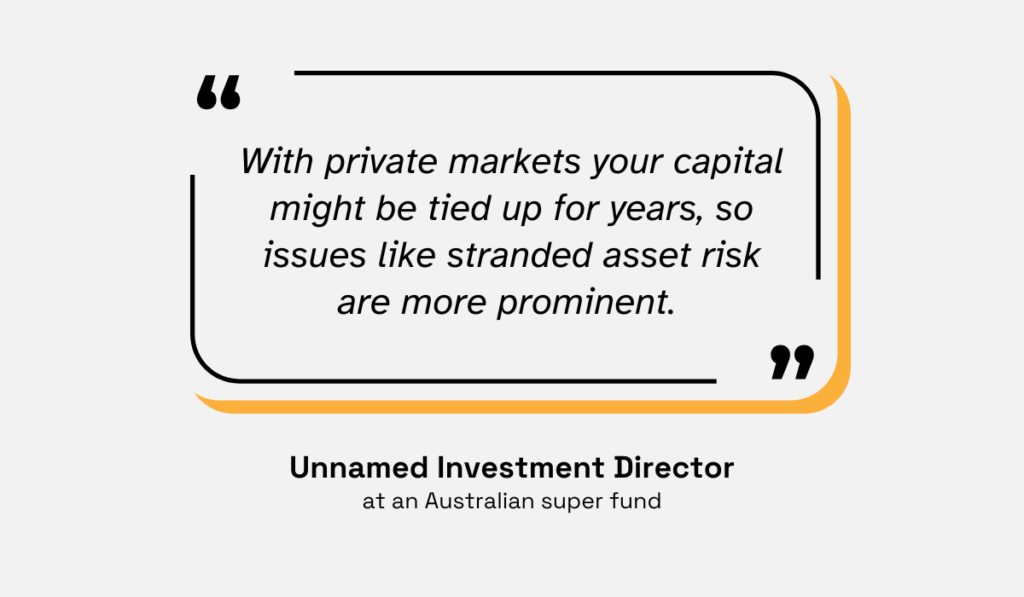
Illustration: Veridion / Quote: Capital Group
Naturally, creating these ESG overlays is much easier with AI-powered tools and expansive datasets.
And when applied to site-level data, subtle but material vulnerabilities are sure to surface.
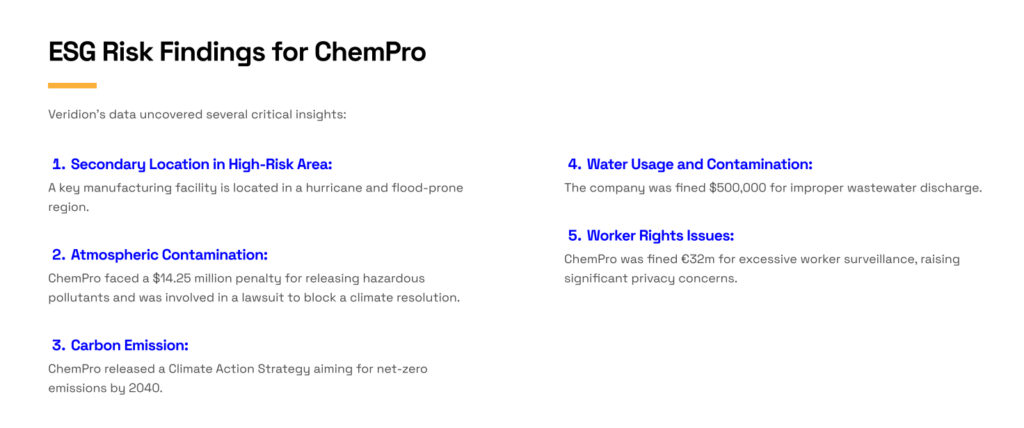
For example, in one ESG risk evaluation of a mid-market chemical supplier, analysts successfully identified previously unknown secondary facilities operating in high-regulation jurisdictions.
By relying on Veridion’s platform, they also uncovered documented issues surrounding wastewater handling and worker safety practices.
Source: Veridion
Tools like these help investors calibrate risk based on concrete, documented signals rather than speculation or gut feeling.
When ESG risk overlays are layered onto criticality assessments, investors gain additional visibility into which facilities matter most and whether they’re at high risk of failing in practice.
Once critical sites have been identified and evaluated through operational and ESG lenses, the final step is expressing those risks in financial terms.
This is where due diligence stops being theoretical and directly informs valuation, underwriting, and deal terms.
As explained by AuditBoard’s Alan Gouveia, risk quantification translates to a more precise estimation of probabilities and potential losses, which yields clear numbers.
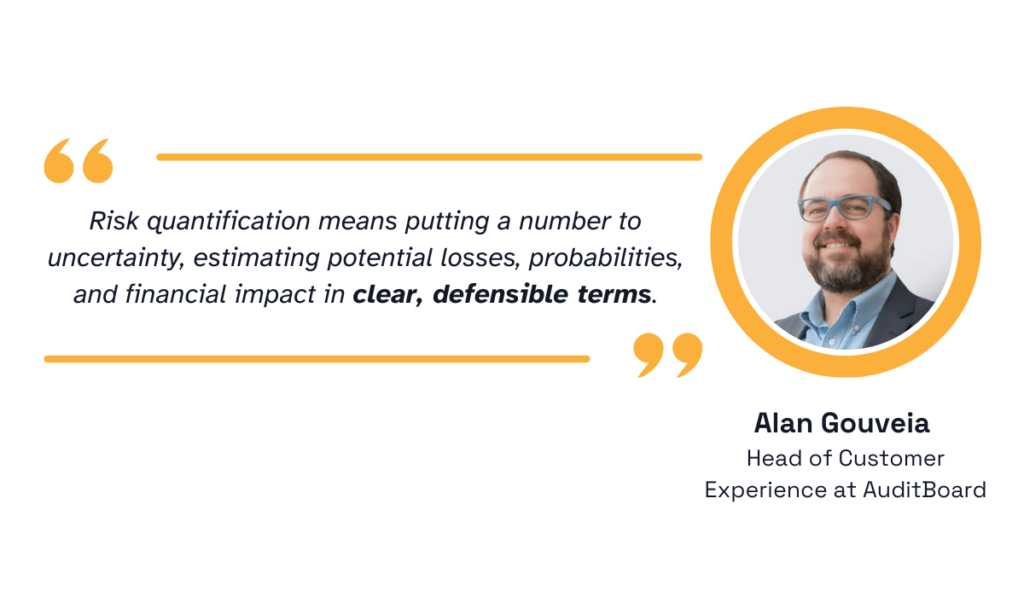
Illustration: Veridion / Quote: AuditBoard
Why is this so important?
Simply put, financial clarity guides all decision-making, making it much more of a requirement than a bonus in this day and age.
Asset-level financial modeling, in particular, is an essential component for distinguishing manageable risks from material investment concerns.
As such, investors need to incorporate multiple valuation methods, including:
| Downtime Cost Modeling | Calculating the cost per hour or day of operational disruption |
| Revenue Concentration Analysis | Determining which percentage of overall revenue flows through a specific site |
| Margin Impact Assessment | Estimating margin erosion from lost production or service outages |
| Resilience & Mitigation Costing | Modeling the cost-benefit of upgrades, redundancies, and contingency measures |
This turns qualitative risk into hard, defensible financial terms, thereby strengthening negotiation leverage and insurance strategy.
Consider the following scenario:
A facility is assumed to be a basic warehouse, which is why an investor models minimal interruption risk.
However, if that site is actually a mission-critical R&D lab generating an estimated $19M in IP-driven revenue, the financial reality changes dramatically.
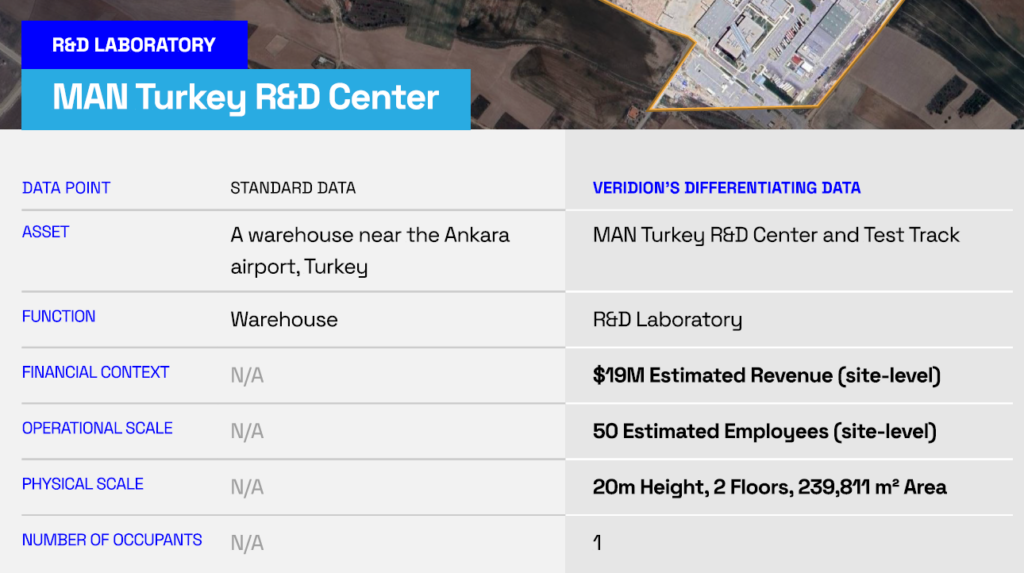
Source: Veridion
That reclassification requires:
Misclassifying this type of site can create $15–20M in uninsured loss, and when such mis-scorings compound across an industrial portfolio, systemic financial risk balloons sharply.
In the end, translating risk into monetary values ensures that investors go beyond simply identifying critical sites.
The key objective is to price them correctly, negotiate more intelligently, and avoid inheriting invisible liabilities, and that’s exactly what quantifying financial exposure does.
Understanding the physical footprint and full risk context of corporate assets is no longer optional.
Whether evaluating operational resilience, underwriting exposure, or long-term value, each step in the process must be treated as essential to success.
Beyond using proven methods, incorporating robust location intelligence and continuous data enrichment improves your ability to detect the tiniest cracks before they expose systemic failures.
As you move forward, make sure to closely examine which due diligence methodologies and data-driven tools you rely on, and whether they’re sufficient for the level of risk you’re actually carrying.
After all, decisions made today shape whether you’re exposed to hidden liabilities tomorrow.