
Blog
How to Do a Quantitative Risk Assessment (QRA)
By: Stefan Gergely -
04 April 2026


We love our data, and now that you're here, you're one step closer to loving it too.
A wide sample of data, so you can explore what is possible with our data
Choose ->
built with procurement in mind. Focused on manufacturers, products and more
Choose ->
built with insurance in mind. Focused on classifications, business activity tags and more
Choose ->
built with sustainability in mind. Focused on sustainability commitments, and environmental and social governance insights.
Choose ->
built with strategic insights in mind. Focused on market trends, competitor analysis, and industry-specific data
Choose ->

Keep up to date with our technology, what our clients are doing and get interesting monthly market insights.

Key Takeaways:
Your organization already tracks incidents, losses, and control performance across the enterprise.
But visibility doesn’t necessarily create clarity.
What leaders need are defensible numbers that support confident action.
That’s where a quantitative risk assessment (QRA) becomes essential.
It translates uncertainty into measurable financial exposure, compares risk across business units, and shows which investments actually reduce loss (and by how much).
Whether you’re allocating capital, strengthening resilience, or justifying controls to leadership, QRA turns risk into a decision framework.
This guide outlines the key steps to build a quantitative risk assessment that informs strategy.
A QRA is only as accurate as the assets it measures.
If your asset data is incomplete, your model is incomplete, and the decisions built on it will be flawed.
Missing supplier sites, unmapped facilities, or undocumented infrastructure dependencies create invisible exposure.
This means capital gets misdirected, vulnerabilities go undetected, and risk analysis loses credibility.
This is why asset identification is more than a preliminary step; it’s the foundation of quantification.
You cannot measure risk across assets you cannot see.
Many organizations underestimate how difficult it is to maintain an accurate operational footprint.
Toyota learned this the hard way.
When the 2011 earthquake and tsunami struck Japan, Toyota halted production globally. Its priority was to understand exactly what had been affected.
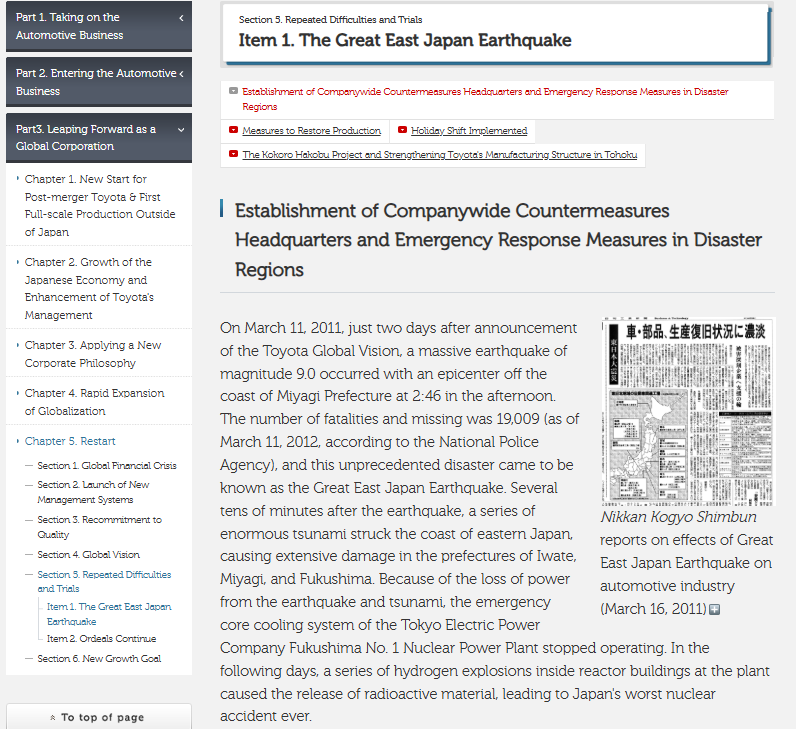
Source: Toyota Global
Toyota began mapping every impacted facility, supplier, and component source across its network.
That immediate mapping effort gave leadership a clear view of which operational nodes were critical and which disruptions posed the greatest threat to production continuity.
As the company assessed the damage, it discovered some production lines were halted because small upstream suppliers could not deliver essential components.
In response, Toyota built a real-time supply chain visibility system that tracks operational status and interdependencies continuously.
It transformed their ability to detect risk exposure early and coordinate recovery actions.
The result was structural resilience, not only recovery.
The lesson is this: a comprehensive, continuously updated asset inventory is what makes quantitative risk assessment actionable. Without it, you cannot effectively do risk modeling.
Consider asset mapping as a data integration exercise. The goal is to pull structured, verified data from every system that touches your operations and consolidate it into a single record.
That means aggregating asset data from your:
It means standardizing naming conventions and ownership structures so records are consistent across sources.
Every physical site and supplier facility should be geolocated.
Likewise, every asset should carry a business criticality rating, whether that’s defined by revenue impact, operational dependency, or regulatory importance.
And critically, this record needs to stay current. A static asset inventory is almost as dangerous as no inventory at all.
The moment your supplier base shifts or a new dependency is introduced, your model needs to reflect it.
This is where data intelligence platforms like Veridion can accelerate the process. It enriches asset records with:
By doing this, the platform closes the data gaps that weaken risk models at this stage, without requiring your team to chase down information manually.
This significantly increases efficiency and data accuracy.
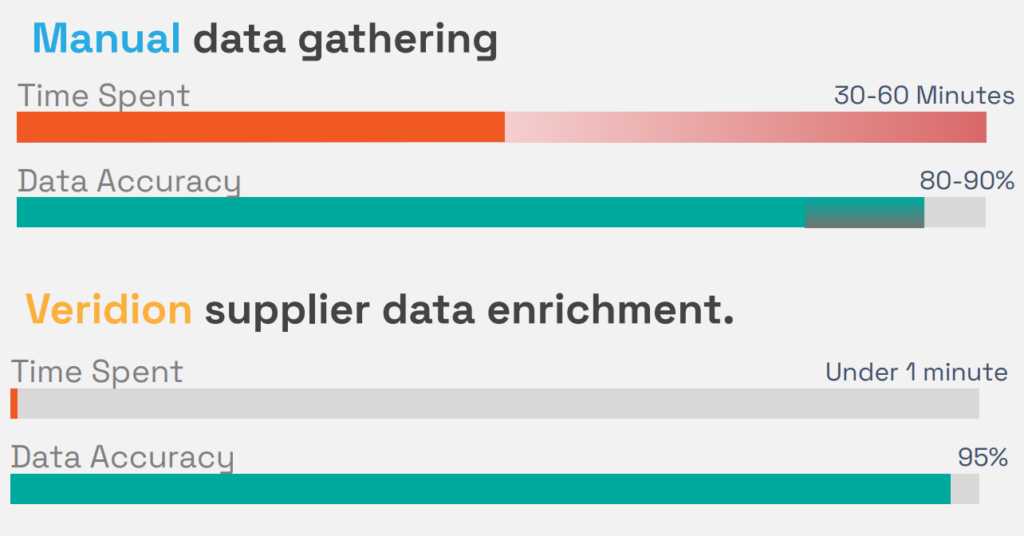
Source: Veridion
The cleaner and more complete your asset data, the more confident you can be in every quantitative output that follows.
Most risk assessments fail because scenarios are poorly defined.
You can’t assign probability to something undefined. You can’t estimate financial impact without specifying what fails, where it fails, and how long the disruption lasts.
When risk framing is weak, modeling becomes an exercise in false precision.
The cost of skipping this step can be catastrophic, and BP’s Deepwater Horizon disaster in 2010 is one of the starkest examples in corporate history.
When the offshore drilling rig exploded in the Gulf of Mexico, triggering the largest marine oil spill in U.S. history, investigations found:
There was no formal risk assessment of several high-risk operational decisions made in the days leading up to the blowout.
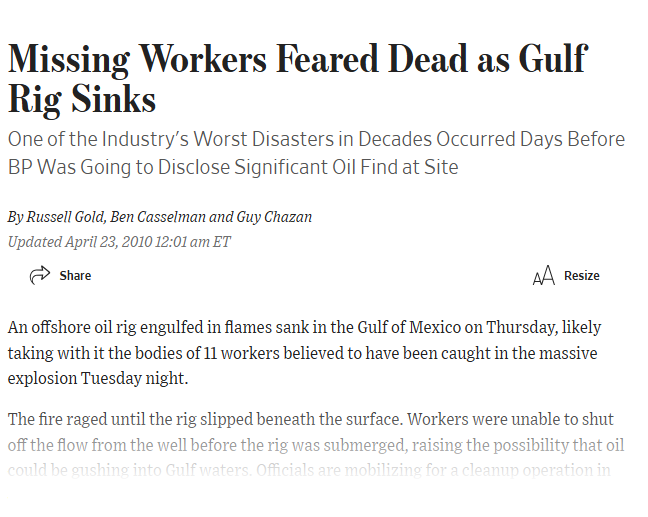
Source: The Wall Street Journal
The company also didn’t fully map failure pathways.
Warning signs were misread. There were no contingency plans in place. Multiple safety systems failed in sequence, with no effective intervention.
The financial consequences alone ran into the tens of billions for:
This is far exceeding what structured scenario planning would have required.
When risk scenarios are vague or undefined, you lose the ability to anticipate failure pathways before they unfold. By the time you’re responding, the damage is already done.
Clearly defining risk scenarios is what allows you to anticipate failure.
So what does a well-defined risk scenario actually look like?
Every quantifiable scenario should answer five questions:
A useful way to build this out is through a structured template for each asset.
It should capture the:
Here’s what that looks like practically:
“Flooding disables the distribution center in Houston for five days, reducing order fulfillment capacity by 30%.”
This single sentence provided the inputs for quantitative modeling.
Compare that to a vague statement like “weather-related supply chain disruption,” and you’ll see the difference in analytical value.
Precision at this stage determines the accuracy of everything that follows.
After defining scenarios, the next step is estimating how often they occur.
This is where some make a big mistake, estimating the risks in completely different ways.
Suppose one risk is estimated using internal historical data, another using intuition, and a third using external reports.
The result is that your risk register becomes a mess of different, unreliable information.
You don’t need perfect probabilities; you need comparable probabilities.
If every risk is estimated using the same method, you can trust your ranking. If they’re not, your entire assessment is not reliable.
Target’s massive data breach demonstrates the cost of underestimating likelihood:
In 2013, attackers breached Target by entering through a third-party HVAC vendor’s system: a known but underweighted risk pathway.
The intrusion started quietly weeks before detection, showing how quickly a low-visibility threat can escalate when its probability is underestimated.
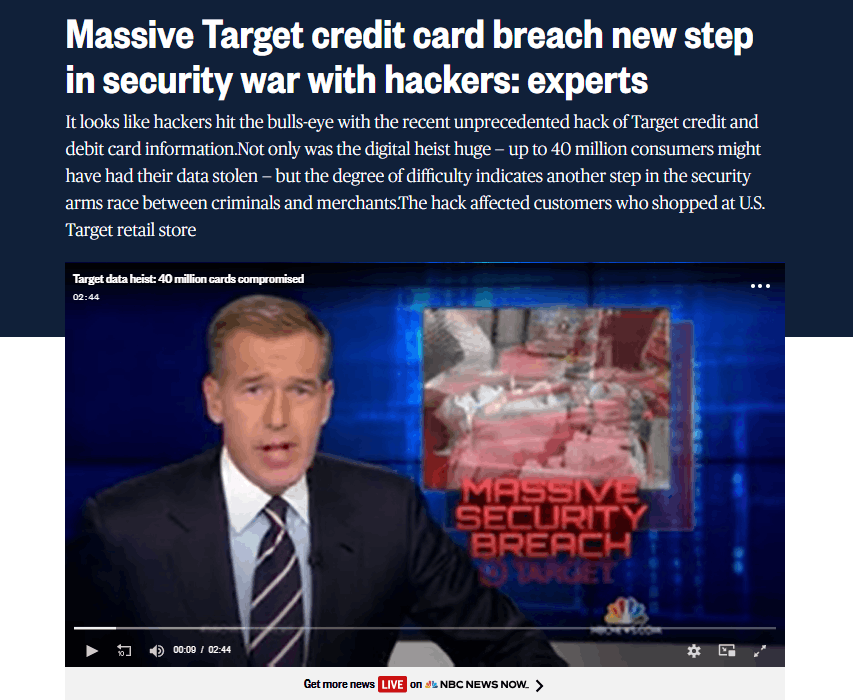
Source: NBC News
The company did not view third-party access as a high-likelihood entry point, even though vendor connections were already recognized as a significant cybersecurity risk across the retail industry.
In 2024, third-party access was linked to 35.5% of breaches, underscoring how common this attack path had become.
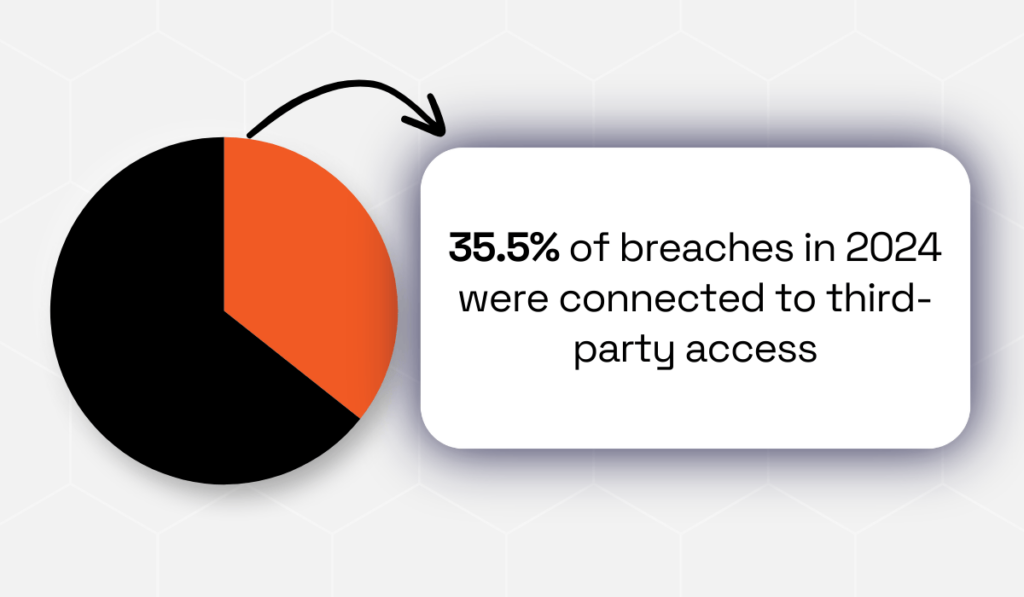
Illustration: Veridion / Data: Security Scorecard
Because the compromise was not modeled as significant, protective controls were insufficient, and attackers were able to move through internal systems and install malware across thousands of checkout terminals.
This breach exposed millions of customer records and caused substantial reputational and financial damage.
Target ignored the risk, underestimating how likely it was to happen.
So how do you estimate likelihood in a way that’s both rigorous and realistic?
An effective way is by using a blended approach:
| Historical Incident Data | Start with what’s already happened inside your organization. This is your most relevant data source. |
| Industry Data and Benchmarks | Look at what’s happening to companies like yours. Industry data fills in the gaps where your own history is thin. |
| Expert Judgment | When data is limited, bring in the people who know your operations, but anchor their estimates with evidence. |
This layered method reduces bias and addresses data gaps, producing probability estimates that are consistent and defensible.
Once scenarios and probabilities are defined, risk must be translated into financial terms.
You make decisions in economic language, so assigning dollar impact allows risk to compete with other strategic priorities.
Start with what the event will cost.
If the risk happens, what’s the total damage?
Break it into two categories: direct costs and indirect costs.
Direct costs/losses are the things you pay for right away when something goes wrong.
Asset damage repair, asset replacement, legal fees, regulatory fines, and remediation are a few examples.
Indirect costs/losses often exceed the immediate damage.
For example, industry analysis shows that $2.8 million of the average $4.88 million breach cost arises from lost business, operational disruption, and customer churn, not direct response expenses.
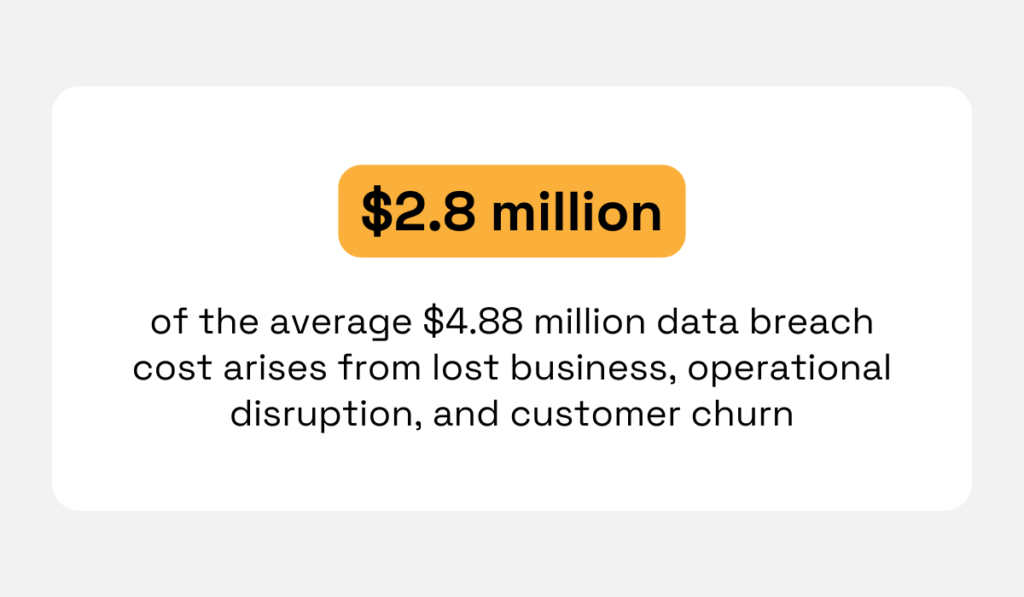
Illustration: Veridion / Data: IBM
These impacts are less visible at first, but frequently carry the greatest financial weight.
They include:
Downtime alone can be expensive.
Research from ITIC indicates that for 90% of mid-sized and large organizations, a single hour of downtime costs over $300K.
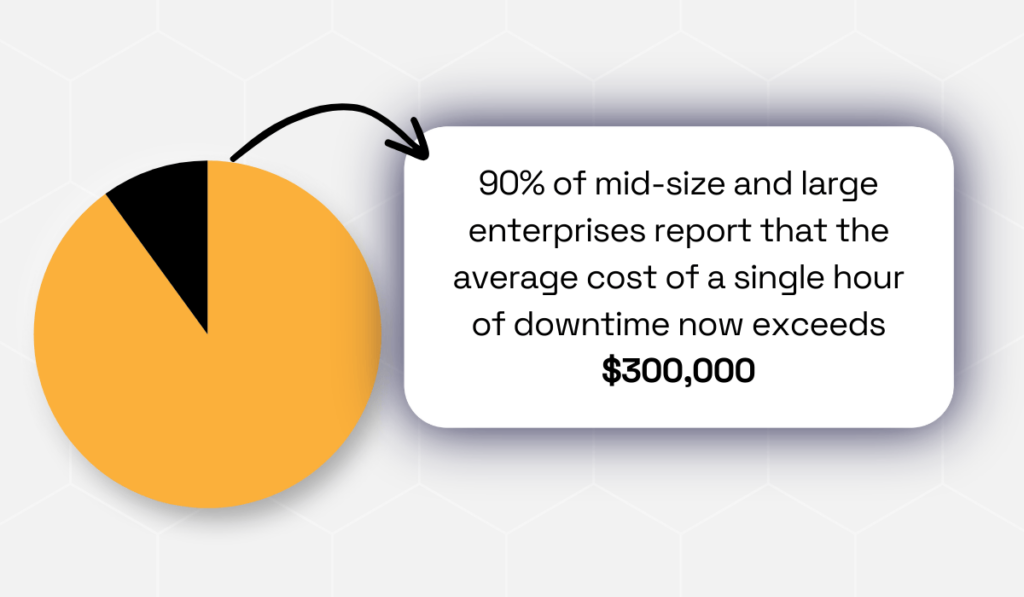
Illustration: Veridion / Data: ITIC
This is why impact modeling must extend beyond immediate remediation expenses and capture the full business disruption.
For example, a cyberattack may require $500K in direct response costs, but the longer-term impact, such as customer attrition and reduced sales, could total $5 million over the following two years.
Ignoring these indirect effects leads to a significant underestimation of true risk exposure.
If you only model the $500K, you’re underestimating the risk. Instead, calculate the expected annual loss.
That’s where it all comes together.
You take the probability of an event and multiply it by the cost if it happens. The formula is simple:
Expected Loss = (Probability of event) × (Financial Impact per occurrence)
If your factory has a 25% annual flood probability and a flood would cause $4 million in loss, the expected annual loss (ALE) equals $1 million per year.
This metric does not predict yearly outcomes. It represents long-term average exposure and allows direct comparison across risk types.
Quantification replaces subjective prioritization with measurable trade-offs.
With likelihood and impact defined, the next step is converting inputs into decision-ready metrics.
Expected Annual Loss (ALE) is the foundational measure. It indicates how much each risk costs on average per year.
Once you have that number for every scenario, you can rank them, compare them, and decide what to fix first.
The risks that feel scariest might often not be the ones that threaten organizational survival. The ones that seem manageable are sometimes the ones that will destroy you.
Without quantified metrics, you don’t know which is which.
The collapse of Lehman Brothers illustrates the danger of unquantified exposure.
For years, Lehman Brothers aggressively expanded into mortgage-backed securities while the U.S. housing market was booming.
The firm saw strong profits and assumed the risks tied to subprime mortgages were manageable.
But it never translated those exposures into clear, quantified loss metrics that reflected how much the company could lose under adverse market conditions.

Source: Investopedia
As housing defaults began rising, warning signs appeared, yet leadership continued holding an enormous mortgage portfolio that was several times larger than its equity base.
Without quantified risk metrics showing the scale of potential losses under worsening market conditions, the company underestimated how quickly declining asset values could threaten its survival.
By the time market confidence and housing values declined, the scale of potential losses had already exceeded the firm’s capacity to absorb them.
This triggered liquidity loss, investor flight, and bankruptcy in 2008.
When you don’t calculate risk exposure in measurable terms, growth can look safe even when it’s structurally unsustainable.
Quantitative risk metrics reveal whether growth strategies can remain viable under stress.
So build your quantitative risk metrics around these outputs:
| Expected Annual Loss Per Scenario | This is your baseline; it tells you the average cost of each risk over time |
| Loss Distribution Range | This shows you the spread of possible loss outcomes. A risk might have a $1 million expected loss, but a worst-case loss of $20 million. You need to know both |
| Value-at-Risk Measure | This tells you how bad things could get in the worst 5% or 1% of scenarios |
Together, these three metrics let you rank risks by the most significant financial exposure.
Upon calculating your metrics, put them in one place. Then build a risk register or dashboard with clear fields like:
This creates a unified view of enterprise risk. Once you have these numbers, you can make data-driven decisions.
Quantification only creates value when it influences action.
Your quantified risk metrics exist to help you make better decisions, which means organizations that benefit from QRA directly link risk metrics to strategic choices.
A Gartner survey confirms this, showing that the vast majority of organizations see real benefits from cyber risk quantification.
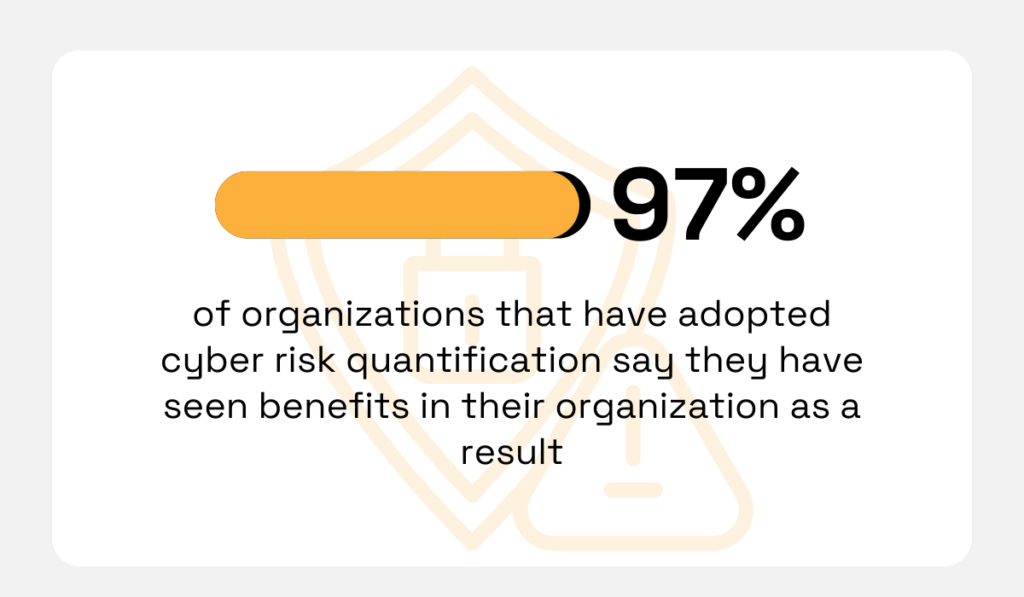
Illustration: Veridion / Data: Gartner
But the perks go beyond cyber security.
Some other common risk quantification applications include:
Generally, make risk assessments part of every strategic decision.
Many companies are using risk as a source of opportunity: 62% of organizations say they predominantly seek to uncover opportunities within risks.
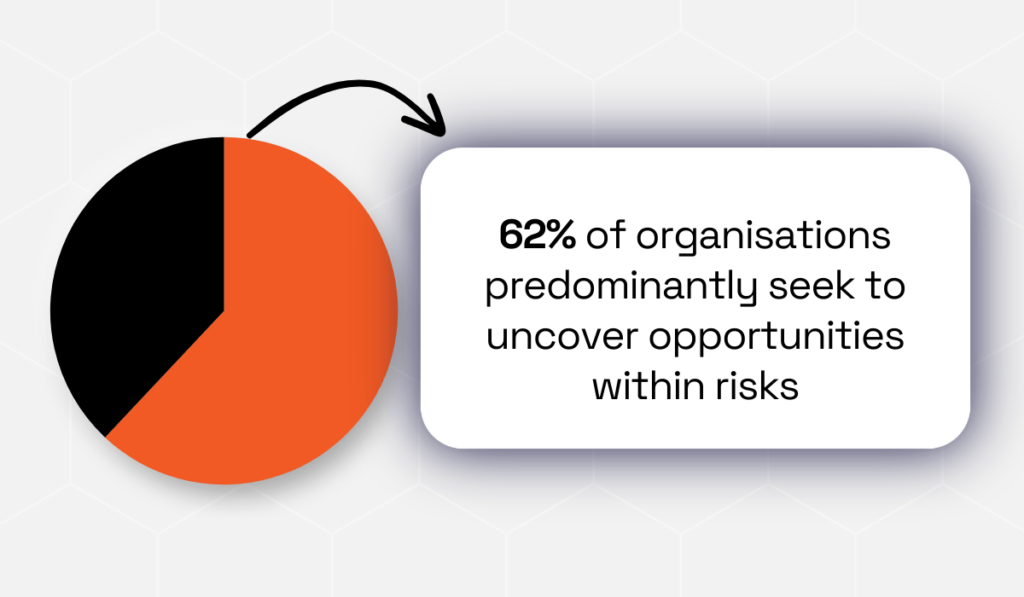
Illustration: Veridion / Data: PwC
Therefore, integrating QRA with strategy speaks the language that leadership uses.
Most importantly, risk assessments must remain current.
Businesses change: new suppliers, technologies, regulations, and geopolitical conditions influence exposure.
You need to revisit your QRA regularly so your decisions are based on current data.
Effective governance includes:
Businesses that gain sustained value from QRA treat it as an ongoing process, not a one-time project.
Your risks will evolve; ensure your assessment evolves with them.
If your organization still evaluates risk primarily in qualitative terms, you’re making high-stakes decisions with low-precision inputs.
In an environment defined by volatility, scale, and scrutiny, quantified exposure is the difference between reacting to miscalculated crises and proactive control.
With modern approaches that standardize data, model uncertainty, and connect risk directly to financial impact, QRA provides a common language for trade-offs across the enterprise.
Implement the discipline now, and risk management stops being a cost center.
It becomes a strategic advantage, one that lets you allocate capital with confidence and act before disruption becomes loss.