
Blog
How to Map Your Supply Chain
By: Auras Tanase -
19 March 2026


We love our data, and now that you're here, you're one step closer to loving it too.
A wide sample of data, so you can explore what is possible with our data
Choose ->
built with procurement in mind. Focused on manufacturers, products and more
Choose ->
built with insurance in mind. Focused on classifications, business activity tags and more
Choose ->
built with sustainability in mind. Focused on sustainability commitments, and environmental and social governance insights.
Choose ->
built with strategic insights in mind. Focused on market trends, competitor analysis, and industry-specific data
Choose ->

Keep up to date with our technology, what our clients are doing and get interesting monthly market insights.

In 2021, Ford parked thousands of half-finished vehicles at the Kentucky Speedway.
Toyota, GM, and Volkswagen shut down assembly lines across three continents.
Do you know about the missing part?
Semiconductor chips are worth a few dollars each.
The problem wasn’t their direct suppliers. Those Tier 1 companies were fine.
The disruption came from Tier 3 foundries in Taiwan that automakers didn’t even know existed in their supply chain.
By the time they traced the problem, the automotive industry had lost $210 billion in revenue.
Supply chain mapping solves this, not by achieving perfect visibility everywhere, but by showing you enough to respond when disruptions hit.
Let’s go over the key steps of mapping your supply chain.
Your first step is answering the question: What problem are you solving?
This gives more clarity during mapping and helps unlock better visibility.
Robert Handfield, Professor of Supply Chain Management at North Carolina State University, explains the core issue:
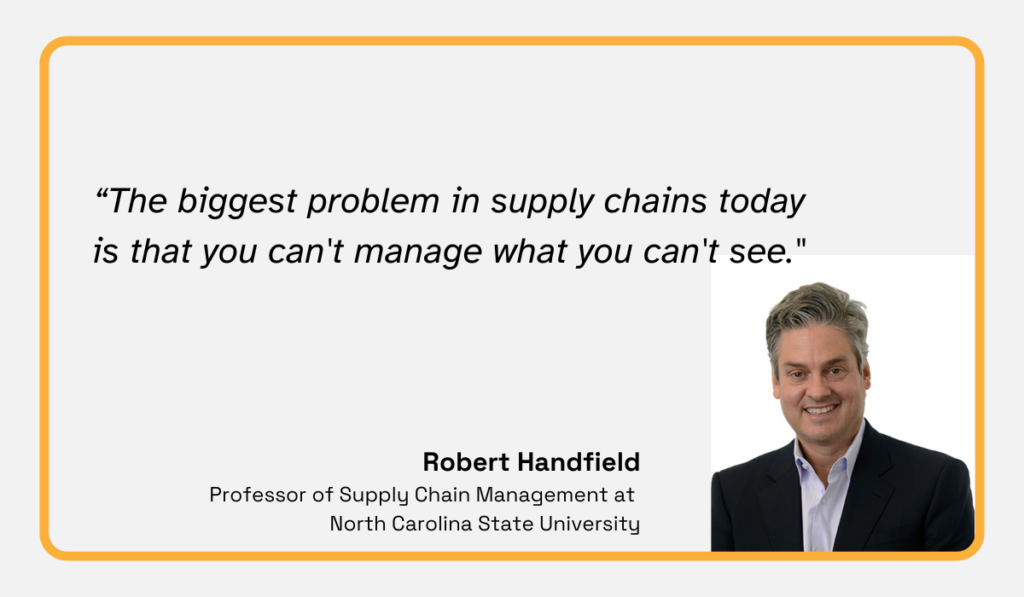
Illustration: Veridion / Quote: Poole
And here’s what happens when you can’t see problems in your supply chain.
In 2023, a BBC investigation discovered children as young as five picking jasmine in Egypt at 3 AM, earning $1 per day.
The jasmine supplied fragrances for L’Oréal and Estée Lauder, both of which had zero-tolerance child labor policies.
L’Oréal detected the issue in October 2023 because they were already mapping their jasmine supply chain down to Tier 3 farms.
They partnered with the Egyptian government and the International Labour Organization to fix it before the BBC investigation went public.
Estée Lauder scrambled when journalists called them with the evidence.
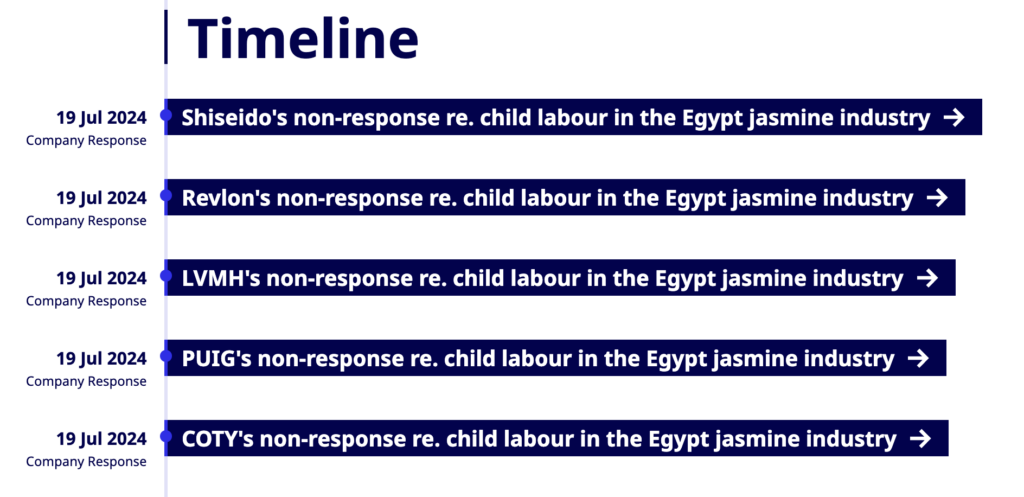
Source: Business-Humanrights
What was the difference?
L’Oréal knew why they were mapping.
They needed to verify human rights compliance throughout the entire raw material sourcing process to meet the incoming EU regulations.
That objective determined how deep they went and what data mattered.
And today, you do need to go deep.
For example, the EU’s Corporate Sustainability Due Diligence Directive requires companies to verify that no forced labor exists anywhere in their value chain by 2027.
This also includes partners beyond Tier 1, which is an issue for most companies.
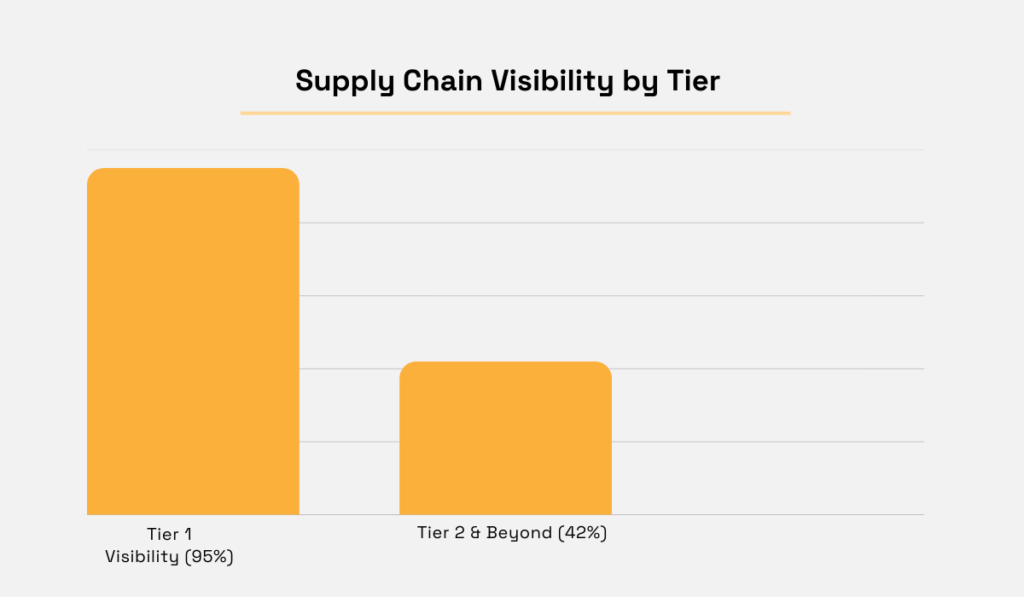
In fact, according to McKinsey’s 2025 survey, 95% of companies have Tier 1 visibility, but only 42% can see into Tier 2 or beyond.
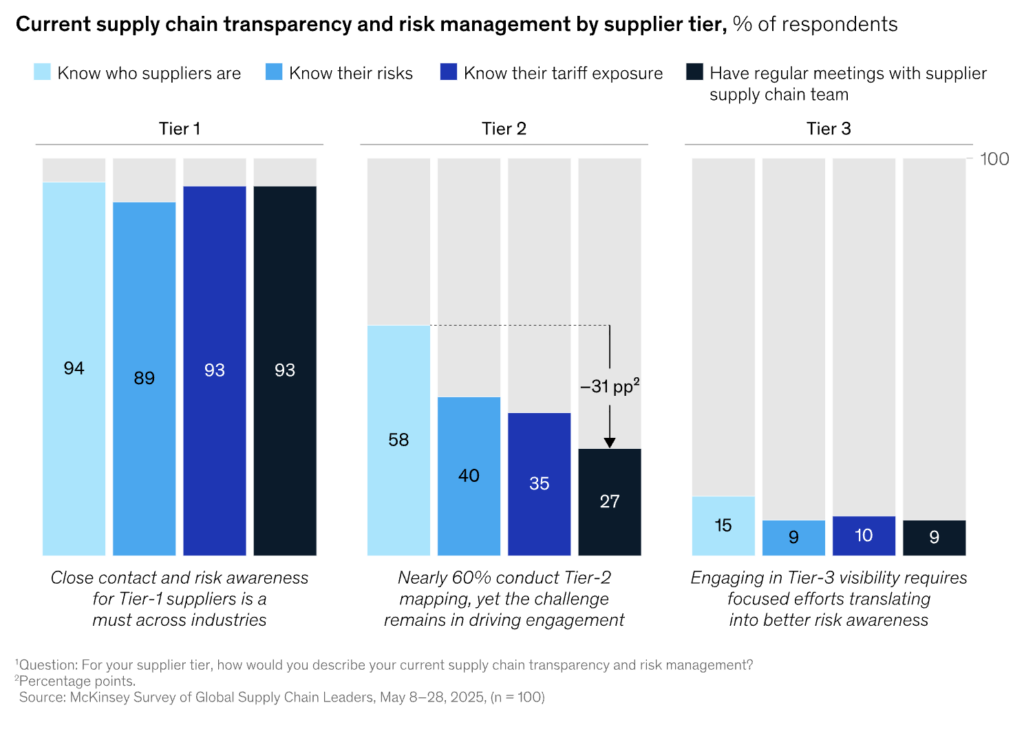
Source: McKinsey & Company
That gap exists partly because companies haven’t defined what they actually need to see.
So, write down the specific decision this map will support. A goal framed like this is too vague:
“Improve supply chain resilience.”
Instead, try something like this:
“Identify all single-source dependencies for components with lead times over 90 days.”
This tells you exactly what to map and when you’re done.
The second version gives you a concrete standard for action. It defines what needs to be mapped, how far the mapping should extend, and what completion actually looks like.
The work is done when every component with a lead time longer than 90 days has been traced to its origin and any single-source dependencies have been clearly identified.
There is a defined endpoint, not an open-ended exercise.
To create your own standard, answer two questions before you begin.
First, what specific decision must this map support? Be exact, whether it is a sourcing choice, a compliance obligation, or a risk mitigation strategy.
Second, what information would give you confidence in making that decision?
The answers determine which data truly matters and how deep into the tiers you need to go, so your effort stays focused and finite rather than becoming an endless search for more information.
Next, you’ll compile a complete list of direct suppliers using internal procurement systems, contracts, and ERP data, ensuring supplier names and legal entities are all standardized.
That way, you avoid duplication or inconsistencies, which can seriously harm your data quality.
This issue occurs more often than you might think.
For instance, McKinsey found that while 95% of organizations have visibility into their Tier 1 supplier risks, that visibility extends to Tier 2 or beyond for only 42% of them.
Source: McKinsey / Illustration: Veridion
In other words, clean records are the foundation that makes everything upstream visible.
Take, for instance, the 2021 semiconductor shortage, when many automotive companies reported having very little visibility into their Tier 3 suppliers.
Most couldn’t even name them.
When they tried tracing supply chains upstream to understand the crisis, they hit an unexpected problem: their own Tier 1 records were so messy they couldn’t trace anything backward.
The same supplier appeared six different ways in their systems. Different legal entity names. Different addresses. Some entries are outdated by years.
When you can’t identify which Tier 1 supplier actually sources from which Tier 2 manufacturer, you can’t map anything upstream.
Here’s why it matters.
That semiconductor comes from Taiwan, gets packaged in Malaysia, tested in Thailand, integrated into a circuit board in China, assembled into a module in Mexico, and finally delivered by your Tier 1 supplier in Germany.
If you have five conflicting records for that German supplier, you cannot trace the chain backward when problems hit.
Pull your ERP data right now, and you’ll probably find an issue like that. “ABC Manufacturing Ltd,” “ABC Mfg,” “ABC Manufacturing (Shanghai),” “ABC-Mfg.”
Each entry has different contact information. Some are actually different legal entities.
Some are outdated records nobody cleaned up.
This isn’t incompetence. Companies merge, subsidiaries form, facilities relocate, and different departments enter data differently.
Over time, clean lists fragment.
That’s where data standardization comes in.
At its core, standardization means assigning every supplier a single, consistent identifier across all your systems. The most reliable identifier is a business registration number. Unlike supplier names or addresses, which can change when a company rebrands or moves, a registration number is permanent and tied to a specific legal entity.
Start with deduplication. Identify where the same legal entity appears multiple times in your systems. Export your ERP supplier list and look for name variations such as “ABC Manufacturing Ltd,” “ABC Mfg,” or “ABC-Mfg.”
For each variation, confirm the official business registration number using a public registry such as Companies House in the UK or EDGAR in the United States. When multiple records share the same registration number, merge them into a single master record. Each legal entity should exist only once in your database.
Next, cleanse the data within those consolidated records. Review supplier classifications, addresses, ownership details, and the scope of supply. A company that was categorized years ago as a raw materials provider may now manufacture finished components. Compare supplier records against current contracts, purchase orders, and spend data to ensure the profile reflects today’s reality. This step turns static reference data into information you can use for risk assessment and decision making.
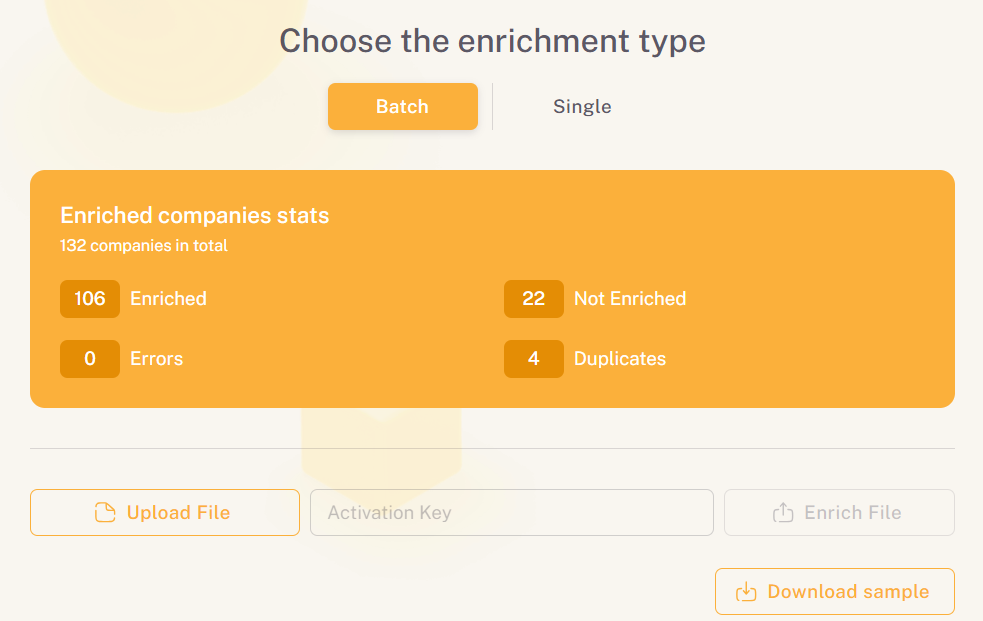
Technology can support both processes at scale. Tools such as Veridion’s Match and Enrich API can automatically match your supplier records against verified external sources, append missing identifiers, and flag inconsistencies for review.
The outcome is a reliable Tier 1 foundation you can confidently build on. If you cannot clearly identify your direct suppliers at the legal entity level, mapping the tiers beyond them becomes guesswork rather than analysis.
Remember, risk mitigation begins at Tier 1. Make sure it’s visible and fully standardized, and you’ll have less trouble mapping out N tiers.
It’s also necessary to extend visibility beyond Tier 1 to identify Tier 2 and Tier 3 suppliers that provide components, raw materials, or critical services.
You’ll likely find this step to be the most challenging, but it’s absolutely important not to skip it.
Research from Sphera confirms this, revealing that approximately 85% of major supply chain disruptions originate at Tier 2 or deeper.
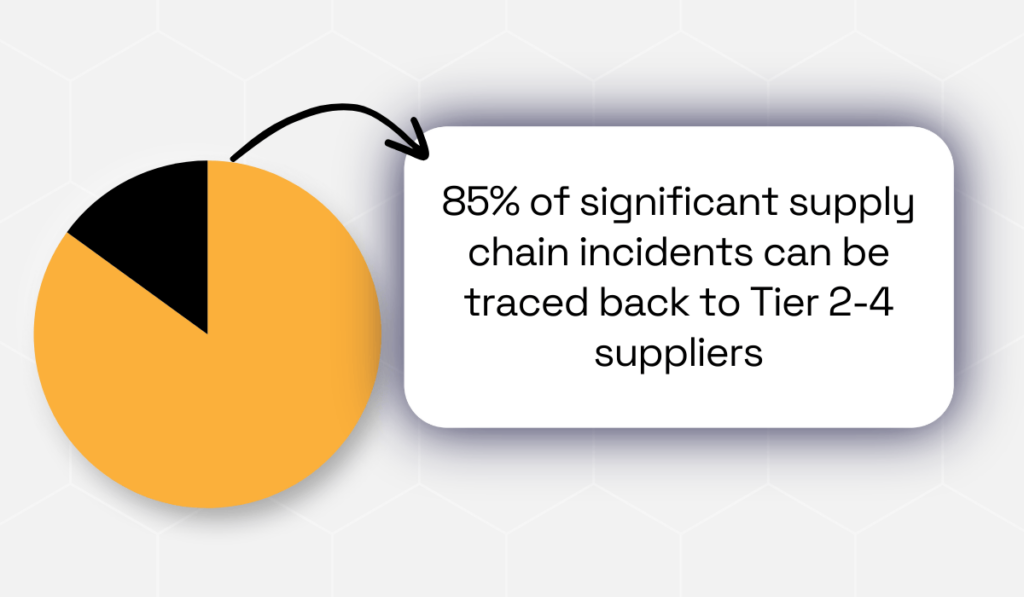
Illustration: Veridion / Data: Sphera
Not with your direct suppliers. With their suppliers, or their suppliers’ suppliers. That’s why it’s so important to pay attention to them.
But finding information about your N-Tier suppliers can be challenging.
When you ask Tier 1 suppliers for upstream information, they often refuse. They consider supplier relationships a competitive advantage and worry you’ll bypass them.
Sometimes they don’t even have the data organized to share.
In fact, according to Sphera’s survey, about 70% of organizations report that data from Tier 2 through Tier 4 suppliers is often inaccurate or unreliable when they do get it.
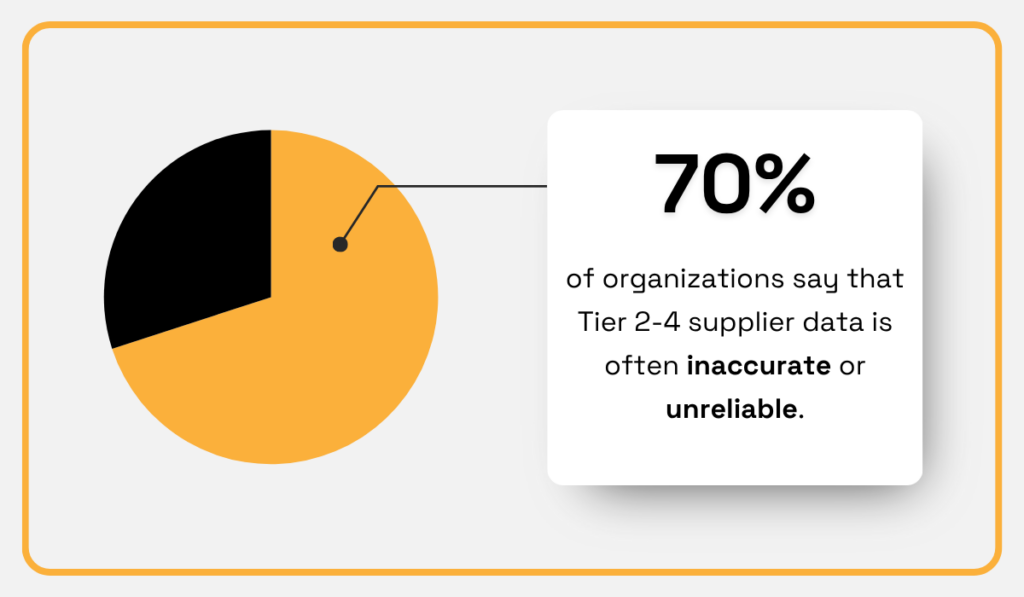
Illustration: Veridion / Data: Sphera
Think about what that means.
Seven out of ten companies say the supplier information they receive is wrong. Not incomplete but wrong.
Names don’t match business registries, locations are outdated, ownership structures are fictitious, and companies listed as manufacturers are actually just distributors.
The scale compounds the problem.
McKinsey research shows the average automotive manufacturer works with roughly 18,000 suppliers across all tiers. Aerospace and defense companies work with about 12,000.
Your 200 Tier 1 suppliers could expand to thousands when you count Tier 2, Tier 3, and beyond.
This is where external intelligence provided by AI-powered business intelligence platforms like Veridion becomes essential.
When you ask suppliers to self-report their networks, you’re hoping they’re honest, accurate, and thorough.
You need verification, and you can’t get verification by asking the same people to check themselves.
When you input a Tier 1 supplier into Veridion’s Match & Enrich API, you get back comprehensive profiles built from over 320 business attributes per company.
This isn’t self-reported data. It’s sourced from business registries, trade databases, shipping records, and verified public information.
Source: Veridion
Veridion shows you subsidiary relationships your suppliers might not mention.
If your Tier 1 supplier in Germany is owned by a holding company that also owns manufacturers in China and Mexico, you see that complete corporate structure.
You understand the real network, not the simplified version a supplier chooses to share.
The system identifies operational footprints beyond registered addresses.
A company might list its headquarters in Luxembourg for tax purposes while actually manufacturing in Vietnam and Romania.
For supply chain mapping, you need to know where goods are produced, not where corporate paperwork lives.
Learn more about Veridion’s data enrichment here:
Source: Veridion on YouTube
Critically, Veridion reveals hidden concentration risks.
You think you’re sourcing components from five different Tier 1 suppliers. Veridion shows you that four of them all purchase from the same Tier 2 manufacturer.
That single upstream bottleneck wouldn’t appear in self-reported data because no individual Tier 1 supplier sees the full picture.
The database covers more than 134 million companies globally, updated weekly.
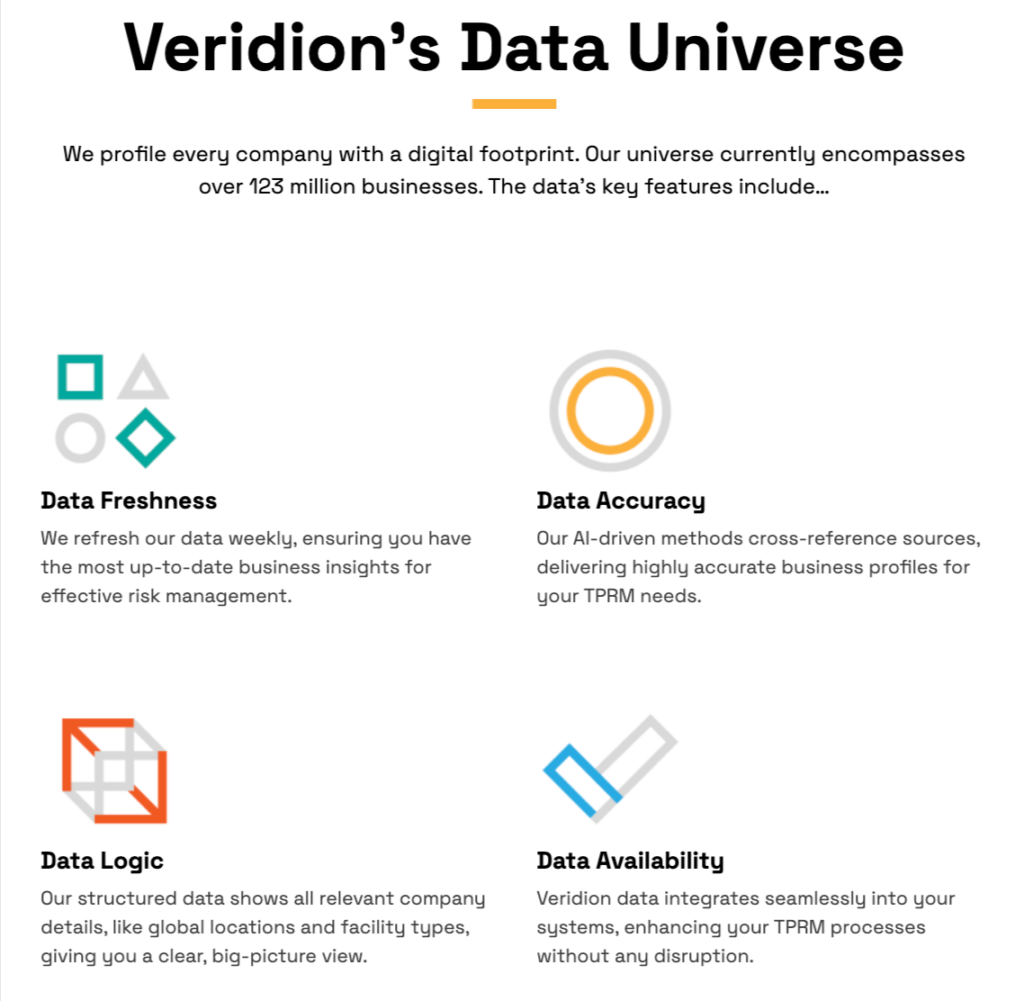
Source: Veridion
Ownership might change, facilities relocate, companies merge or split.
But our map stays current because Veridion tracks these changes through verified sources, not occasional supplier questionnaires.
All in all, by combining your internal procurement data with Veridion’s external intelligence, you build multi-tier visibility based on verified facts, not hopeful assumptions.
You’re not waiting for suppliers to volunteer information. You’re discovering the actual network as it exists.
Then, it’s time to document how materials, components, and finished goods move through your supply chain, identifying key production stages, handoff points, transportation routes, and more.
One famous incident clearly demonstrates why this step matters.
In March 2021, a cargo ship blocked the Suez Canal for six days. That single accident stopped $9.6 billion worth of shipments daily.
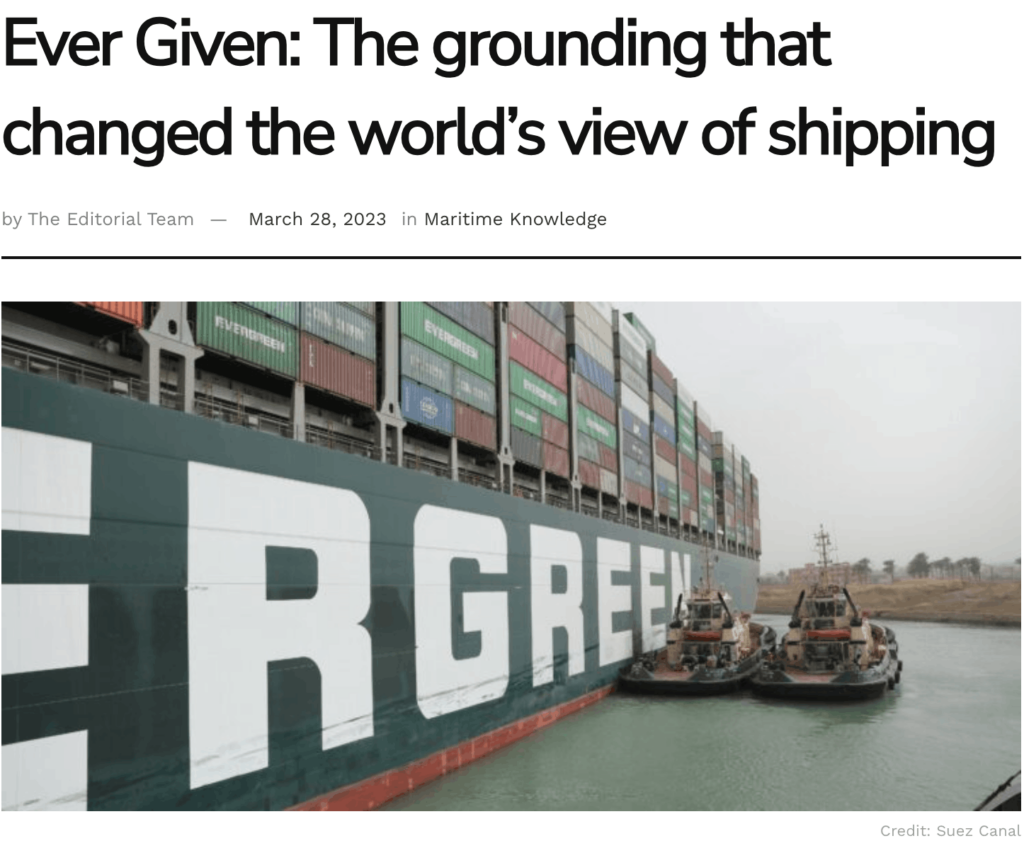
Source: SAFETY4SEA
Companies that hadn’t even thought about it in advance discovered they were critically dependent on a waterway they’d never considered a risk point.
In other words, knowing your suppliers isn’t enough. You need to understand how materials actually move.
Lead times compound through tiers in ways that aren’t obvious until you map them.
Add 15 days of international shipping at each stage, and you’re looking at 120+ days from raw material to finished component, before your own production time.
A single delay at Tier 3 cascades forward four months.
Volume flows reveal hidden concentration.
You source a component from six different Tier 1 suppliers. That looks like solid diversification.
But when you map actual flows, you discover that 60% of your volume comes through suppliers who all source from the same Tier 2 manufacturer. You don’t have the redundancy you thought you had.
The 2024 Red Sea disruptions proved this. Houthi attacks forced vessels to reroute around Africa, increasing transit times by 20-30% overnight. Companies with mapped flows could model alternatives immediately.
They knew which suppliers depended on Red Sea routes. They could prioritize shipments, find air freight alternatives for critical items, and communicate realistic timelines to customers.
Companies without mapped flows spent weeks figuring out which suppliers were affected.
So, be sure to document production stages and handoff points.
Where do materials change hands? Which stages must happen in sequence?
Map transportation routes and logistics infrastructure.
Which ports, shipping lanes, and trucking routes do your goods flow through?
Every chokepoint is a potential failure point.
Measure lead times at each stage, including manufacturing and all transportation. Add them up.
Most companies dramatically underestimate total supply chain lead time.
Next up, it’s important to assess risks at each stage of the supply chain.
Not just monitor, but to actually analyze.
The point here isn’t listing every possible risk. It’s identifying which ones could actually hurt your business.
During the 2021 Texas winter storm, ice shut down semiconductor plants run by Samsung, Infineon Tech, and NXP.
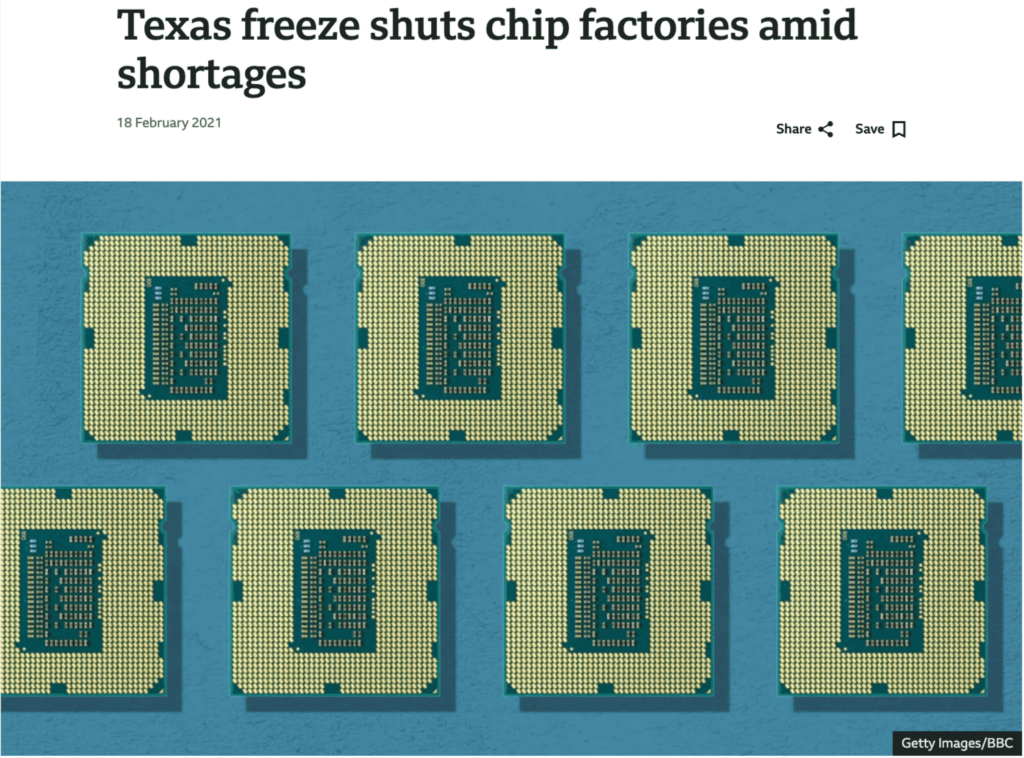
Source: BBC
The resulting shortages cascaded through automotive supply chains globally.
Automakers lost production not because they knowingly concentrated suppliers in Texas, but because they didn’t know their Tier 2 and Tier 3 suppliers were concentrated there until plants went offline.
The issue isn’t just concentration. It’s an invisible concentration of critical components with long lead times.
The Jasmine case we’ve mentioned earlier proves why compliance visibility matters.
Both L’Oréal and Estée Lauder had zero-tolerance child labor policies. Their Tier 1 fragrance suppliers also had such policies. The child labor happened at Tier 3 farms nobody knew existed.
Investigations revealed that audit systems only checked factories, not the smallholder farms actually picking jasmine. The audits gave passing grades while missing the problem entirely.
Map each tier’s risks:
Then assess which risks sit in your critical path.
A risk affecting commodity suppliers that you can quickly replace is manageable.
The same risk affecting a specialized supplier with an 18-month replacement lead time requires immediate mitigation.
Lastly, it’s time to validate the supply chain map through supplier engagement, data cross-checks, and ongoing monitoring.
This means confirming critical relationships, facilities, and flows with suppliers where possible.
Why does this matter?
In September 2021, GM CEO Mary Barra announced the company would fundamentally rethink its approach. Instead of sourcing semiconductors through Tier 1 suppliers, GM would establish direct relationships with chip manufacturers.
Barra said in an online interview:
“We’re going to make some pretty substantial shifts in our supply chain. We’re already working much deeper into the tiered supply base because generally General Motors doesn’t buy chips [directly] but [our suppliers do]. But now we’re building direct relationships with the manufacturers.”
Why?
When the shortage hit, they discovered they didn’t actually know which foundries made which chips for which suppliers. Their supply chain map was outdated and incomplete.
Supply chains don’t hold still.
Companies merge, facilities close, and suppliers add or lose capabilities. A map that’s accurate today can be dangerously wrong in six months.
So, always send your Tier 1 suppliers the mapped view of their role.
Ask them to verify or correct it. This catches errors and signals you’re paying attention. When suppliers know you’re seriously tracking supply chain structure, information quality improves.
For high-risk suppliers, conduct site visits or third-party audits.
Actually seeing a facility reveals capabilities that paperwork misses.
But the fragrance industry’s audit failure shows the limitation: visiting Tier 1 factories means nothing if actual risk sits at Tier 3 farms, also known as the “visibility cliff.”
Focus resource-intensive efforts on suppliers that matter most.
Cross-reference multiple information sources.
Your procurement records show one thing. Business registries show another. Trade databases reveal actual shipment patterns. When these sources align, confidence increases.
When they diverge, investigate why.
Set up monitoring for changes that matter:
Modern systems can monitor news feeds, track corporate filings, analyze shipping patterns, and flag anomalies at scale.
Build validation into regular operations rather than treating it as a separate project.
When procurement negotiates contracts, verify supplier information. When quality issues arise, confirm your mapped understanding matches reality.
A perfectly detailed map from six months ago might be more dangerous than a simpler map updated continuously.
The outdated map creates false confidence.
The question is never whether supply chains will break. It’s whether you’ll know what broke, where it matters, and what to do next.
Most supply chain failures aren’t sudden. They’re the result of risks that were always there, just never visible until something broke.
Mapping doesn’t eliminate that risk. What it does is shrink the gap between a disruption happening and you knowing what to do about it.
The companies that navigate disruptions best aren’t the ones with the most sophisticated supply chains. They’re the ones who simply know what their supply chain looks like. That knowledge is available to any organization willing to build it, and now you know how.