
Blog
Assessing Operational Disruption Risk for a Raw Material Processor
By: Stefan Gergely -
21 March 2026


We love our data, and now that you're here, you're one step closer to loving it too.
A wide sample of data, so you can explore what is possible with our data
Choose ->
built with procurement in mind. Focused on manufacturers, products and more
Choose ->
built with insurance in mind. Focused on classifications, business activity tags and more
Choose ->
built with sustainability in mind. Focused on sustainability commitments, and environmental and social governance insights.
Choose ->
built with strategic insights in mind. Focused on market trends, competitor analysis, and industry-specific data
Choose ->

Keep up to date with our technology, what our clients are doing and get interesting monthly market insights.

Key Takeaways:
What happens to your production plan when one raw material processor shuts down for two weeks?
For procurement teams, processors are often the hidden choke point between upstream supply and downstream customers, where a single disruption can ripple across multiple categories and business units.
In this guide, we break down a step-by-step process to assess operational disruption risk so you can spot concentration issues early, prioritize the right suppliers, and build practical contingencies before the next shock hits.
Start by mapping the full supply chain end to end, from upstream raw material sources through processing facilities to downstream customers.
Include:
Supply chain mapping helps you spot risks that are easy to miss when you look only at direct suppliers.
It surfaces single points of failure, supplier concentration, and hidden dependencies, such as one facility producing a critical grade, one corridor feeding multiple sites, or one upstream input that cannot be swapped without long requalification.
McKinsey reports why this is so important.
As it turns out, 95% of organisations can see risks in direct suppliers, but only 42% can see risks in suppliers’ suppliers.
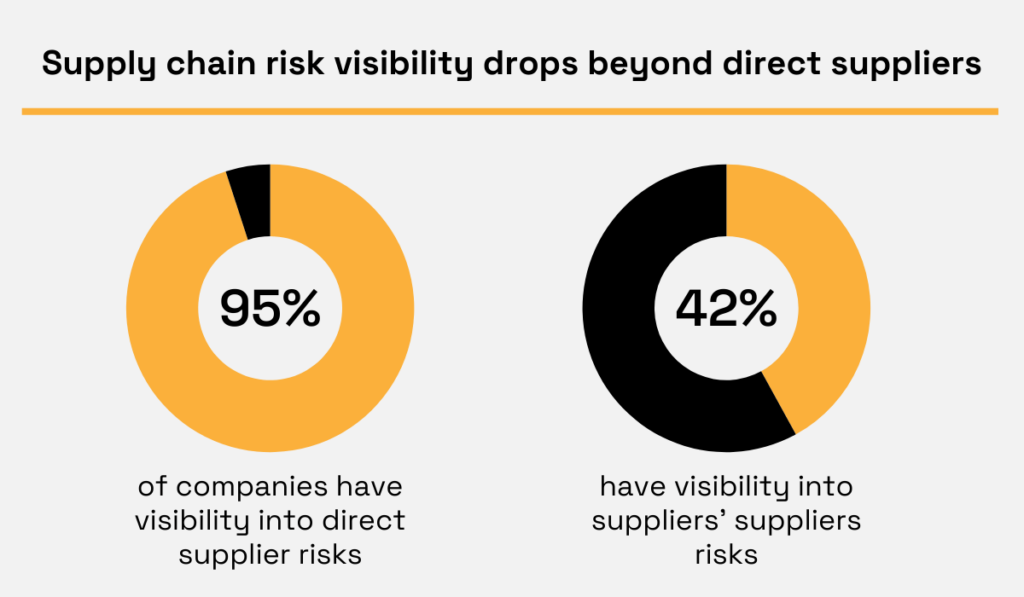
Illustration: Veridion / Data: McKinsey
That is why end-to-end mapping comes first.
So, use this quick four-step map to capture upstream inputs, processing sites, logistics choke points, and downstream exposure in one view before you assess risk.
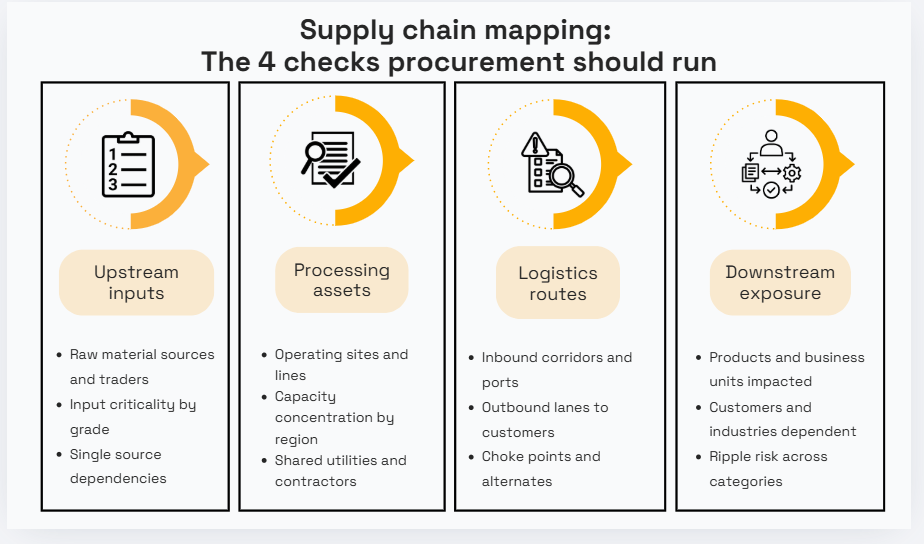
Source: Veridion
Use the same map to pinpoint where the raw material processor sits in the broader chain and which downstream products or industries depend on it.
This is where you separate “important supplier” from “systemic choke point.”
Processors that sit upstream and supply multiple critical customers often create outsized disruption risk because a single operational outage can ripple across several categories and business units.
In the end, once you have the map, you can shift from “who we buy from” to “where disruption would actually hit.”
This leads directly into evaluating the geographic exposure of the processor’s facilities.
Next, evaluate the locations of the processor’s facilities and the risks they face.
You are not only checking the country on the supplier record here, but also real operating sites against natural hazards, climate risks, political instability, and regional regulatory environments.
Geographic exposure often determines both how often disruptions happen and how severe they are when they do.
So, start with a complete list of processing assets and supporting sites, then review concentration.
If most capacity sits in a single country or region, one event can disrupt multiple lines at the same time.
That is why location concentration is a risk signal on its own.
A real example is Hurricane Helene flooding in North Carolina’s Spruce Pine, which Supply Chain Digital reports is responsible for up to 90% of the world’s ultra-pure quartz.

Illustration: Veridion / Data: SupplyChain Digital
When a critical input is tied to one location, a local disruption can create global knock-on effects.
Then go beyond country-level risk.
Therefore, check proximity to flood zones, cyclone paths, wildfire regions, seismic activity, drought and water stress, and dense industrial hubs where correlated outages are more likely.
These local factors matter because weather and secondary perils are driving a large share of losses.
Munich Re estimates global natural disaster losses of US$320 billion in 2024, with weather catastrophes responsible for 93% of overall losses.
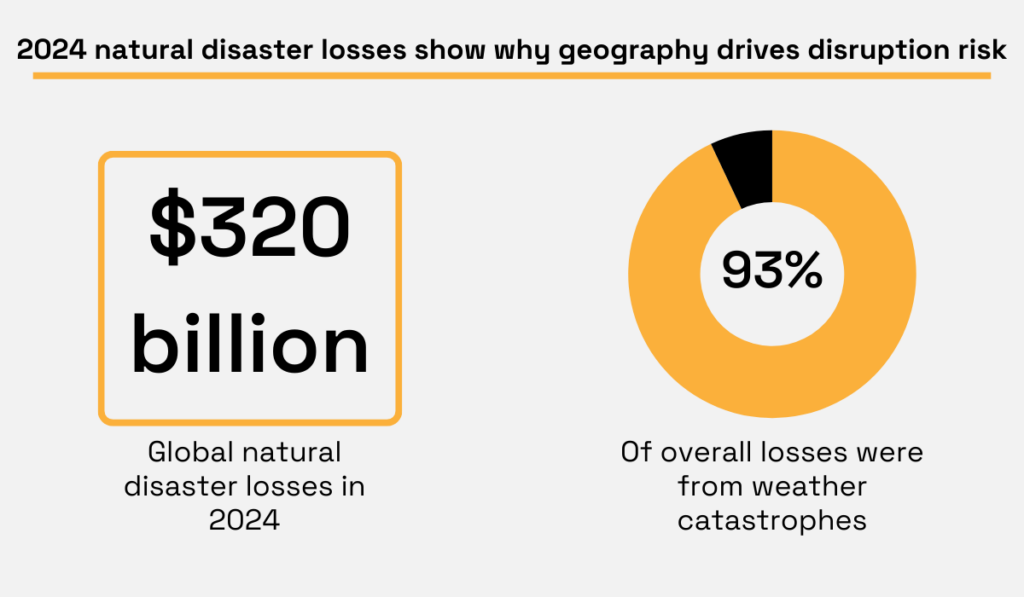
Illustration: Veridion / Data: Munich Re
That gives you a clear signal that disruption risk is not rare and not evenly distributed by geography.
Finally, include political and regulatory exposure in the same geographic lens.
Export controls, tariffs, investment restrictions, and industrial policy can reshape what can be produced or shipped out of a region, even when the facility is physically fine.
Now, you’re probably thinking: That’s a lot of data to gather and analyze.
Luckily, platforms like Veridion support this step by enriching supplier data with verified operational locations, ownership structures, and real-world business activity signals.
This helps you identify where processing actually occurs, uncover co-located assets, and detect concentration risk across multiple tiers.
Veridion’s data covers more than 100 million companies all over the world and is updated every week.
This means you stay in the know no matter what, able to proactively identify risks and make decisions with confidence.
All in all, once you know where the processor operates and what those locations are exposed to, the next question is simple:
Can the surrounding infrastructure keep the facility running day after day?
That is why the next step is to analyse dependency on electricity, water, gas, and transport networks.
Raw material processors depend on infrastructure that you do not control, but that can stop output instantly.
Electricity, water, gas, and transportation networks are often taken for granted.
But if any one of them fails, the processor can lose production even when the facility itself is physically undamaged.
So start by listing the processor’s critical utility and logistics dependencies by site.
Then pressure test each one for stability and redundancy.
For electricity, confirm whether the site has:
Energy-intensive operations are especially exposed because some processes cannot simply pause and resume without loss.
A real example is Alcoa’s San Ciprián complex in Spain, which was impacted by a widespread power outage.
The outage affected both the refinery and smelter and significantly impacted the ability to reach a timely and full restart of the smelter.

Source: Discovery Alert
Then, do the same for water and gas.
Water interruptions can reduce productivity or force temporary closure, especially for processors that use water for cooling, washing, separation, or emissions control.
For gas, assess pipeline dependence, single entry points, and whether the site can switch fuels or run reduced loads.
Then evaluate transportation networks as an infrastructure dependency, not a logistics detail.
Ask where inbound raw inputs come through, which ports, rail corridors, or highways matter most, and whether alternate routes exist with realistic lead times.
A processor may have inventory onsite, but if outbound lanes fail, storage fills up, and production still stops.
Here’s a summary of all the risk signals to check:
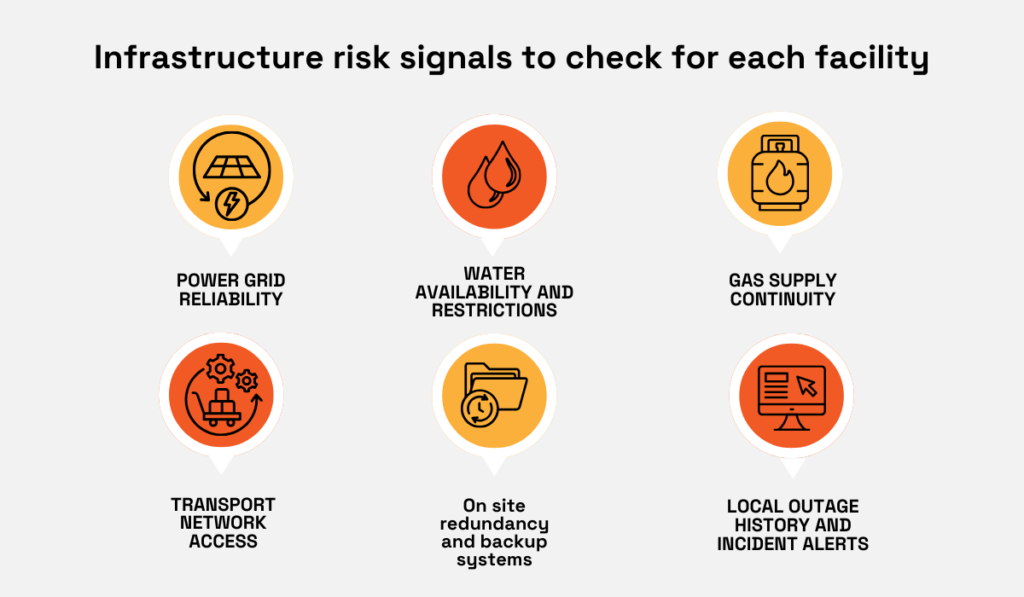
Source: Veridion
Overall, this risk is more acute in regions with aging infrastructure or rapid industrial growth, where grids and utilities struggle to keep pace.
The OECD warns that delays in grid development increase the risk of economically damaging outages multiplying, noting that outages already cost around USD 100 billion a year globally.
Once you understand which utilities and routes can shut the site down, the next step is to check upstream fragility.
That starts with how dependent the processor is on a limited set of suppliers for its raw inputs.
Make a tally of the suppliers of each key input (raw materials, additives, consumables, etc.) and plot them on a map of the processor’s upstream inputs.
Then quantify dependency by share of volume and by whether any single upstream supplier can stop production.
Single-source or highly concentrated sourcing turns upstream disruption into a direct operational stop because it creates a single point of failure.
Stephen V. Chavez, Senior Technical Product Marketing Manager at Siemens, warns:

Source: Siemens
Asking what needs to be changed in order to go to a different source (e.g., specifications, quality checks, and customer approvals) is the next step in determining if switching is possible.
The qualification often requires site checks and audits of capacity, equipment uptime, and process controls, which makes switching a managed process, not a quick swap.
Capture qualification timelines directly from the processor for each critical input, including the steps, owners, and typical approval gates.
Teams should scale the depth of due diligence for volatile categories, sole-sourced components, and long-lead materials, which is where timelines tend to matter most.
Supplier dependency often determines how quickly operations can resume because redundancy decides whether the processor can keep running while one source is down.
If switching requires requalification and lead times are long, the processor’s recovery time becomes the same as your disruption exposure.
Evaluate inventory strategies by input and by site, not as a single days-of-stock average.
For disruption risk, the only number that matters is the cover time for the few inputs that can stop the plant.
Processors running lean or just in time can be efficient in stable conditions, but they can also have no shock absorbers when the supply is interrupted.
That is why you should calculate the time to survive for each critical input, meaning how long the processor can keep meeting demand if a specific node goes down.
Then, you compare this metric to the time to recover, i.e., how long it will realistically take to restore supply at full volume.
A strong way to position this for executives is inventory positioning and trade-offs, not inventory inflation.
Annette Clayton, CEO of Schneider Electric North America, explains that this is exactly what they did:
“We have used TTR and TTS to determine places where we need to develop and duplicate supplier capability, from raw materials to assembled parts. We increased inventories where our time-to-recover because of extended logistics times exceeded our time-to-survive.”
You need to stress test buffer policies against real disruption durations and restart windows, not only average lead times.
McKinsey Global Institute found that disruptions lasting a month or longer occur every 3.7 years on average, which is a signal that many critical materials need weeks of protection, not days.
Cover time versus recovery time tells you whether buffers are sufficient or if a disruption will turn into missed deliveries.
Next, assess financial resilience so you know whether the processor can fund recovery, replacement inputs, and labour retention during downtime.
Now let’s assess the processor’s financial health, insurance coverage, and access to liquidity because this is what determines whether a disruption becomes a short outage or a long, destabilizing recovery.
When a plant goes down, the processor still pays fixed costs like:
So weak liquidity can quickly turn downtime into permanent capacity loss.
Start with basic financial resilience signals you can validate, like cash and committed credit headroom, near-term debt maturities, recent margin pressure, and more.
If you cannot access audited financials, you can still request proof points that are relevant for continuity, such as lender support letters, insurance certificates, and documented recovery funding plans.
Then audit insurance in operational terms, not policy names.
Separate property damage cover from business interruption cover, confirm the waiting period and indemnity period, and ask whether the processor has coverage for dependent suppliers and utilities.
Rob Cusack, Global Claim Preparation, Advocacy and Valuation Leader at Aon, explains why being so careful matters:
Source: Aon
Underinsurance or tight liquidity slows the restart because the processor must pay for repairs, expedited logistics, replacement inputs, and labour retention before normal cash flow returns.
To consider business interruption exposure alongside operational risk, translate each disruption scenario you have already mapped into two numbers: expected downtime and financial impact.
Estimate the value at risk from lost output and additional costs, then compare it to the processor’s liquidity, policy limits, and time deductibles.
This will indicate whether the supplier can finance recovery without compromising on repairs, alternative sourcing, or workforce retention.
Next, you can validate this assessment by looking at the processor’s track record, including how it handled past outages and how quickly it returned to stable production.
Procurement teams should take historical disruptions seriously because they show you how the processor behaves under real stress.
You are looking for operational resilience, recovery time, and whether management communicates early and acts decisively.
So, build a disruption timeline for the last 3 to 5 years across each processing site and the critical routes that feed it.
Capture:
using the same time-to-recover lens you will later use for scenarios.
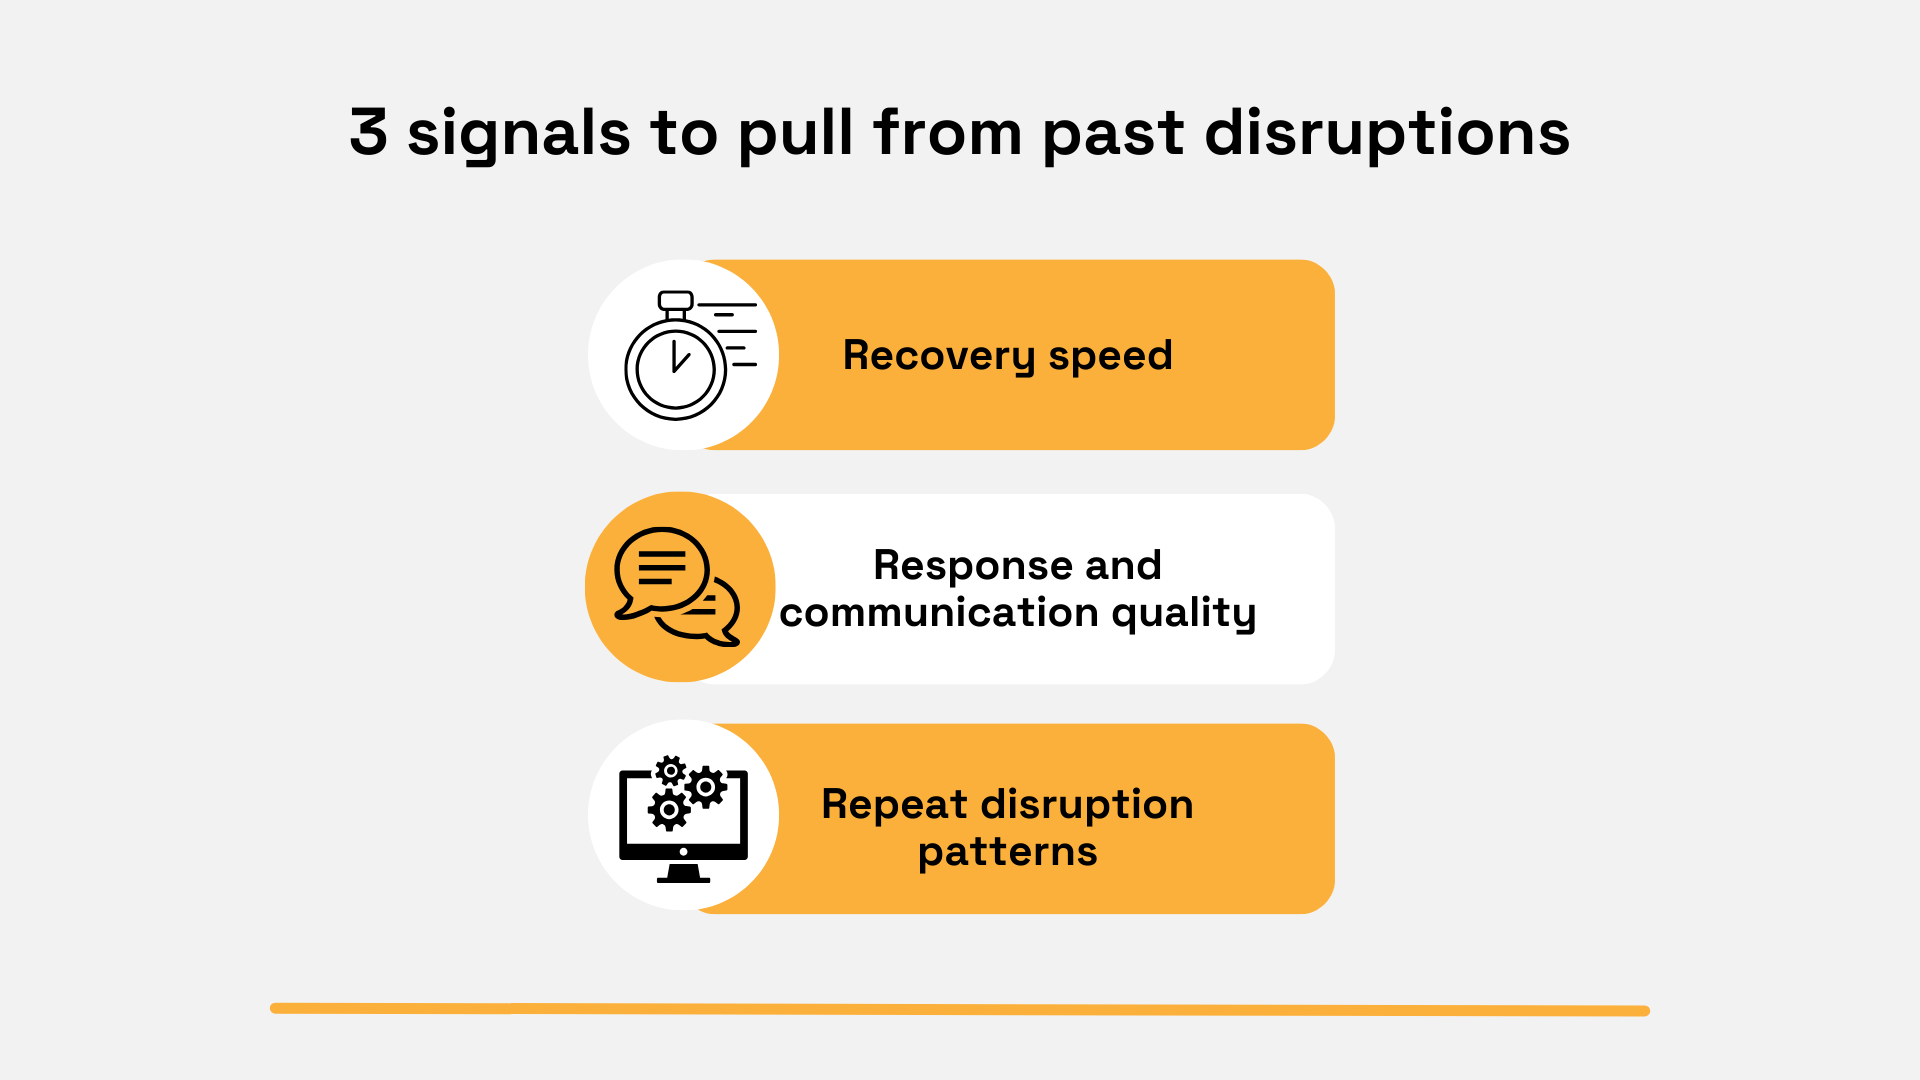
Then translate that timeline into a small set of leading risk indicators you can monitor going forward.
Look for patterns of repeated disruptions, not one-off incidents.
Recurrence often signals systemic weakness such as fragile utilities, chronic maintenance gaps, recurring quality excursions, or exposure to the same transport choke points.
Use objective performance evidence to strengthen your risk view.
Research on supplier disruptions shows that poorer supplier performance is associated with more frequent and longer disruptions; therefore, past disruption intensity is a credible predictor of future pain.
Source: Veridion
If you want a structured way to operationalize the data you collect, Veridion’s guide on supplier performance metrics is a useful reference for what to track consistently.
Once you have the history and indicators, you are ready to model high-impact scenarios and quantify downstream exposure.
Finally, run scenario analysis to understand how different disruption events would impact operations at the processor site you rely on.
MIT professor David Simchi-Levi explains why:

Illustration: Veridion / Quote: MIT
The goal is to move from general risk awareness to clear priorities, with numbers you can defend in front of operations, finance, and leadership.
Start by modeling a small set of high-likelihood, high-consequence scenarios that match how processors actually fail.
Four scenarios usually cover most exposure:
For each scenario, quantify three outcomes so the analysis stays decision-ready.
First, estimate potential downtime by using the time to recover, i.e., how long the disrupted node needs to return to full output.
Then, compare it with your time to survive, meaning how long demand can be met using buffers and alternate paths, as outlined in MIT’s supply chain stress test approach.
Second, translate downtime into financial loss using your exposure assumptions.
Third, document downstream customer impact by listing which SKUs, plants, or business units lose supply first and what contractual or service penalties could follow.
Use these results to drive contingency planning and prioritization.
When the time to recover exceeds the time to survive, you either:
Then fund the actions with the highest exposure first.
Use a consistent likelihood and impact scoring method so scenarios are comparable and decisions are defensible.
This procurement risk assessment framework gives you a clean structure for prioritising actions across suppliers.
Operational disruption risk is rarely a surprise.
It is usually visible if you map the chain, validate where processing happens, test infrastructure and upstream dependency, check buffers and financial resilience, and learn from past disruptions.
When you run scenario analysis, you turn those signals into clear priorities and funded mitigation plans.
Use this process to focus attention on the few processor sites that can truly stop your business.
The reward is simple: fewer last-minute escalations, faster recovery when disruption hits, and more confidence in every sourcing decision you make.