
Blog
6 Steps of the Data Enrichment Process
By: Auras Tanase -
20 April 2026


We love our data, and now that you're here, you're one step closer to loving it too.
A wide sample of data, so you can explore what is possible with our data
Choose ->
built with procurement in mind. Focused on manufacturers, products and more
Choose ->
built with insurance in mind. Focused on classifications, business activity tags and more
Choose ->
built with sustainability in mind. Focused on sustainability commitments, and environmental and social governance insights.
Choose ->
built with strategic insights in mind. Focused on market trends, competitor analysis, and industry-specific data
Choose ->

Keep up to date with our technology, what our clients are doing and get interesting monthly market insights.

Key Takeaways
Businesses today generate massive volumes of data, but most of it remains incomplete, inconsistent, or outdated.
In other words, simply adding more data is no longer enough.
Data enrichment is the solution, but only when approached methodically.
In today’s guide, we break down the six steps of the data enrichment process, showing how to transform your datasets into a reliable, actionable strategic asset.
Before enriching your datasets, you need a clear understanding of what you’re starting with.
Skipping this step is a common and costly mistake.
Adding new information to inaccurate or duplicated records can compound existing problems rather than solve them.
And the financial impact of poor data quality is significant.
According to a 2023 Forrester survey, more than 25% of global data and analytics professionals estimate they lose over $5 million annually due to poor data quality, with 7% reporting losses exceeding $25 million annually.
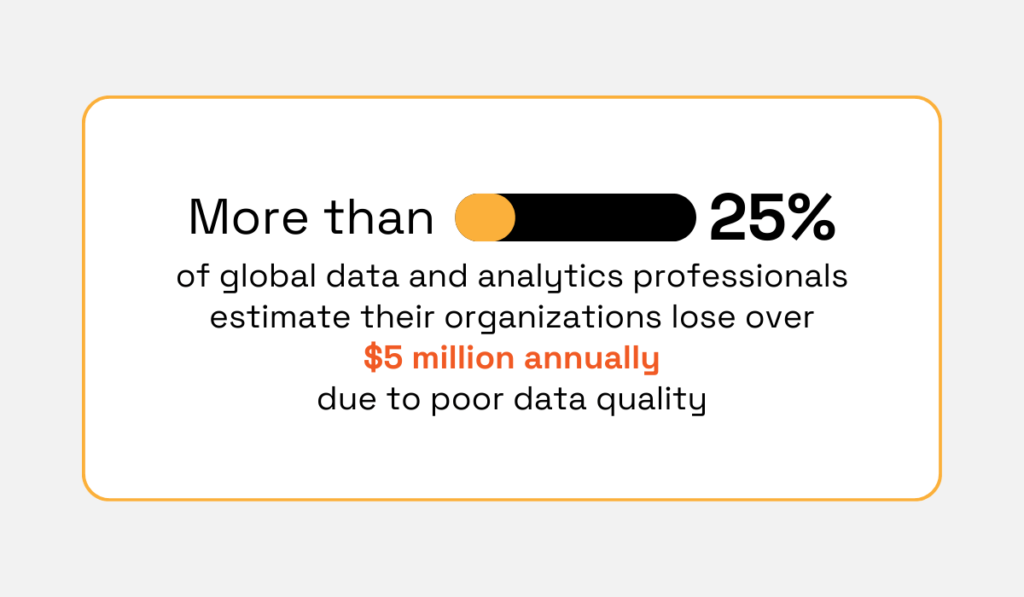
Illustration: Veridion / Data: Forrester
These losses often stem from flawed analytics, operational inefficiencies, and decisions made using unreliable data.
The risks of poor data quality are not theoretical.
Companies like Unity Technologies have already experienced their real-world impact:
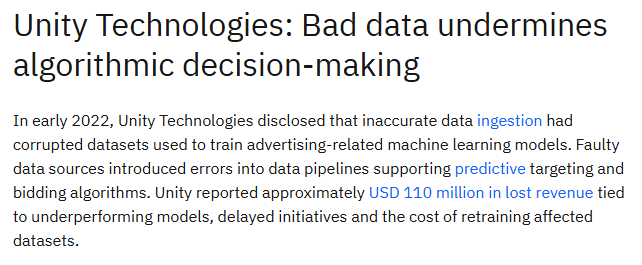
Source: IBM
A structured data assessment provides a realistic picture of the health of a dataset.
In many organizations, audits reveal the same recurring issues as datasets grow across systems and sources.
Most data quality problems fall into several predictable categories:
| Data Quality Issue | Description | Example | Impact |
|---|---|---|---|
| Incomplete Records | Missing fields reduce the usefulness of records for analysis or targeting. | A contact record without a job title, a supplier entry missing an industry classification, or a company profile with no employee count. | Limits segmentation, weakens analytics, and prevents teams from building accurate profiles. |
| Duplicate Entries | The same entity appears multiple times in a dataset. | “XYZ Corp,” “XYZ Corporation,” and “XYZ Corp Ltd.” appearing as separate records. | Inflates record counts, distorts reporting, and may trigger repeated outreach to the same contact. |
| Outdated Information | Data becomes inaccurate over time as organizations evolve and people change roles. | A contact who changed companies or a company that has rebranded or relocated. | Leads to failed outreach, incorrect analytics, and poor decision-making. |
| Formatting Inconsistencies | Data fields use different formats or conventions across records or systems. | Phone numbers stored in different formats, countries listed as “United States,” “USA,” and “US,” etc. | Breaks joins, aggregations, and automated processes that rely on consistent formatting. |
| Structural and Schema Mismatches | Data imported from different sources uses inconsistent field names or structures. | One dataset uses “industry,” while another uses “sector” or “vertical,” with different classification values. | Prevents seamless integration across systems and makes building unified datasets difficult. |
Once these issues are identified, teams can begin measuring the overall quality of their data.
Start by evaluating data completeness or the extent to which required fields contain usable values.
Calculate the fill rate for each field by determining the percentage of records with populated, non-null values.
This provides a field-level view of where information gaps are largest.
Focus particularly on attributes that are critical to your use case, such as:
Next, identify duplicate records.
Organizations typically use fuzzy matching algorithms that account for abbreviations, misspellings, and formatting variations.
These tools cluster likely duplicates for review and often rely on normalized identifiers, such as company name combined with domain or location, to flag records representing the same entity.
Finally, assess data accuracy.
Because accuracy cannot always be verified internally, teams typically validate records against trusted external sources such as firmographic data providers, official business registries, or enrichment APIs.
In addition to completeness, duplication, and accuracy, it is useful to evaluate consistency (whether the same concepts use standardized values) and timeliness (when records were last verified or updated).
Together, these dimensions provide a comprehensive quality baseline before the enrichment process begins.
Data enrichment without direction is just data accumulation.
Launching enrichment initiatives without first anchoring them to specific business objectives leads to richer datasets that don’t answer the questions that matter, because those questions were never defined upfront.
This misalignment is quite common.
According to the 2026 LeBow Report, while over 70% of organizations believe their data initiatives are well aligned with business goals, only 31% have meaningful KPIs tied to those goals.
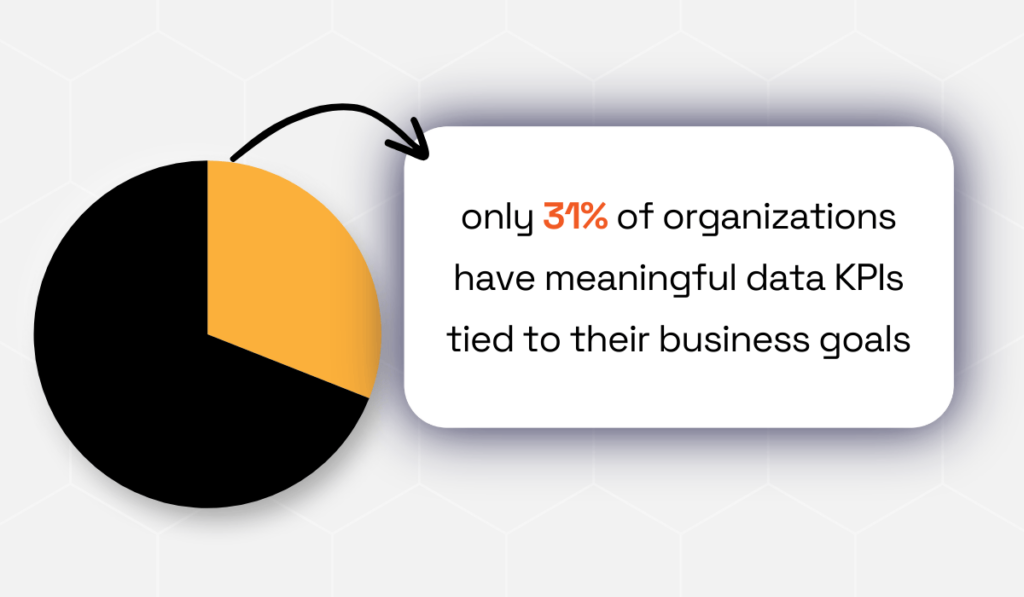
Illustration: Veridion / Data: LeBow College of Business
This reveals a persistent gap between intention and measurable impact.
Defining clear enrichment objectives ensures that new data additions support real outcomes, whether improving segmentation, strengthening risk analysis, or enhancing reporting.
As Joseph George, CEO at Dufrain, a data & AI consultancy, explains:
“A data strategy sets out how an organisation is going to use data to achieve its strategic vision and business objectives. It is therefore imperative that an organisation has taken the time and effort to provide clarity on its strategic objectives, which can be used when creating a data strategy.”
Most enrichment initiatives begin with a specific operational or analytical challenge.
Organizations typically enrich data to support functions such as:
For example, a marketing team might enrich account records with firmographic attributes such as company size, industry classification, and revenue range.
These fields enable more accurate audience segmentation and the design of campaigns that target the right market segments.
Sales teams often pursue enrichment to strengthen account intelligence.
Adding data points such as company growth signals, technology stacks, or recent funding activity can help sales representatives prioritize prospects more likely to convert.
Procurement and compliance teams may focus on enrichment that strengthens supplier risk monitoring.
Additional attributes, like ownership structures, sanctions exposure, or geographic operations, help organizations identify potential risks within their supply chains.
Once the use case is clear, the next step is translating the enrichment goal into a concrete data specification.
In other words, determine which data attributes are required to support your business objectives.
For example, improving customer segmentation may require firmographic fields such as:
Risk assessment initiatives, on the other hand, may prioritize legal entity identifiers, ownership relationships, regulatory data, and operational locations.
By mapping business objectives to specific attributes, organizations can focus enrichment efforts on the data that delivers the greatest impact.
Once you’ve assessed your data’s current state and defined your enrichment goals, it can be tempting to jump straight into enrichment.
After all, you know what data you need, so why not start adding it?
Because enrichment doesn’t fix poor data quality. It builds on it.
Appending new attributes to records that already contain duplicates, inconsistent formatting, or outdated information simply embeds those problems into a larger, more authoritative-looking dataset.
At that point, errors become harder to detect and significantly more difficult to correct.
In other words, dirty data, enriched or not, is still dirty.
As data quality expert Thomas C. Redman, a President at Data Quality Solutions and author of Data Driven: Profiting from Your Most Important Business Asset, famously observed:
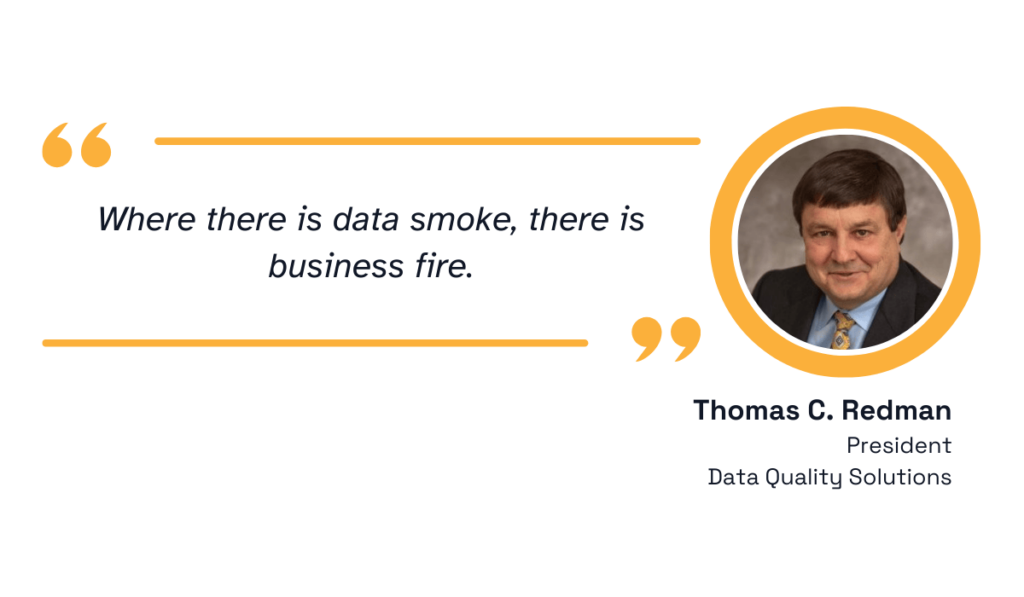
Illustration: Veridion / Quote: Goodreads
The message is clear: visible data issues often signal deeper operational problems across systems and processes.
This is why data cleansing must precede enrichment.
In fact, data preparation remains one of the most time-consuming stages of analytics workflows.
In Anaconda’s State of Data Science 2022 survey, data professionals reported spending 39% of their time preparing and cleansing data.
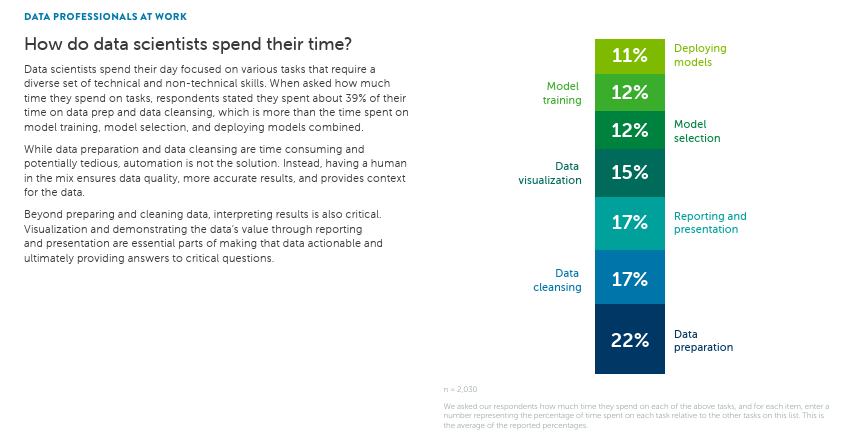
Source: Anaconda
This highlights how foundational this step is to analysis or enrichment.
Effective data cleansing involves several distinct, sequential activities.
Deduplication is the first priority.
Duplicate records are difficult to manage once enrichment has occurred.
Imagine enriching 15,000 account records with firmographic data from a third-party provider, only to discover months later that 1,800 of those records were duplicates created during previous CRM migrations.
Each duplicate may now contain slightly different attribute values returned at different times.
Instead of simply merging records, your team must now reconcile conflicting enriched attributes.
Deduplication before data enrichment would have taken two weeks.
Resolving the enriched duplicates now takes you four months.
Normalization comes next.
This step standardizes values so that the same concept is expressed consistently across the dataset.
Company names, phone numbers, country codes, and revenue fields are common examples.
Without consistent formatting, enrichment providers may fail to match records correctly or append inaccurate attributes.
Finally, validation ensures that standardized data is also plausible.
Validation rules check whether values fall within expected ranges or formats, for example, identifying a phone number with too many digits or a founding year listed as 2075.
These checks catch errors that normalization alone cannot detect.
Ultimately, the goal of cleansing is to ensure enrichment builds on a reliable foundation.
When records are standardized, deduplicated, and validated, enrichment efforts can confidently add new attributes that improve decision-making rather than introducing new layers of data complexity.
The next step may have the biggest long-term impact on your enrichment strategy: choosing the right data sources.
Data enrichment sources determine how effectively you can fill the gaps identified in earlier stages.
If the underlying sources are inaccurate, incomplete, or poorly maintained, even well-structured enrichment pipelines will produce unreliable results.
Conversely, high-quality sources allow enrichment programs to compound in value over time, improving segmentation, analytics, and decision-making across the organization.
As Armand Ruiz, former VP of AI Platform at IBM, puts it:
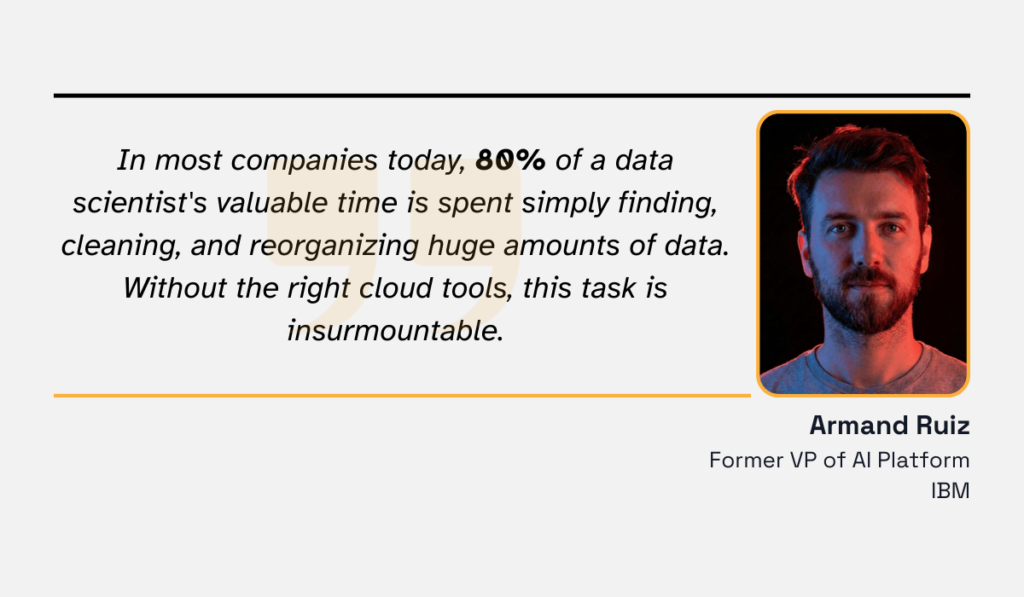
Illustration: Veridion / Quote: Info World
The enrichment source landscape mainly falls into three broad categories:
| Enrichment Source | Description | Examples | Pros | Cons |
|---|---|---|---|---|
| Public Records and Open Data | Information published by governments, regulators, and official registries. | Incorporation dates, registered addresses, directors, ownership records | Authoritative and often freeStrong legal validation | Limited depthInconsistent global coverageInfrequent updates |
| Commercial Data Providers | Vendors that aggregate, normalize, and maintain large business datasets. | Firmographics, revenue ranges, employee counts, technographics, funding events | High coverage and standardized datasets Scalable enrichment | Subscription costsInsights may still be generalized |
| Proprietary and First-Party Data | Data generated internally through customer interactions and operational systems. | CRM activity, purchase history, engagement signals, internal risk scores | Highly relevant and uniqueFully controlled by the organization | Often incomplete or siloedRequires governance and integration |
The risks of poor data sources are well-documented.
Research from Experian found that 91% of organizations believe inaccurate data negatively affects their revenue, leading to wasted resources, lost productivity, and ineffective marketing and communications spend.
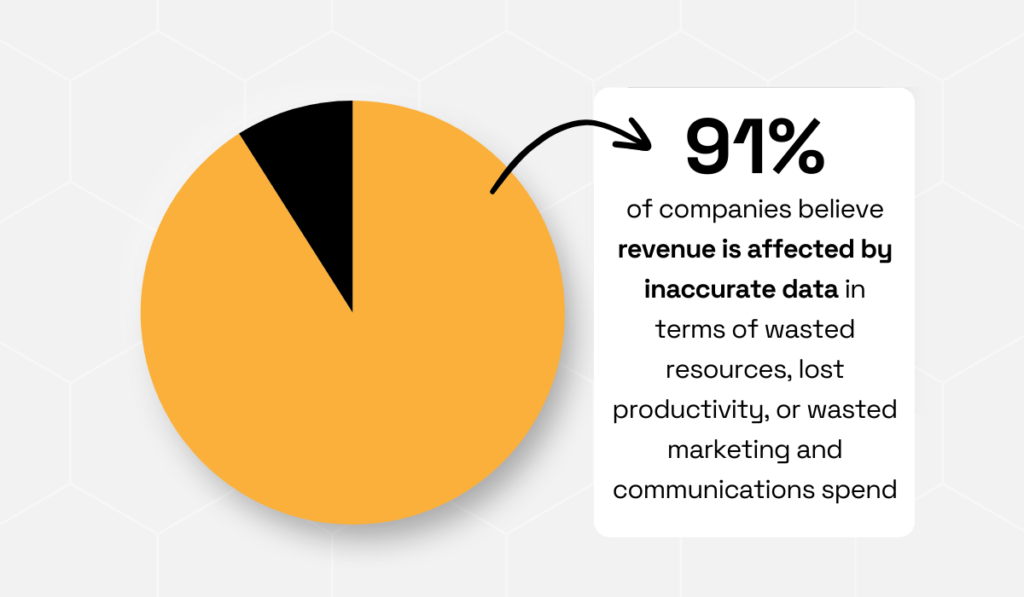
Illustration: Veridion / Data: Experian
This highlights why the choice of enrichment sources matters.
If enrichment pulls from unreliable or outdated datasets, organizations risk amplifying those inaccuracies across analytics systems, segmentation models, and operational workflows.
High-performing data teams rarely rely on a single source. Instead, they combine multiple enrichment inputs to improve both coverage and confidence.
For example, a sales operations team might validate legal information using company registries, append firmographic attributes from a commercial provider, and use internal CRM engagement data to prioritize active prospects.
Combining these sources helps reduce gaps while cross-verifying critical attributes.
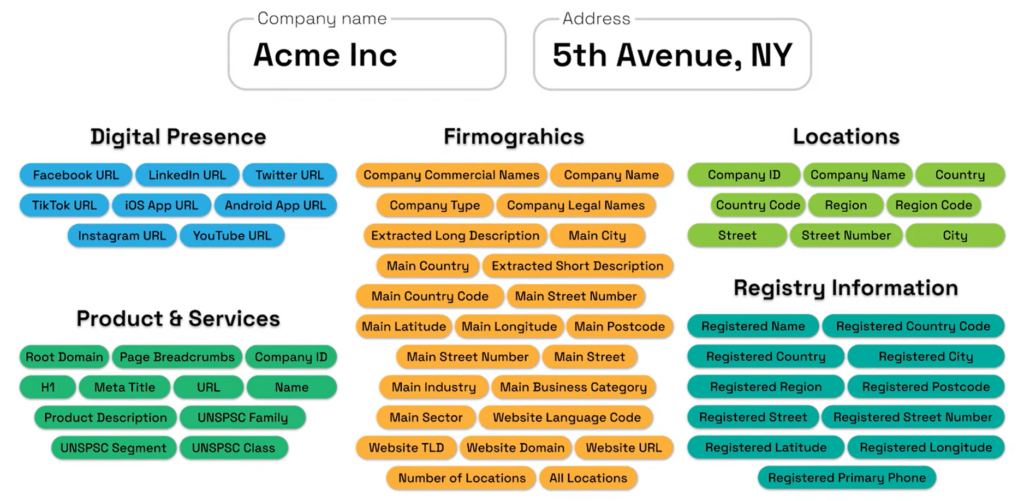
Platforms like Veridion provide another layer of enrichment by aggregating and structuring business intelligence from a wide range of digital signals.
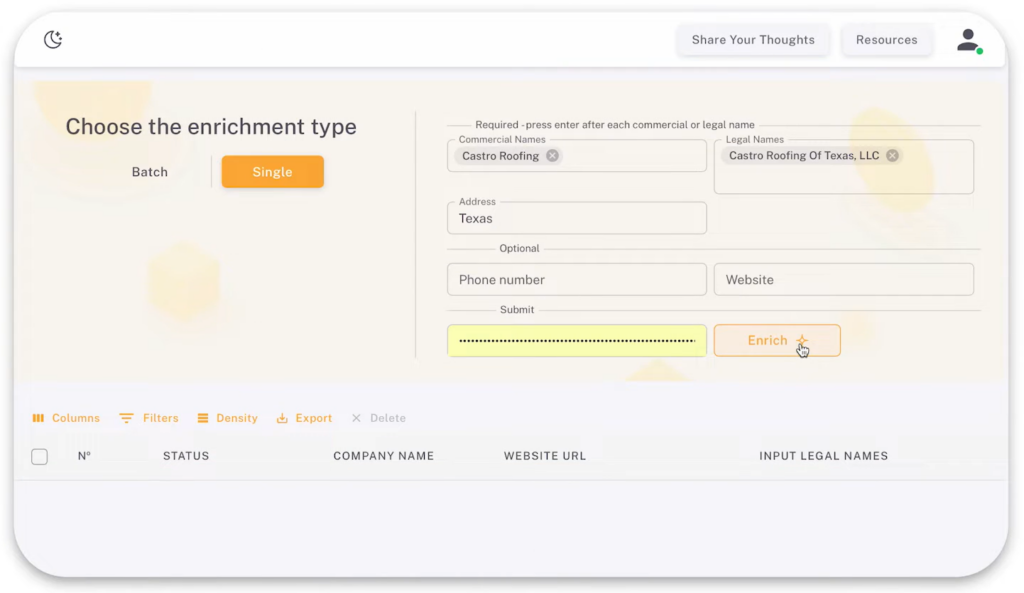
Source: Veridion
Rather than relying solely on static databases, Veridion’s AI and machine learning models continuously collect and organize information from sources such as company websites, job postings, news coverage, social media activity, and public filings.
These signals are processed and structured into detailed company profiles that organizations can use for sales intelligence, procurement analysis, and market research.
One of Veridion’s key strengths is global coverage and data depth.
Our database covers 134M companies across 250+ countries, with each profile containing 320+ attributes.
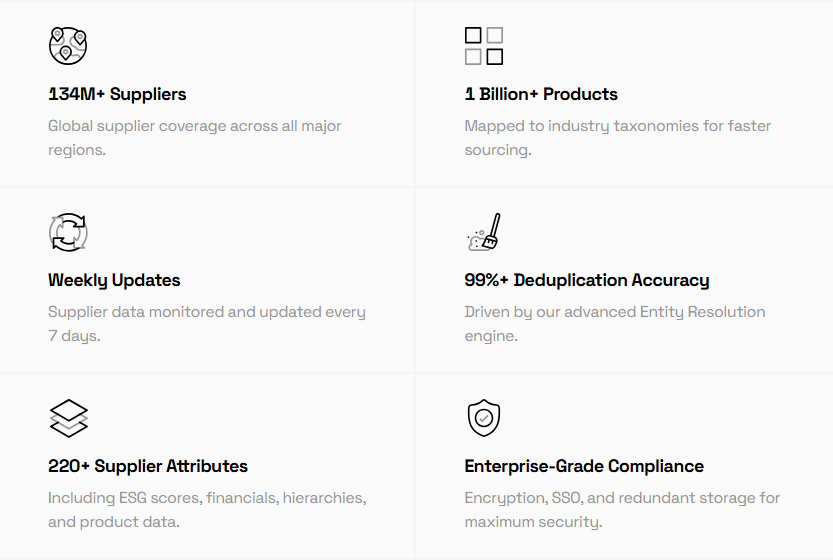
Source: Veridion
Beyond basic firmographics, these attributes include business activity classifications across multiple taxonomies (NAICS, SIC, NACE, ISIC), ESG indicators, product and service portfolios, ownership structures, location intelligence, and technographic insights.
Source: Veridion
This level of structured intelligence supports a wide range of use cases, from sales and marketing targeting to procurement risk analysis, insurance underwriting, market intelligence, and sustainability reporting.
Enrichment creates value on paper, but integration delivers it in practice.
An enriched dataset that lives in a warehouse, staging environment, or a data science team’s working files rarely produces any business outcome.
Value emerges only when enriched attributes reach the systems and the people that drive decisions.
Consider the sales rep making a call from the CRM, the underwriter reviewing a policy application, or the supply chain analyst running a risk model in the ERP.
Until enriched data reaches these operational systems, enrichment has no impact.
The challenge is that most enterprise environments aren’t built for data to move cleanly between systems.
According to MuleSoft’s Connectivity Benchmark Report, 95% of IT leaders report difficulties integrating data across systems, and 80% say integration challenges limit their ability to adopt advanced analytics.
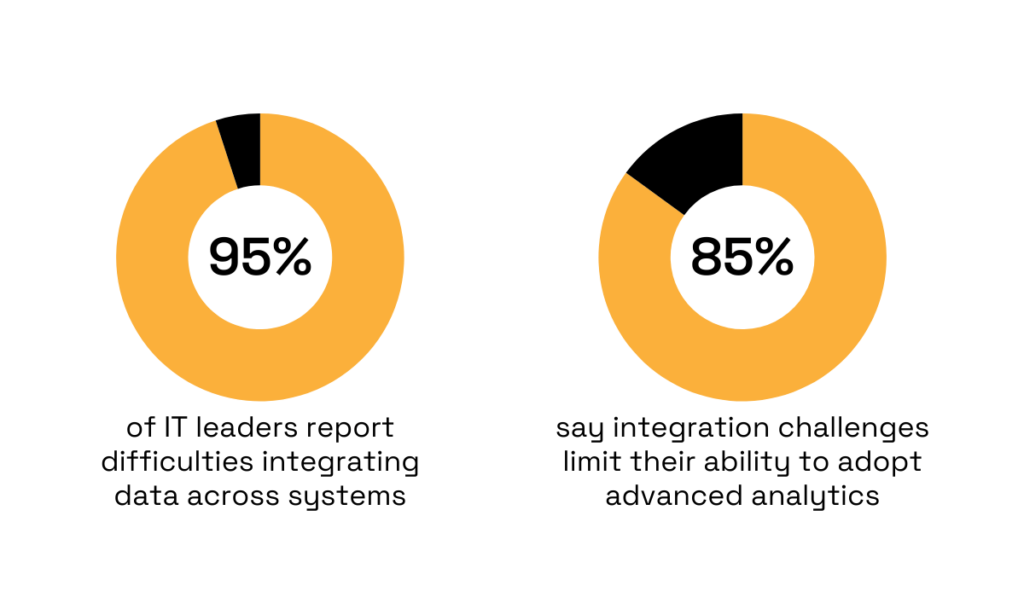
Illustration: Veridion / Data: MuleSoft
Without reliable integration pipelines, enriched attributes often remain isolated within data platforms rather than influencing operational decisions.
You can start by integrating enriched data into their CRM systems, where it can immediately improve sales and marketing operations.
For example, enriched firmgraphic attributes, such as:
…can automatically update account records, enabling sales teams to prioritize high-value prospects and marketing teams to build more precise segmentation models.
Integration into ERP and procurement systems supports supplier intelligence and operational decision-making.
When supplier records are enriched with ownership structures, geographic operations, or regulatory risk indicators, procurement teams can identify potential supply chain vulnerabilities and monitor vendor relationships more effectively.
Business intelligence (BI) platforms are another critical destination for enriched data.
Once integrated into analytics environments, enrichment attributes can enhance dashboards, forecasting models, and market analysis.
For example, a BI team analyzing customer acquisition performance can combine internal revenue data with enriched firmographic attributes to identify which industries or company sizes generate the highest lifetime value.
Despite these benefits, integrating enriched data across systems presents several challenges.
Field mismatches, inconsistent identifiers, and schema differences can cause enriched attributes to appear incomplete or duplicated across platforms.
Without careful mapping and governance, the same company might appear as separate records across CRM, ERP, and analytics systems.
As Karl Wachtel, Founder & Managing Director at XPLM, a software company specializing in integrating PLM systems with CAD, ERP, and IoT applications, explains:
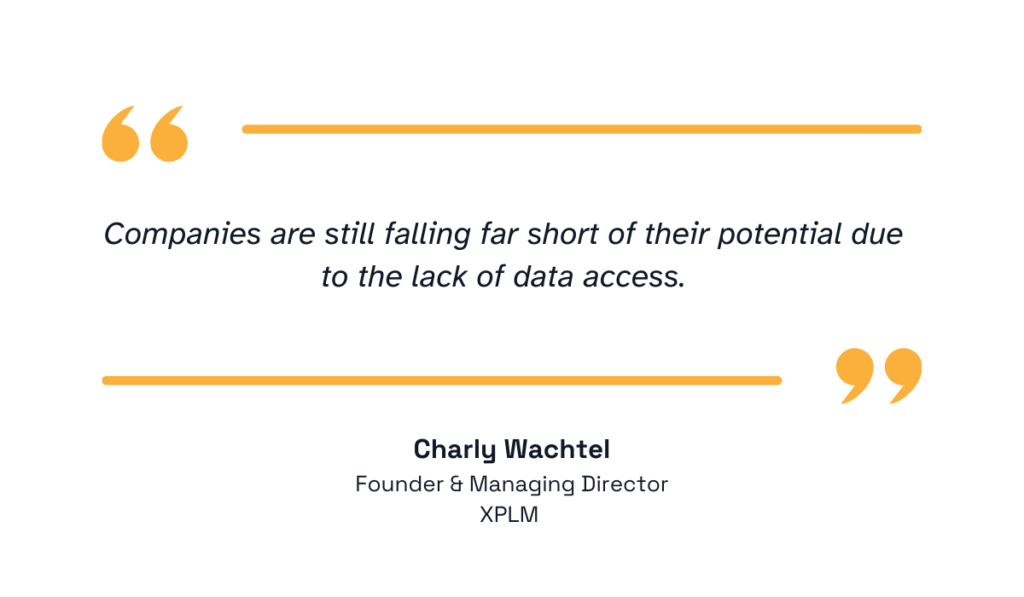
Illustration: Veridion / Quote: XPLM
In other words, even high-quality data becomes ineffective if it cannot move seamlessly across operational systems.
To prevent this fragmentation, you can implement master data management (MDM) practices, standardized identifiers, and automated data pipelines that synchronize updates across systems.
When integration is designed thoughtfully, enrichment becomes part of a continuous data lifecycle.
Data enrichment is an ongoing process, not a one-time project.
Business data changes constantly as companies grow, relocate, change leadership, adopt new technologies, or enter new markets.
A study of 1,025 business cards found that 70.8% had at least one change within 12 months.
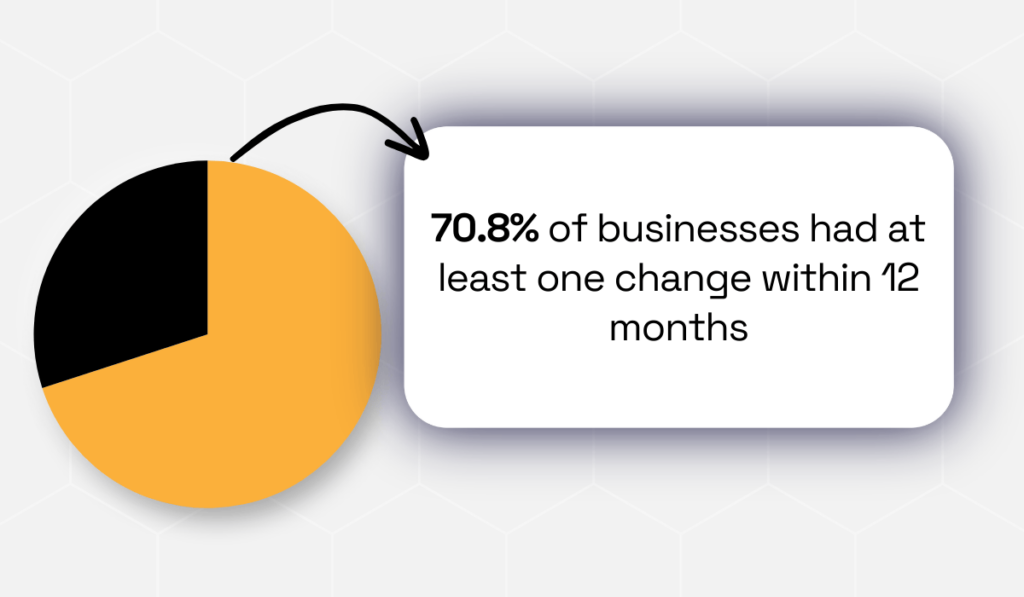
Illustration: Veridion / Data: Industry Select
In practice, this means that nearly three-quarters of your data can be outdated within a single year.
If enrichment occurs only once, the dataset’s value begins to decline almost immediately.
Stale data affects business functions across the board:
To prevent decay, establish defined refresh cycles.
High-velocity data, such as contact information, hiring signals, or technology adoption, may require monthly or quarterly updates.
More stable attributes, such as incorporation details or industry classifications, may be refreshed annually.
The optimal cadence depends on how quickly the data changes and its importance to decision-making.
Beyond scheduled updates, your team needs to implement continuous monitoring practices to maintain quality over time.
These practices often include:
Platforms like Veridion enhance continuous updates by collecting and structuring external business signals from company websites, job postings, news coverage, and regulatory filings.
Profiles are automatically updated as new information becomes available, ensuring datasets remain accurate and actionable.
Treat enrichment as a continuous lifecycle, not a one-time effort.
Sustained data reliability enables confident decisions across sales, risk management, procurement, and analytics, turning enriched data into a strategic asset rather than a static record.
Skipping any of the above steps risks compounding errors, wasting resources, or limiting the impact of your enrichment effort.
Remember, enrichment only delivers value when it’s structured, strategic, and ongoing.
Every duplicate resolved, every outdated record updated, and every enriched attribute integrated into the right system amplifies your ability to act on insights with precision and speed.
This is how you transform your data from a static collection of facts into a dynamic engine for growth, innovation, and competitive advantage.