
Blog
6 Ways to Gather More Meaningful Market Intelligence for Your E-Commerce Business
By: Auras Tanase -
17 June 2026


We love our data, and now that you're here, you're one step closer to loving it too.
A wide sample of data, so you can explore what is possible with our data
Choose ->
built with procurement in mind. Focused on manufacturers, products and more
Choose ->
built with insurance in mind. Focused on classifications, business activity tags and more
Choose ->
built with sustainability in mind. Focused on sustainability commitments, and environmental and social governance insights.
Choose ->
built with strategic insights in mind. Focused on market trends, competitor analysis, and industry-specific data
Choose ->

Keep up to date with our technology, what our clients are doing and get interesting monthly market insights.

Key Takeaways:
The harsh world of e-commerce tends to punish slow decisions.
Prices fluctuate daily, customer expectations change fast, and competitors move abruptly.
The teams that stay ahead do not rely on instinct. They gather and act on market intelligence, helping them spot trends early and make smarter decisions.
In this article, we break down six proven market intelligence strategies. Each shows how you can use data on competitors, customers, products, locations, and performance to drive growth.
Let’s begin.
A rival cuts the price on your top-selling item by 12%, and you only find out three weeks later from your sales dip. By then, your customers have jumped ship to the competitor, and the damage is done.
Competitor monitoring prevents that scenario. It helps you keep an eye on price adjustments, new product arrivals, promo schedules, and changes to their messaging about your category.
The goal is to spot what your rivals do in good time. Then you can choose to match them, respond differently, or stick with your current plans.
Retail experts warn that businesses “flying blind” risk losing ground. As Uri Knorovich, Co -founder & CEO of Nimble, a web search agent platform, notes:
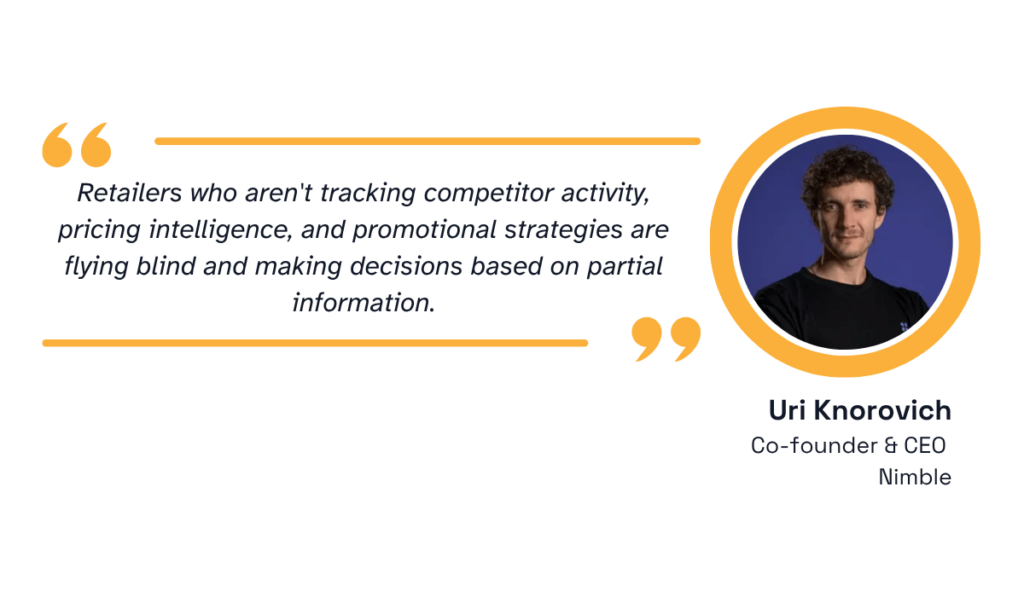
Illustration: Veridion / Quote: Nimble
To take the guesswork out of the equation, automate data gathering from competitors’ websites and ads. Capture info on prices, stock, and what they offer. So, you don’t learn about their flash sales or discounts too late.
Veridion can help automate a part of your competitor monitoring. This AI-powered market intelligence platform gives procurement and market intelligence teams access to unparalleled data accuracy and depth.
The platform builds structured company profiles that cover product and service offerings, pricing signals, firmographic data, and operational changes for millions of businesses globally.
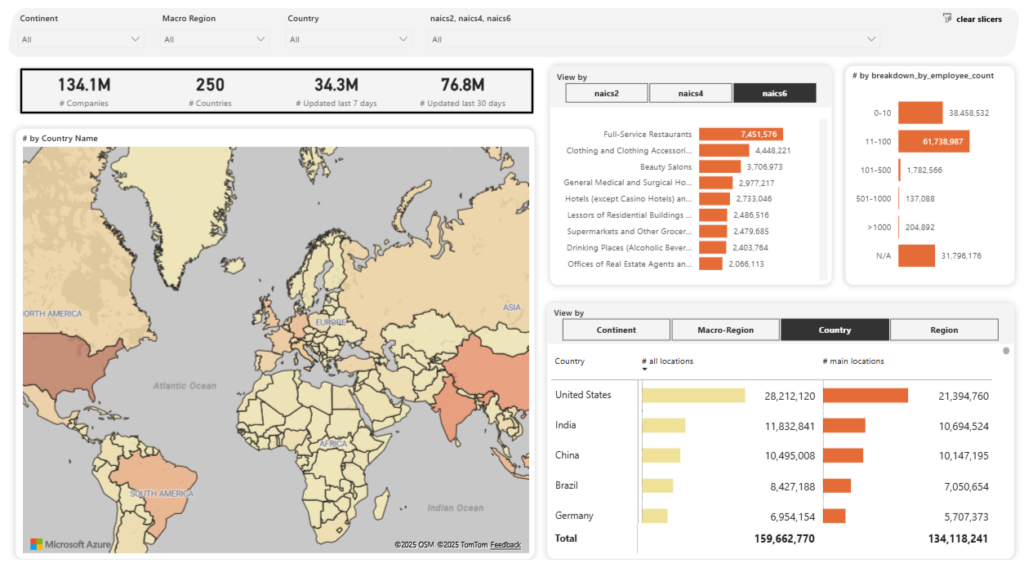
Source: Veridion
You can also use Veridion’s company APIs to retrieve key info on your top competitors. For instance, if you’re an electronics retailer, you could query Veridion for companies whose products include “smartphone.”
You’ll then get a list of competitors, including their locations, industry tags, and possibly contact info. This lets you automatically monitor any changes.
With this intel in hand, you adjust your strategy on the fly.
Spot a rival slashing laptop prices? Consider matching or bundling free accessories. See a competitor launch a new gadget? Explore stocking it or running a counter-campaign.
The practical step here is simple. For each key category, build a short list of competitors you watch consistently.
Define which signals trigger a review, a price drop above a certain threshold, a new product in your category, or a major promotional push.
Then build a process for acting on what you find, not just collecting it.
By doing this in real time, you avoid surprises and seize opportunities before your rivals do.
In addition to competition, you also need to listen to your customers.
People now research products extensively before buying.
According to a PowerReviews survey, 99.9% of American consumers read reviews when shopping online at least some of the time, with 96% specifically looking for negative reviews to get a balanced view.
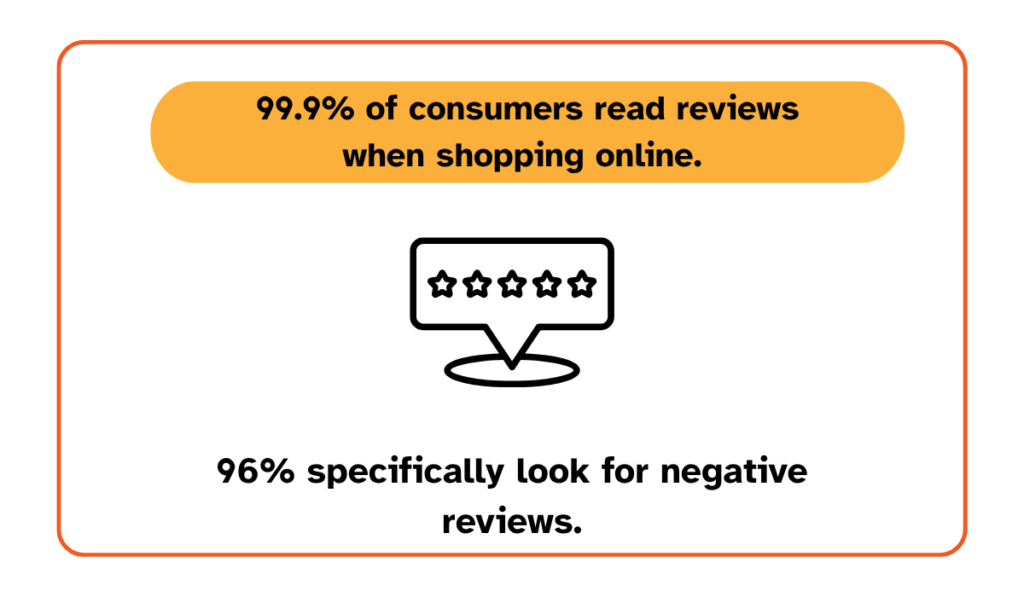
Illustration: Veridion / Data: PowerReviews
But these reviews aren’t valuable just to buyers, but to sellers as well.
Customers are constantly sharing opinions on review platforms, social media channels, forums, and post-purchase surveys.
This feedback reveals product quality issues earlier than return rates or complaint volumes do.
If reviews for a specific supplier’s product trend toward durability complaints in the third month of use, you have time to raise it in your next supplier review before it becomes a returns problem.
To tap into this “voice of the customer,” analyze reviews, feedback forms, and social media comments.
Understandably, reading all of it manually may be time-consuming, and information may easily fall through the cracks.
This is where Natural Language Processing (NLP) changes the equation. NLP algorithms can quickly process thousands of user comments.
As shown in the example below, they classify each piece of feedback as positive, negative, or neutral and even identify common complaints or praises.
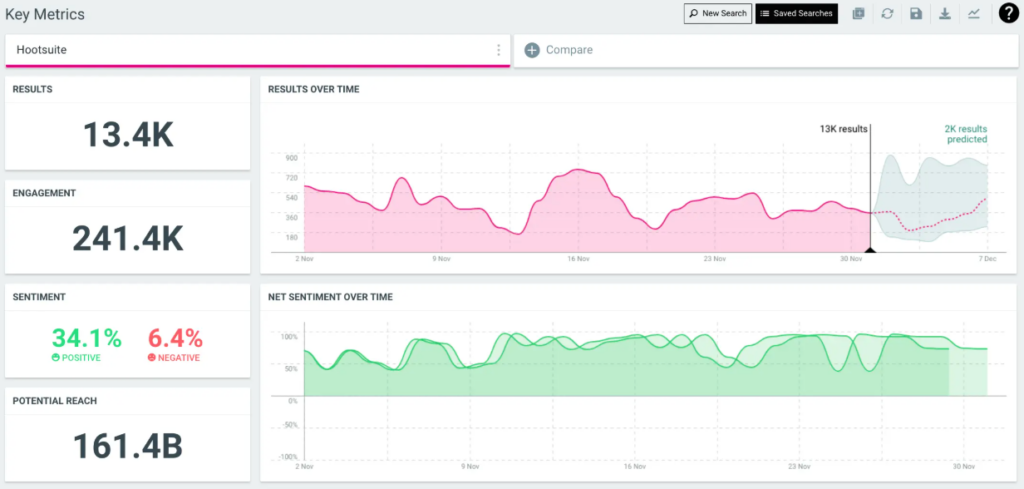
Source: Hootsuite
Modern analytics tools also support “social listening”: automatically tracking brand, competitor, and category mentions across platforms like Reddit, X, Instagram, and industry forums.
This gives you signals before they appear in review data.
When customer reviews rave about eco-friendly materials, use that as an excuse to highlight those products or even find more like them.
The same goes for new categories blowing up on social media; why not jump on that bandwagon?
Conversely, if a competitor’s customers rave about a feature you lack, it could signal a gap you need to fill.
The action here is clear: do not wait for returns to surface product problems. Regularly pull your site’s new reviews and social posts into a text analytics tool. Your competitors’ sites as well.
Use these insights to improve products or train your support team. Remember, unhappy customers often churn silently, but with data, you can catch them early.
Let’s talk about predicting what will sell and when.
This is key for e-commerce businesses because mismanaging inventory can be pricey no matter which way it swings.
If you have too much stock, you end up paying for extra storage space, locking up cash flow, and possibly slashing prices to get rid of stuff.
In fact, according to IHL, global retailers lose about $1.2 trillion every year due to overstocking products.
On the other hand, insufficient inventory hits your wallet hard as well. The same research suggests that understocking costs retailers around $554 billion in lost sales.
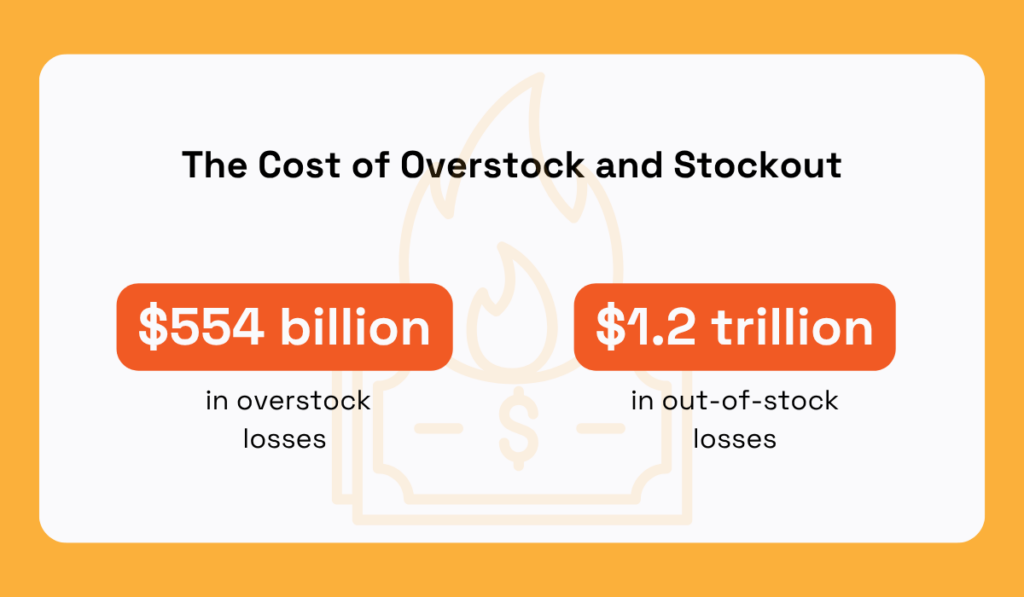
Illustration: Veridion / Data: IHL
To dodge such losses, use demand forecasting. This strategy involves analyzing past sales data, seasonal shifts, and external influences to anticipate future needs.
If you get this right, you keep just the right amount of inventory on hand, avoiding both stockouts and overstock.
To kick off your demand forecasting, apply time-series models (such as ARIMA or exponential smoothing) to your sales history. At its core, a time-series model analyzes historical sales data over time and identifies patterns likely to recur.
Instead of asking, “What do we think customers will buy next month?”, you’re asking, “What does the data suggest customers will buy next month based on previous behavior?”
That distinction matters because inventory decisions become grounded in evidence rather than assumptions.
Also, remember that incorporating seasonality is key.
Ignoring it means your purchase orders use the yearly average, leading to shortages during peak times and surpluses during slower periods.
And you can always include safety stock in your forecast.
Safety stock is inventory held above your expected demand to absorb your supplier’s delivery lead time and unexpected demand spikes in your category.
You don’t want too much safety stock because it hikes up costs. Yet, too little leads to missed sales at crucial times. To balance this properly, monitor lead time reliability and demand fluctuations carefully.
In practice, run monthly (or weekly) demand planning. Review model predictions against reality and refine as needed.
Communicate forecasts to suppliers early. This way, you avoid losing customers to empty shelves or tying up cash in slow-moving items.
The same product does not behave the same way in every market.
In one city, it sells at full price through mobile checkout. In another, it moves only when discounted. In a third market, there is strong search demand but no established supplier.
Treating all three markets identically means you are optimizing for none of them.
What you should do is analyze your data by geography (country, state, or city) to see where demand is strongest and where you might localize.
As Pankaj Ghemawat, a globalization researcher, puts it:
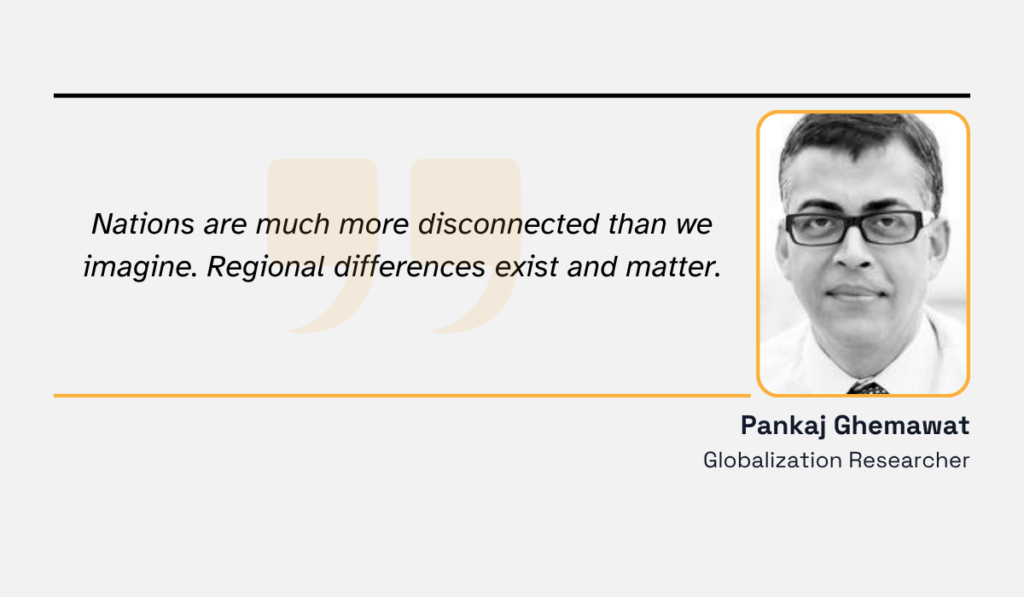
Illustration: Veridion / Quote: TED
Geo-market analysis applies market intelligence to understand markets at the segment level.
You identify patterns within specific geographies, analyze them using metrics relevant to your category, and plan based on local conditions rather than global averages.
This is super important for cross-border e-commerce. To nail international markets, you need to understand the conditions in each market. Methods that work at home will rarely translate efficiently.
Use market data and web analytics to spot these patterns and then tailor advertising by location and stock those regional preferences.
Localization is key, too.
Language, currency, taxes, and regulations vary by place. A good market-intelligence platform should include attributes such as country of operation, payment methods, and even local certifications.
If your data shows a spike in searches for “eco-friendly baby products” in Germany, consider translating your listings to German and adjusting your marketing.
On the other hand, if two regions have similar preferences, you might standardize operations to save costs.
When you use demographic and regional data to tweak pricing, promos, and even product design for each market, you ensure your tactics fit real customers’ behaviors where you’re trying to succeed.
Every customer visit to your e-commerce site creates data.
People come to a page, look around, click things, pause sometimes, and eventually decide to buy or leave.
When they choose to leave, and exactly when that happens, impacts the amount of revenue your business makes.
This is where you apply behavioral analysis to fully understand how your customers move through your site so you can find where the buying process breaks down and fix it.
Start by mapping the customer journey: every step from landing page to checkout.
Tools like Google Analytics and other advanced platforms can show you funnels and drop-off points.
For example, if 65% of customers add a product to their cart but only 28% complete checkout, something specific is preventing them from completing checkout. Identify those friction points and fix them.
The scale of this opportunity is significant.
The Baymard Institute, which tracks cart abandonment data across thousands of e-commerce sites, reports an average abandonment rate of 70.19%.
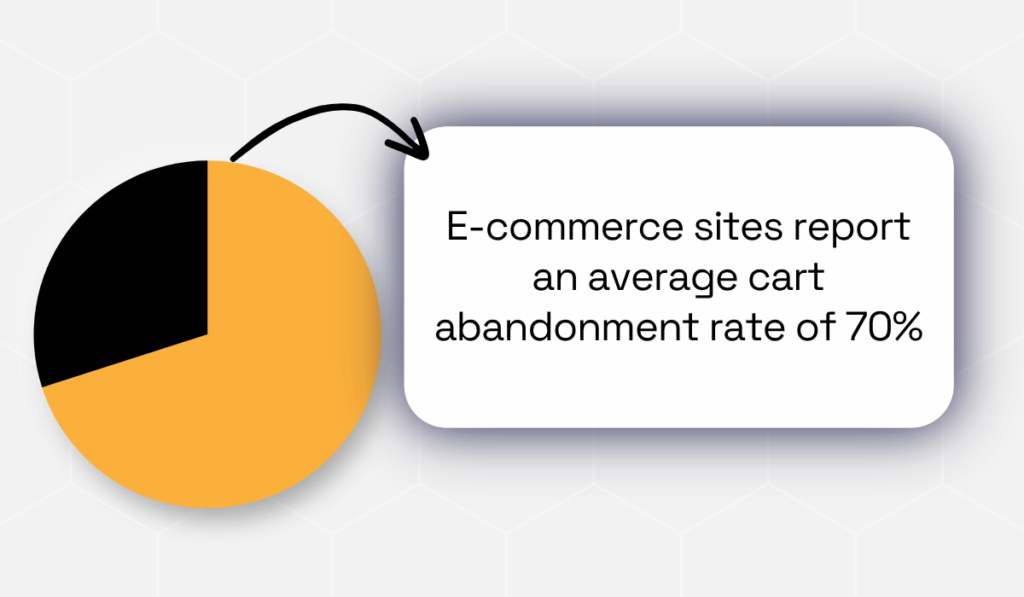
Illustration: Veridion / Data: Baymard Institute
Think about a site that brings in $10 million a year. If that business recovers just 5% of the abandoned items, that’s $500,000 with no extra ad spend; that’s huge.
This is the kind of problem that behavioral data helps uncover.
And the best part is, the data this strategy uncovers can do wonders for personalization.
When your site knows what someone likes based on their past visits, it can perfectly recommend products to them. The customer doesn’t need to search; the perfect item appears for them.
This directly translates to a significant boost to your bottom line.
In fact, a McKinsey report on personalization shows that companies nailing it see a 40 percent revenue boost.
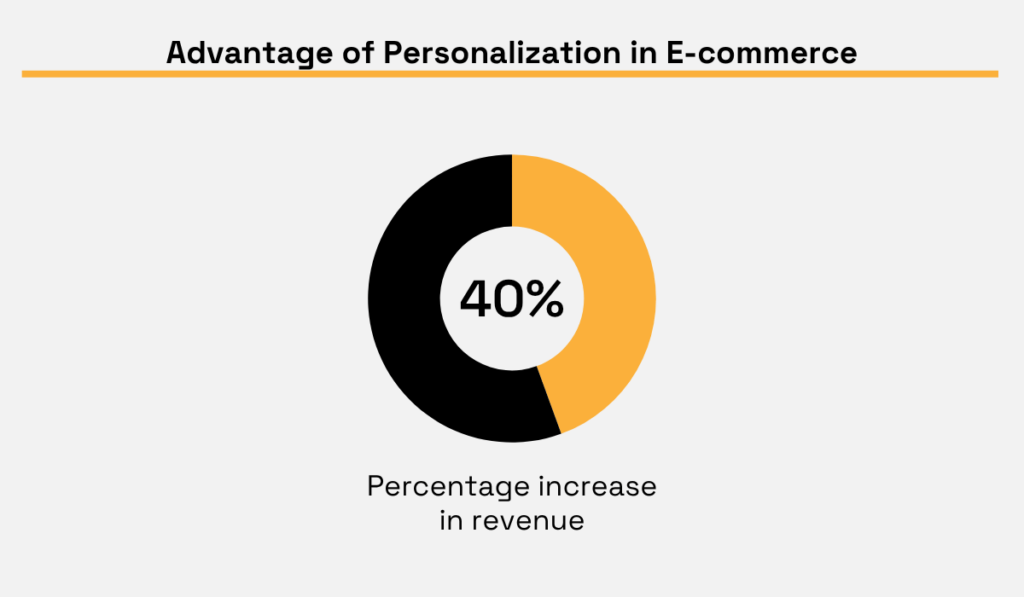
Illustration: Veridion / Data: McKinsey
So keep track of what users click and what they like.
Figure out which pages they stay on and which ones they leave immediately.
From there, adjust your site, maybe by simplifying the checkout process or offering personalized choices.
Making customers happy keeps them around and encourages them to spend more.
The last strategy involves comparing yourself against your industry or direct peers.
Say your conversion rate improved from 1.8% to 2.2% this year.
That’s progress, but if the industry average is 3.1%, you’re still behind and could be missing out on sales compared to competitors who hit that mark.
With an external benchmark, you can quickly gather this kind of info.
Benchmarking against industry standards lets you identify weaknesses and actual growth.
First off, pick the right Key Performance Indicators (KPIs).
Common e-commerce metrics include
How do you typically gauge these metrics?
If your sales run through marketplaces, look at your seller rating or fulfillment score relative to the averages. In B2B procurement, comparing order cycle times or fill rates can give valuable insights.
To set improvement goals, use industry reports or aggregated benchmarks as a guide.
For example, the overall e-commerce conversion rate hovers around 2-4%, though it varies by sector.
If your rate falls below this, there’s a chance your checkout process has an issue that benchmarking will help spot.
Benchmarking also applies to competitive share. Share of wallet or market share can be estimated from public data and compared.
For example, track whether a rival’s product launch is eating into your sales.
Ignoring competitive share can be costly: Verizon lost nearly 290,000 customers in one quarter due to some fierce competitor promotions.
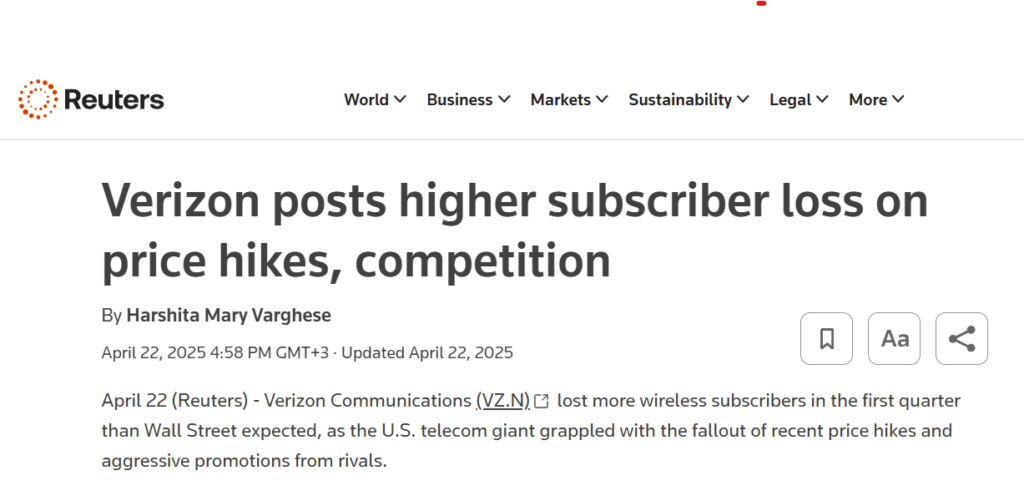
Source: Reuters
This perfectly illustrates how important it is to pay attention to industry benchmarks.
In the end, using industry benchmarks isn’t just about seeing how you stack up; it’s also about pushing yourself to improve.
You want to be better than average at converting, being efficient, and keeping customers happy over time.
You might’ve noticed by now that each of these six strategies tackles a different question.
Competitor monitoring tracks what rivals are up to, while sentiment analysis pinpoints customer thoughts.
Demand forecasting shows future demand, geo-market analysis spots where customers hang out, and so on.
That’s why there’s no single winning strategy when it comes to gathering e-commerce market intelligence.
You’ll likely need a combination of all of them to get a clear picture of the market, stay agile, and keep winning.