
Blog
How to Develop a Data Strategy in Banking and Capital Markets
By: Stefan Gergely -
25 June 2026


We love our data, and now that you're here, you're one step closer to loving it too.
A wide sample of data, so you can explore what is possible with our data
Choose ->
built with procurement in mind. Focused on manufacturers, products and more
Choose ->
built with insurance in mind. Focused on classifications, business activity tags and more
Choose ->
built with sustainability in mind. Focused on sustainability commitments, and environmental and social governance insights.
Choose ->
built with strategic insights in mind. Focused on market trends, competitor analysis, and industry-specific data
Choose ->

Keep up to date with our technology, what our clients are doing and get interesting monthly market insights.

Key Takeaways:
You rely on data to support everything from lending and risk management to customer onboarding.
However, data alone does not improve decision-making. When information is inaccurate, difficult to access, or disconnected from your objectives, you can’t use it with confidence.
This is where a data strategy becomes important. It helps you improve data quality, establish accountability, and make information more accessible.
Below, we’ll walk through the key steps involved in building a data strategy and how it can help you turn data into a more reliable asset.
Assessing your current data landscape is the first step in building an effective data strategy.
Yet many financial institutions still struggle to locate, access, and trust the data they already have.
According to Deloitte’s 2024 Banking & Capital Markets Data and Analytics Market Survey, more than 90% of banking data users said the data they need is often unavailable or takes too long to retrieve.
Additionally, 81% identified data quality as a major challenge.
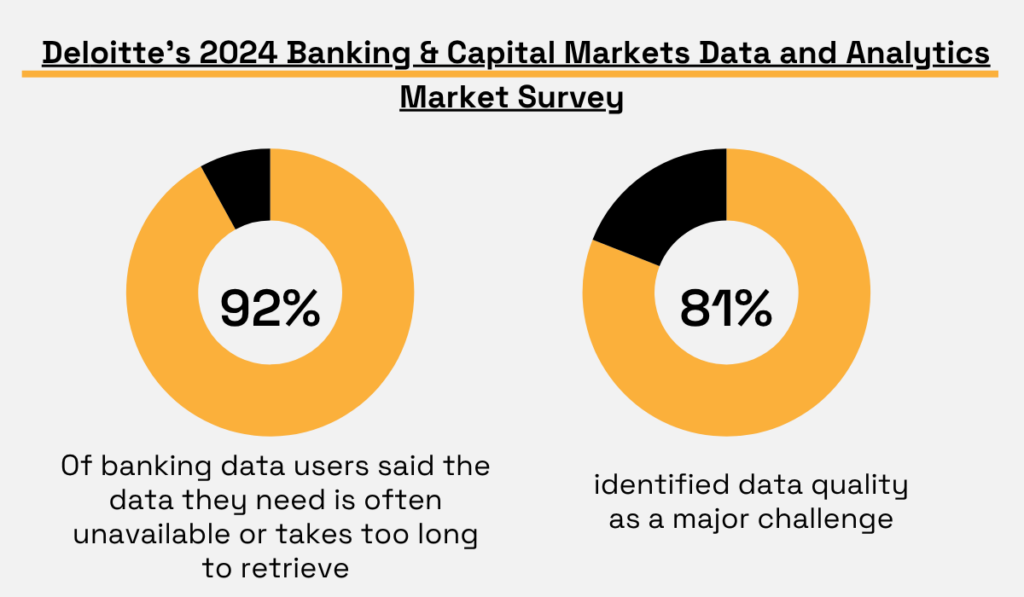
Illustration: Veridion / Data: Deloitte
Much of the problem stems from how data accumulates over time.
Every acquisition introduces new technology. Every product adds new datasets. Regulatory requirements create additional reporting layers.
As a result, information spreads across platforms that were never designed to work together.
This fragmentation creates data silos that make it harder to share information across the organization.
According to the IBM Institute for Business Value, 77% of organizations say data silos hinder real-time analytics and data-driven decision-making.
Another 83% believe silos limit innovation by preventing information sharing across departments.
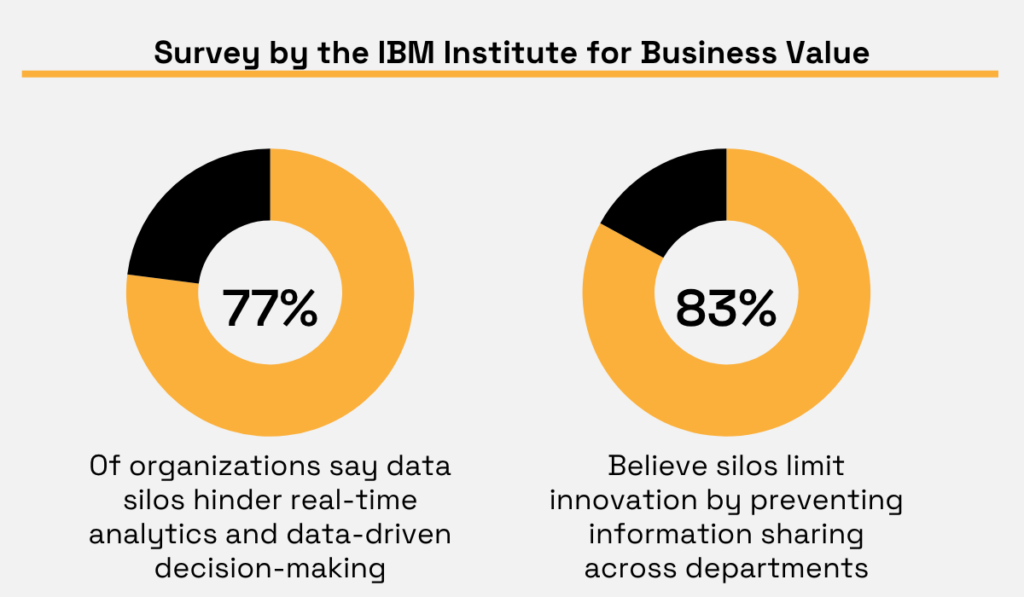
Illustration: Veridion / Data: IBM
Data fragmentation is not limited to internal systems.
Financial institutions also rely on external sources such as credit bureaus, market data providers, and regulatory feeds. And when this data exists across disconnected systems and sources, inconsistencies become harder to identify and resolve.
In fact, InterSystems found that 88% of financial services organizations struggle with data that is duplicated, spread across multiple sources, and poorly integrated.
This is exactly what a data audit is designed to uncover.
It creates an inventory of your data assets and shows you where information originates, how it moves across systems, and who is responsible for it.
It also helps identify duplicate records, missing information, and other quality issues that affect reporting and decision-making.
The Bank of England follows a similar approach in its data strategy. One of its priorities is helping employees discover, understand, and trust the data available to them.
The strategy also emphasizes identifying information gaps that limit how effectively information can be used across the organization.
According to their website:
“The Bank collects large amounts of data and relies on data acquired from external organisations and purchased from third parties. This includes the production of statistics for the financial sector and prudential regulation and supervision. This mission will identify data gaps and work to close the most important ones.”
A data audit helps you achieve the same visibility into your own data environment. That clarity becomes the foundation for everything that follows.
But visibility is not enough. The next step is making sure the data is accurate enough to support decisions in lending, risk, and operations.
Accurate data is the foundation of every decision you make.
Yet Gartner estimates that poor data quality costs organizations an average of $12.9 million each year.
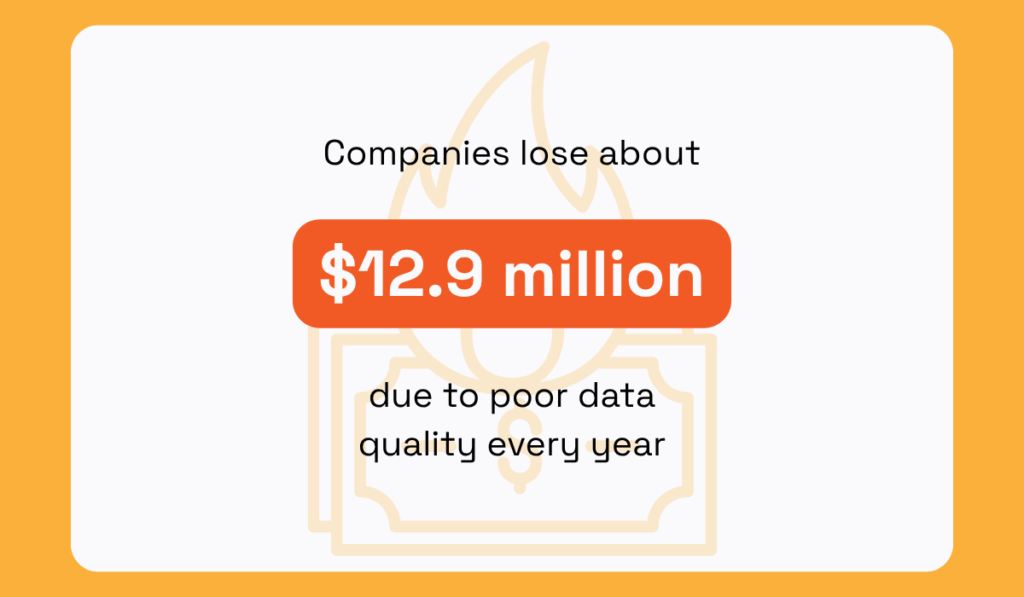
Illustration: Veridion / Data: IBM
Most organizations don’t see these costs in one place. Instead, they show up through inaccurate risk assessments and compliance investigations.
So how can you reduce these issues? It starts by understanding where inaccuracies exist and how to correct them. This typically involves three activities:
Validation involves confirming company details, verifying ownership structures, checking operational status, and comparing records against authoritative sources.
This step becomes especially important in heavily regulated industries.
An analysis by Kyckr found that 68% of AML fines issued by the FCA between 2020 and 2025 involved poor-quality data, including outdated information and failures to verify ownership structures.
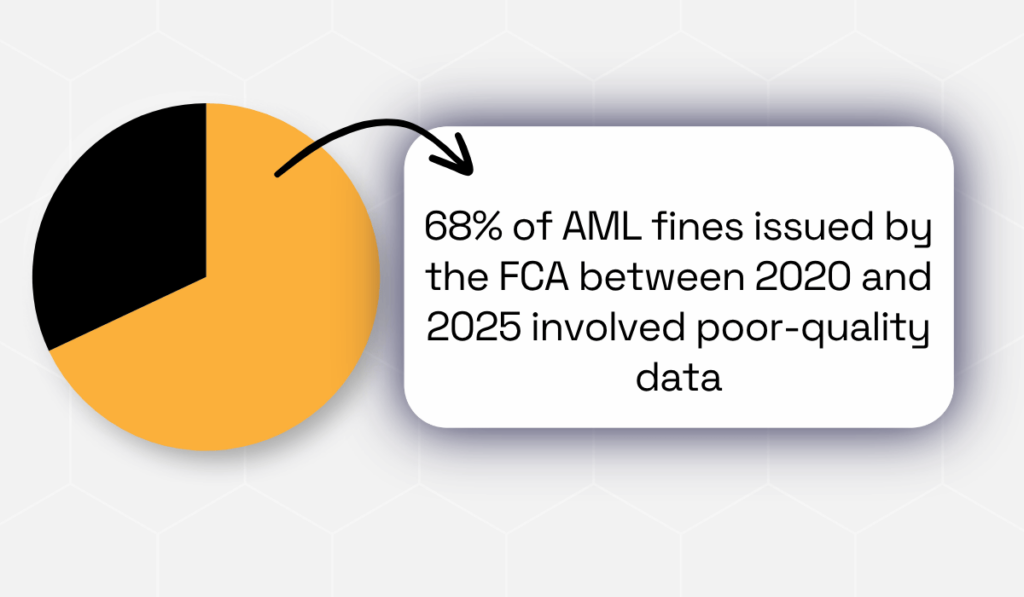
Illustration: Veridion / Data: Kyckr
This happens because business information changes over time.
Data collected during onboarding does not remain accurate forever. Businesses change ownership. New subsidiaries are created.
Organizations enter new markets and restructure their operations.
However, data cleansing addresses most of these issues uncovered during validation.
This includes removing duplicate records, correcting errors, filling in missing information, and resolving conflicting entries across systems.
The importance of this becomes clear when inaccurate information remains unresolved.
In 2024, the Federal Reserve fined Citigroup $136 million for making insufficient progress in addressing long-standing weaknesses in its data quality management practices and failing to implement adequate controls to manage the resulting risks.
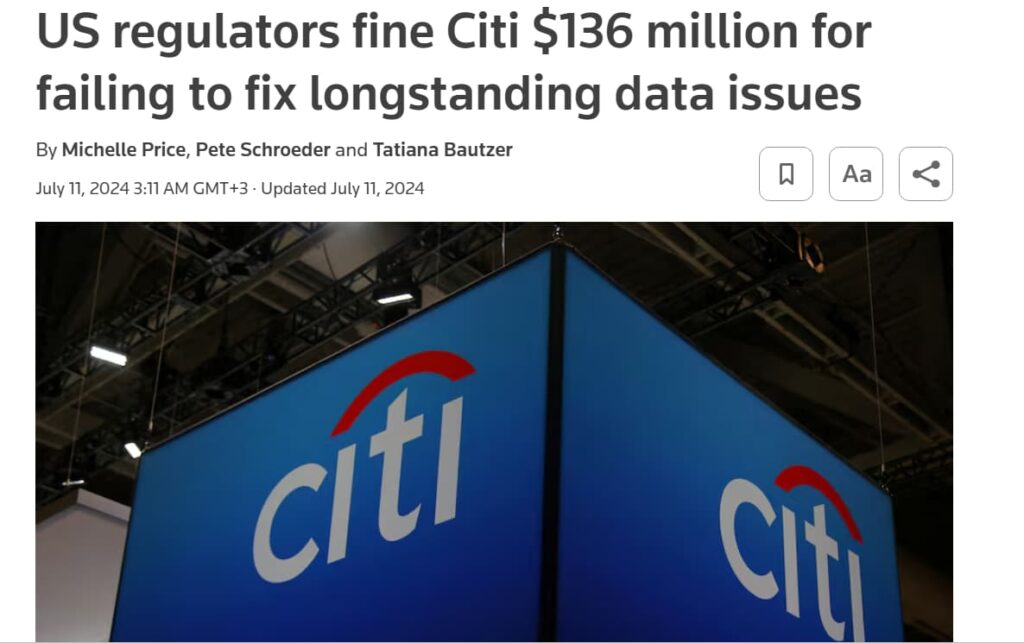
Source: Reuters
According to the Financial Times, former Citi employees said:
“Commercial loan files frequently contained errors involving maturity dates, collateral information, and even loan amounts. These inaccuracies affected regulators’ ability to assess the bank’s financial condition and risk exposure.”
And this shows why data cleansing matters. Once those issues have been corrected, the focus shifts to consistency across systems.
Standardization helps achieve that consistency through shared identifiers and standardized data formats.
However, maintaining accurate records still becomes harder as information changes over time.
In fact, research from ECGI found that approximately 8.2% of firms change ownership every year. So, for instance, information collected during onboarding can quickly become outdated.
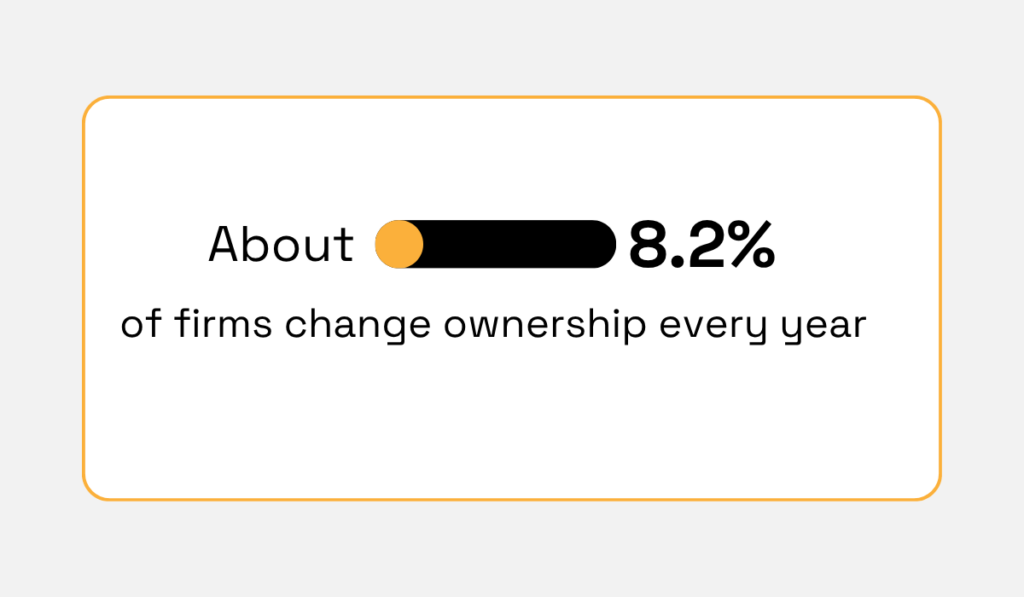
Illustration: Veridion / Data: ECGI
This is why many institutions use data enrichment platforms like Veridion to update their records constantly.
Veridion tracks more than 134 million companies across 250 countries and refreshes its database weekly.
This lets you validate company details against up-to-date data, update incomplete or outdated records, and access information in a standardized format across systems.
Veridion’s Match & Enrich API can enrich existing records using as little as a company name and country of registration.
This enriched data gives you additional information about a business, such as verified ownership information, operational status, and compliance indicators.
Maintaining accurate records helps ensure you can rely on your data with confidence.
A data strategy creates value when it helps you achieve specific business goals.
That sounds a bit obvious, but organizations often invest heavily in data without a clear understanding of how those investments will improve growth, customer experience, or risk management.
A better approach is to start with the goals of the business.
DBS, one of Asia’s largest banks, took this approach during its digital transformation.
In 2014, CEO Piyush Gupta introduced a simple vision: “Make Banking Joyful.” The goal was to create a frictionless customer experience and operate more like a tech company.
That vision shaped how the bank used data, analytics, and AI. Rather than investing in technology for its own sake, DBS focused on initiatives tied to specific business outcomes.
The bank applied analytics and AI to functions such as marketing, hiring, and ATM operations.
One initiative used data analytics to reduce ATM downtime and save approximately SGD 20 million. The bank also reported better hiring outcomes and stronger marketing performance from its AI models.
The lesson here is simple. Before deciding what data to collect, integrate, or improve, you need to understand the outcome you are trying to achieve.
You might be trying to reduce customer attrition, improve credit decisions, strengthen fraud prevention, or accelerate onboarding. Each objective depends on different types of data.
Once those priorities are clear, you can identify the datasets that support them.
For example:
| Business Objective | Data Domain | KPI |
|---|---|---|
| Reduce credit losses | Counterparty data | Non-performing loan ratio |
| Improve customer retention | Customer data | Churn rate |
| Strengthen fraud prevention | Transaction data | Fraud losses |
| Accelerate onboarding | Identity data | Time-to-onboard |
This exercise makes the relationship between data and business outcomes visible.
Rob Casper, former Global Chief Data Officer at JPMorgan, explains:
“The best advice I have for senior leaders trying to develop and implement a data culture is to stay very true to the business problem… If you simply rely on having huge quantities of data in a data lake, you’re kidding yourself. Volume is not a viable data strategy.”
It becomes easier to measure value and maintain executive support when you align your data strategy with the outcome you are trying to achieve.
Data is easier to trust when everyone knows who is responsible for it. But without clear ownership, issues tend to surface late, and resolution becomes fragmented.
This remains a challenge across banking.
More than a decade after the introduction of BCBS 239, only 2 of 31 Global Systemically Important Banks had fully complied with all of its principles.
PwC also found that no single BCBS 239 principle had been fully implemented across all banks.
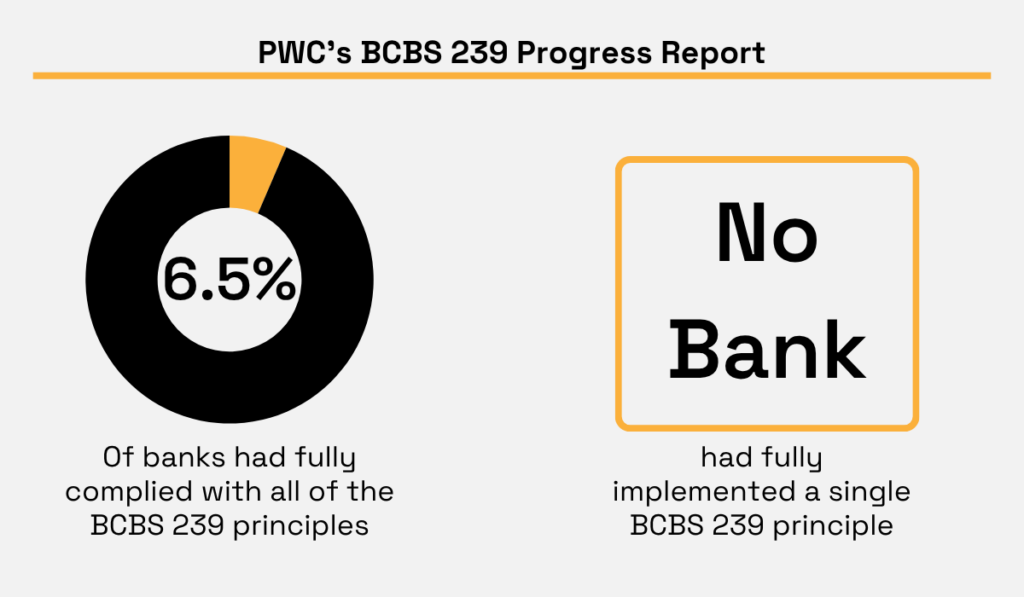
Illustration: Veridion / Data: PwC
Many of these gaps come down to accountability.
Institutions may know a data issue exists, but struggle to determine who owns the dataset, who is responsible for correcting it, or how quality is being monitored over time.
Every important data domain should have a clearly defined owner.
BCBS provides a good example of how this works in practice.
One bank established a network of end-to-end data owners across the organization. Each owner took responsibility for data quality throughout the data lifecycle, from source systems to regulatory reports.
The framework gave employees a clear point of contact.
If someone questioned the meaning of a data element, they could go directly to the responsible owner. If a data quality issue surfaced, that owner was responsible for fixing it.
The bank also monitored progress closely. A steering committee chaired by the CEO reviewed the program every month, while the board provided oversight.
According to BCBS, the framework improved data management and strengthened data quality monitoring across the organization.
This is the value of ownership. When customer records become outdated or counterparty information fails validation checks, you know exactly who is responsible for addressing the issue.
Ownership alone, however, is not enough.
You also need controls that help maintain quality as data moves through the organization.
You can see why these controls matter in the case of JPMorgan Chase.
In 2024, the bank disclosed that it expected to pay approximately $350 million in penalties after discovering that certain trading and order data had not been fed into its trade surveillance platforms.

Source: Reuters
The issue did not stem from employee misconduct or missing data. The data existed.
The problem was that it was not reaching the systems responsible for monitoring trading activity and identifying potential risks.
This example highlights that institutions also need controls that ensure information is complete, traceable, and available where it is needed.
And one of the most important controls is data lineage. It allows you to trace information back to its source. If a figure appears in a risk report or regulatory filing, you can see where it originated and how it moved through your systems.
Other controls support the same goal:
Together, these controls make it easier to identify problems before they affect business decisions or regulatory reporting.
A modern data architecture makes information accessible across the organization. However, many financial institutions still struggle to provide timely access to data.
According to InterSystems, 86% of financial services leaders lack confidence in using data to support decision-making.
The study also found that 98% of institutions operate with data and application silos, while 95% of the data used for decisions is more than one hour old.
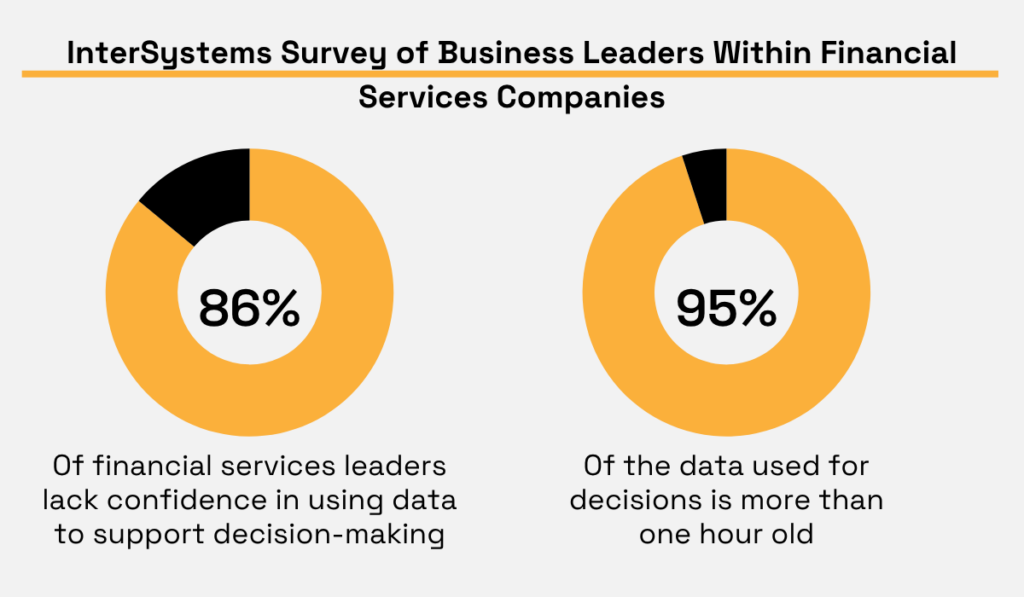
Illustration: Veridion / Data: InterSystems
These findings show that data exists across the organization, but it is often difficult to access it when it is needed.
Modern architectures help solve this problem through integration.
APIs and integration layers connect your banking systems and standardize how data flows. This makes it easier to build a more complete view of customers, counterparties, and operations.
But you also need to ensure the architecture supports how your organization uses that information.
McKinsey notes that many banks struggle to realize value from data initiatives because their architecture does not support the business and analytical use cases those initiatives were designed to enable.
The impact of getting this right, though, can be significant.
Deloitte documented a global bank that was operating on a 20-year-old legacy architecture.
Risk data was spread across regions and systems. Teams spent significant time reconciling information before they could analyze risk or produce reports.
The bank addressed the problem by implementing a centralized architecture that integrated risk data across the organization.
These were the results:
This shows you how better access to data can help you operate more efficiently and respond more quickly to risk.
Advanced analytics helps you understand what is likely to happen next, and one of the clearest applications of this is in risk management.
It continuously analyzes customer behavior, transaction activity, and external signals for patterns that may indicate emerging risk. This gives you more time to respond when conditions begin to change.
For example, a large US bank discovered that the predictive power of its small business underwriting models had become much less effective over time.
Its Gini coefficient had fallen to between 40% and 45%.
The bank addressed the problem by improving the data behind the model.
It broke down internal silos to create a more complete view of the customer and supplemented that information with carefully selected external data sources.
They then used advanced analytics on this newly enriched dataset, increasing the model’s predictive power to approximately 75%.
Learn more about it here:
Source: McKinsey & Company on YouTube
Machine learning models can improve the early detection of borrowers at risk of default.
In fact, McKinsey found that organizations using advanced risk models reduce credit losses by 20% to 40%.
Illustration: Veridion / Data: McKinsey
Whether your goal is reducing losses, improving customer experiences, or strengthening fraud prevention, the underlying objective remains the same. You are using data to make better decisions.
Advanced analytics helps you anticipate outcomes and act faster. This is where the value of a data strategy becomes clear.
You already generate vast amounts of data every day. A data strategy helps you ensure that information is accurate, accessible, and aligned with your goals.
The benefits of doing so can be significant. You make better decisions, manage risk more effectively, improve operational efficiency, and get more value from your analytics investments.
The challenge is that data volumes continue to grow while business and regulatory demands become more complex.
However, a well-executed data strategy helps you keep pace with those changes and get more value from your data over time.