
Blog
How to Assess Operational Risk When Industry Codes Don’t Match
By: Auras Tanase -
06 February 2026


We love our data, and now that you're here, you're one step closer to loving it too.
A wide sample of data, so you can explore what is possible with our data
Choose ->
built with procurement in mind. Focused on manufacturers, products and more
Choose ->
built with insurance in mind. Focused on classifications, business activity tags and more
Choose ->
built with sustainability in mind. Focused on sustainability commitments, and environmental and social governance insights.
Choose ->
built with strategic insights in mind. Focused on market trends, competitor analysis, and industry-specific data
Choose ->

Keep up to date with our technology, what our clients are doing and get interesting monthly market insights.

Key Takeaways:
Industry codes are meant to simplify underwriting. But when they are wrong, they do the exact opposite.
A classification that no longer reflects how a business actually operates can turn a useful shortcut into a blind spot.
And when a company’s declared industry does not match what is happening on the ground across locations, risk hides in plain sight.
As an underwriter, your role is to spot those mismatches early, translate them into real operational exposures, and adjust pricing and terms before the risk shows up in claims.
Want to learn how? Keep on reading.
Yes, industry codes like SIC and NAICS help group businesses by primary economic activity.
However, they are not built to reflect how work is performed at each location, how fast operations evolve, or how mixed-use sites behave.
NAICS was adopted in 1997 to replace SIC, but legacy codes still persist across many underwriting and data workflows.
The problem for underwriters is not a “wrong label” in the abstract.
It is that the label can cause you to miss what actually drives loss: processes, materials, people, and site-level activity.
Most mismatches happen because of occupancy drift.
In other words, the business changes, expands, or adds a secondary operation, while the code stays frozen.
Common patterns show up again and again.
For instance, a software company quietly runs pick-and-pack or returns processing in the same building.
Or perhaps a retail store produces goods on site, thus changing fire load, ventilation needs, and liability exposure.
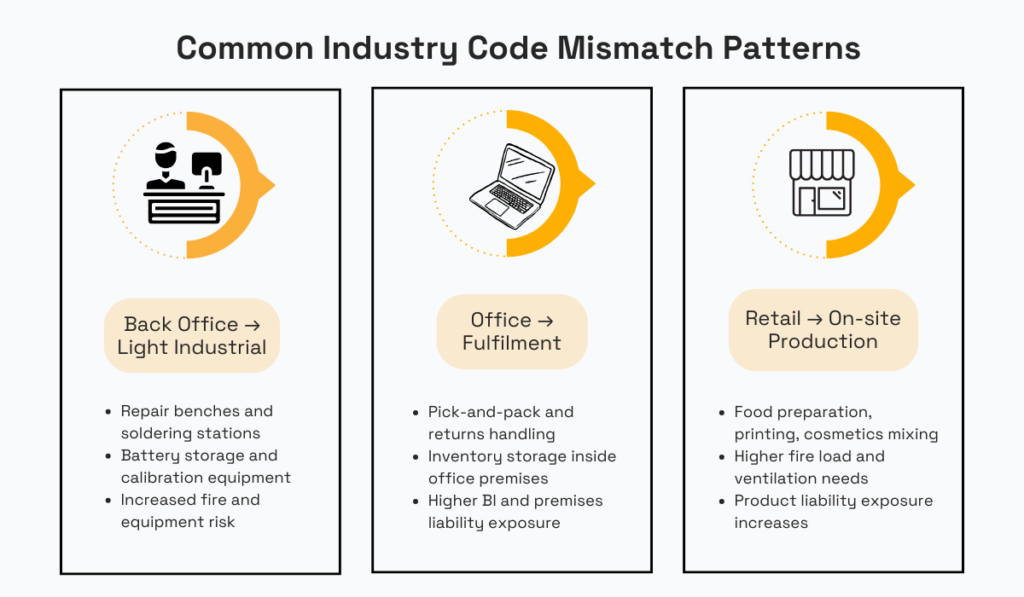
Source: Veridion
Risk Management Consultant Karen Higley captures the potential consequences of misclassification clearly:
When a classification does not reflect all operations of an organization, coverage gaps can appear.
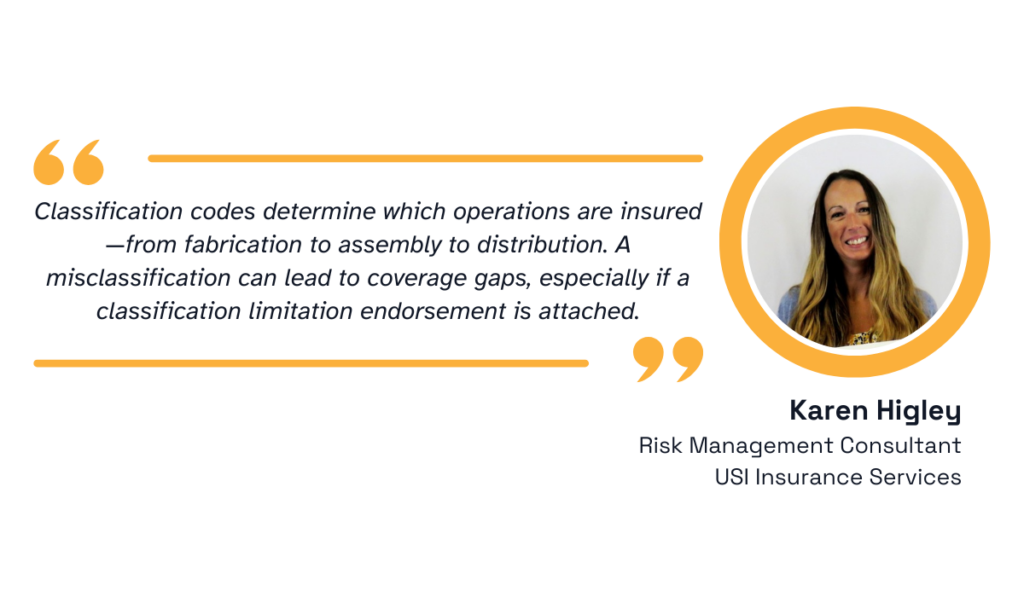
Illustration: Veridion / Quote: LinkedIn
Her example is simple but yields costly consequences:
A manufacturer classified under metal goods manufacturing that also performs on-site welding or installation may see a claim denied if the loss stems from that unclassified work.
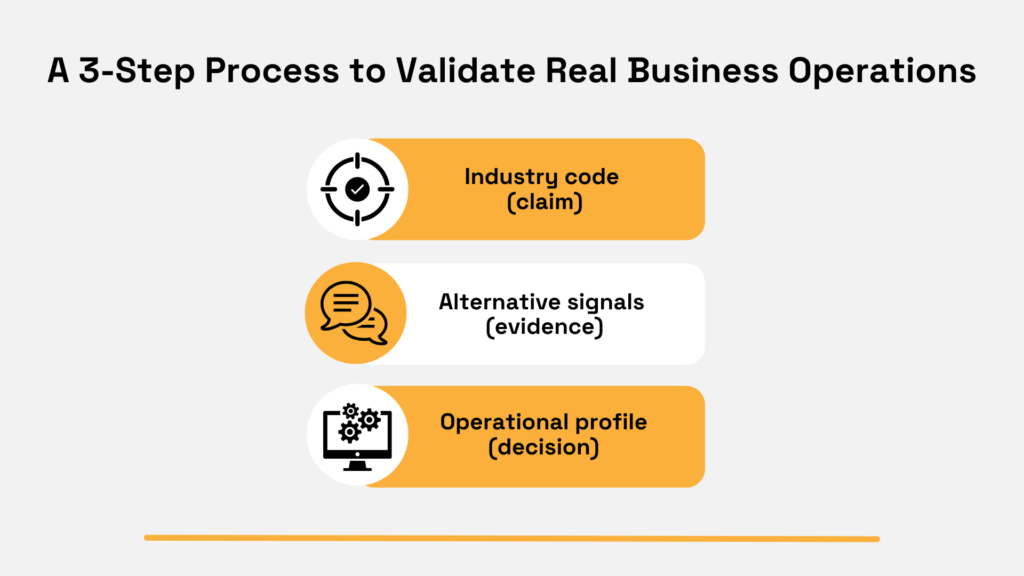
The takeaway? Treat the code as a starting point, then validate the real operating footprint.
Begin with the site itself. You are not running a full inspection.
Instead, you are checking for operational clues such as loading access, storage setup, yard space, industrial zoning, or heavier-than-expected power use.
These details often signal warehousing, light industrial work, or mixed-use activity that a services label will not capture.
Then, verify the day-to-day work through unstructured signals. Job postings show what the business is paying people to do right now.
Website language often reveals fulfilment, testing, storage, or repair workflows in plain terms.
If those signals conflict with the code, underwrite the function you can verify, not the label.
This is exactly where a data-as-a-service view helps you do the same validation consistently across locations.
When an industry code looks “right” on paper, it is tempting to stop there.
But the issue is, codes are static. Operations are not.
So, when you are validating a risk, treat the code as a starting hypothesis, not the final answer.
The bottom line is, your underwriting decisions are only going to be as good as the information you put in.
According to Wenalyze, 45% of business data provided by applicants is inaccurate.
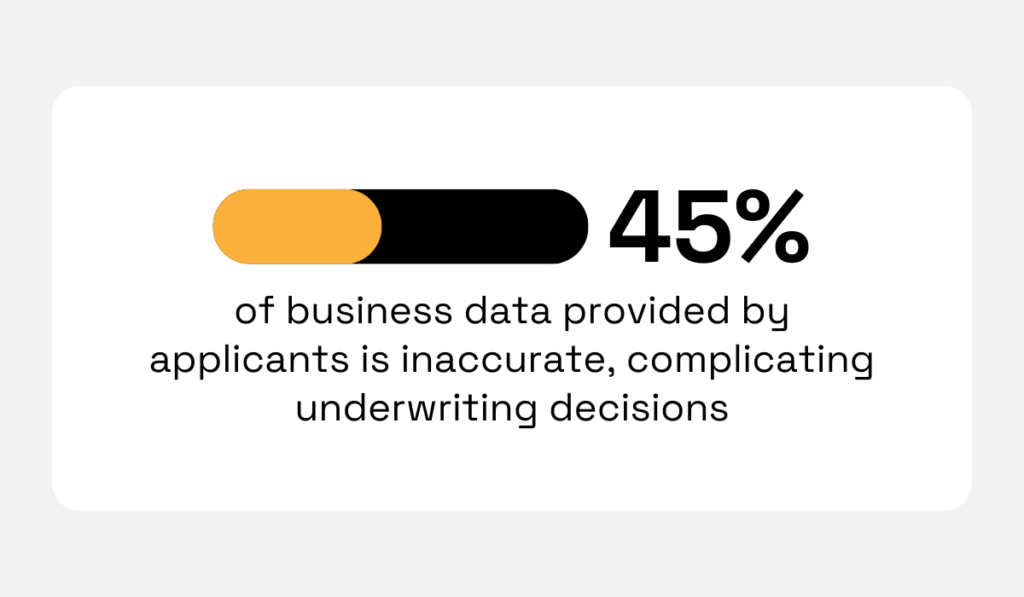
Illustration: Veridion / Data: Wenalyze
This is a big problem if you are using that same data to drive class code, pricing, and coverage decisions.
And even when applicants act in good faith, “primary activity” shortcuts and outdated records can lag behind how the business actually runs day to day.
Unstructured signals often give you stronger evidence because they describe real work, in plain language, close to where it happens:
| Job Postings | Show what the company is paying people to do right now (e.g., shift work, machinery, hazmat handling, fleet ops) |
| News, Permits and Inspections | Hint at what changed (e.g., expansions, new equipment installs, storage changes, generators) |
| Websites and listings | Tell you how the business operates (e.g., service pages, product catalogues, FAQs, “how we work” pages) |
Let’s illustrate this with an example.
A business declares “technology services,” but your scan shows hiring for warehouse associates and maintenance techs, a local permit trail for racking or equipment upgrades, and website language focused on “same-day shipping” and “returns processing.”
The code may still be “tech,” but the risk drivers now look like storage + logistics.
That is your cue to re-check fire load, premises liability, and BI assumptions at the location level.
Source: Veridion
But the thing is, this is something you want to do consistently, and not just as a one-off deep dive.
And you need a way to look beyond static records.
This is where Veridion’s data-as-a-service approach fits naturally into underwriting workflows.
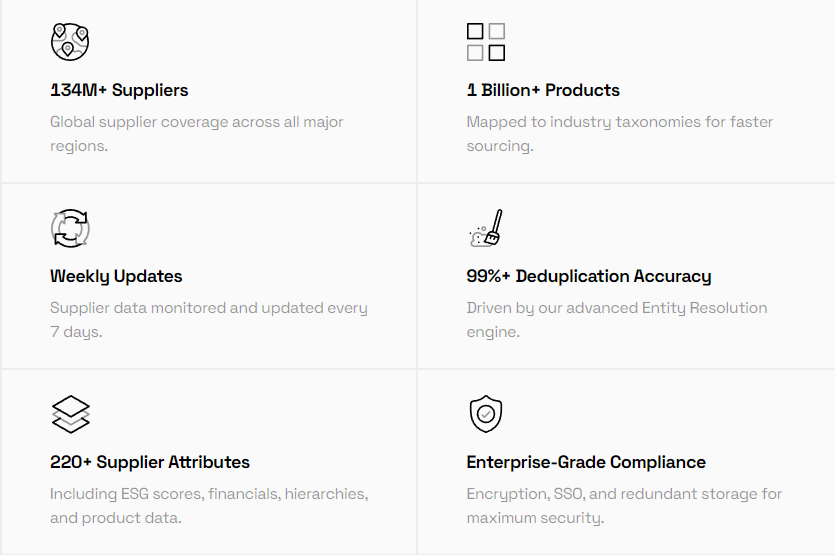
The platform covers more than 130 million companies, maps over 400 million business locations, and spans 250+ countries.
Source: Veridion
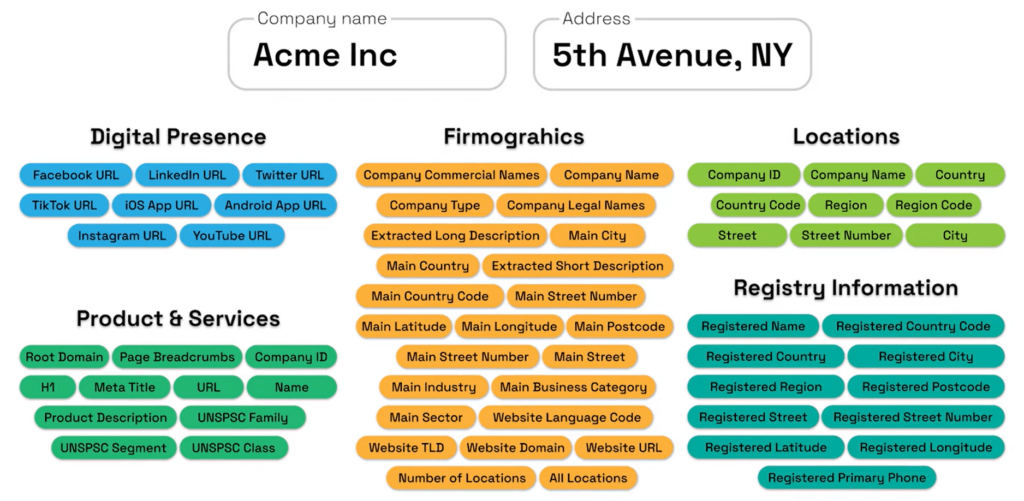
Instead of relying on one source, Veridion pulls signals from business registries, company websites, filings, news, and wider digital footprints.
Then, it uses machine learning to piece together a clearer picture of what a business actually does, and refreshes information on a weekly basis to make sure you’re basing your decisions on the most recent information.
Source: Veridion on YouTube
Once you are confident about the insured’s real operations, you are in a much better position to ask the next question that matters: who do they depend on?
Supplier and logistics relationships often surface risks that no industry code will ever show on its own.
Once you move past the industry code, the next question is a practical one: who does this business rely on to operate day to day?
Suppliers, distributors, and logistics partners often expose risk that never shows up in a classification label.
This matters because misclassification is still common. In fact, research indicates that up to 60% of businesses may be misclassified.
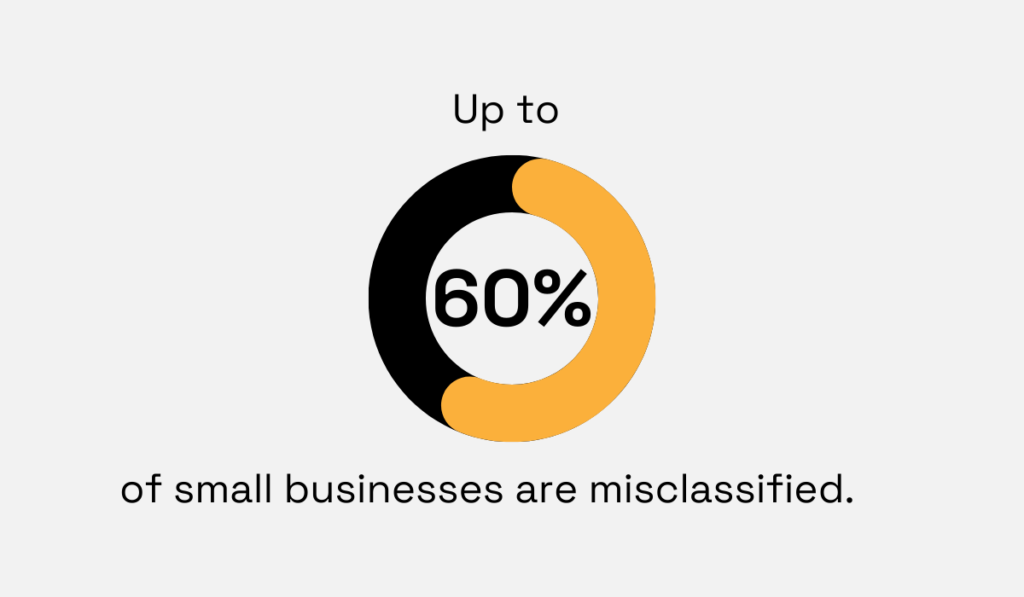
Illustration: Veridion / Data: Relativity6
This means underwriting decisions are often made using incomplete or outdated assumptions.
And when the label itself is unreliable, third-party relationships become one of the clearest signals of real exposure.
Pay attention to what those relationships imply.
A company that depends on hazardous materials suppliers, specialised chemical processors, cold-chain logistics, or heavy transport providers is carrying a very different risk than its declared code suggests.
And even if the insured’s own premises look low impact, the activities it depends on can introduce fire, pollution, or regulatory exposure that flows back into the policy.
This is also where contingent business interruption often hides.
CBI risk usually comes from limited visibility into who the insured relies on, not from the insured site itself.
When those dependencies are unclear, exposure is easy to underestimate.
Luckily, deeper supply chain insight helps close that gap.
In one enterprise case, a Tier 1 global consulting firm increased the depth of its supply chain intelligence by 2.5 times, making it easier to spot fragile or high-risk dependencies before they turned into losses.
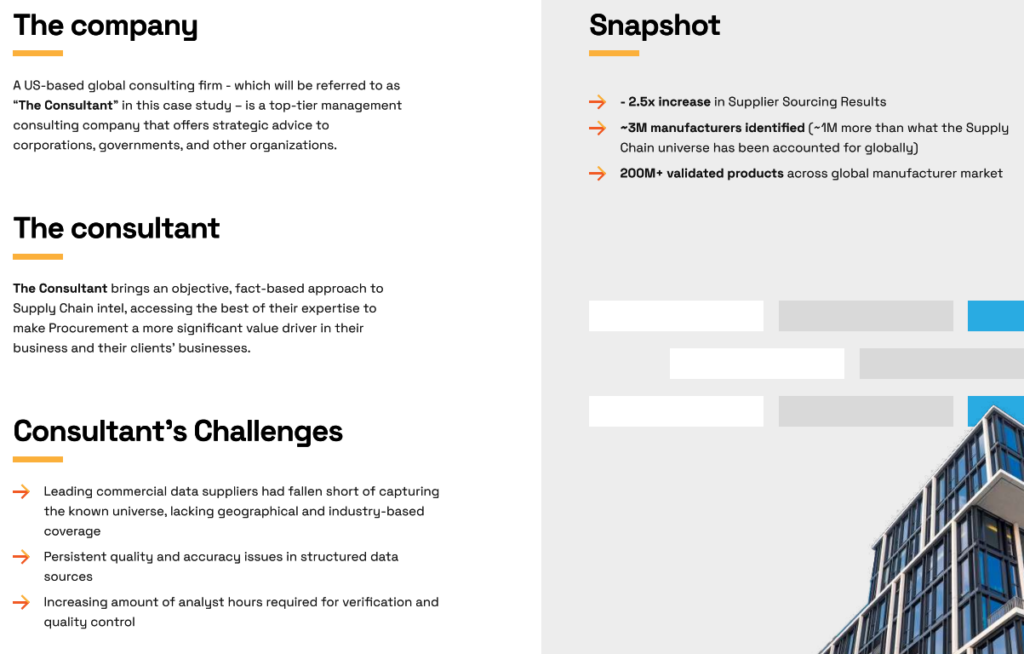
Source: Veridion
Or consider the following scenario:
A firm classified as “professional services” relies on one specialised overseas manufacturer and a single logistics partner to fulfil contracts.
On its own, the office appears low risk.
In practice, a disruption anywhere in that chain could stop revenue entirely. Without mapping those dependencies, recovery timelines, loss severity, and coverage limits are easy to underestimate.
This becomes even more important as operations grow more complex or globally distributed.
As supply chains stretch across regions and partners, concentration risk increases.
Once you see how much exposure sits outside the insured location, it becomes clear why underwriting cannot stop at labels or relationships alone.
The final step is to look closely at the actual functions being performed, because that is where operational risk ultimately lives.
Once you look past the industry label, the next question becomes much more practical: what actually happens on this site, day to day?
Underwriting risk is driven by functions and processes, not by broad categories.
Manufacturing, storage, testing, repair, and logistics all behave very differently from a risk perspective, even when they sit under the same headline code.
This is where generic labels can be misleading.
A business classified as “technology services” may sound low impact, but in reality, it could be running a data centre, an electronics lab, or a repair facility.
Suddenly, you are dealing with backup power systems, battery rooms, specialist equipment, heat generation, and higher liability exposure.
The risk profile changes, even though the industry code does not.
Focusing on functional risk drivers brings the picture into focus.
What processes are taking place? What equipment is in use? What materials are being handled?
These details are far more predictive of loss than a high-level classification.
They tell you where fire load increases, where equipment failure could interrupt operations, and where third-party or worker injury exposure is more likely.
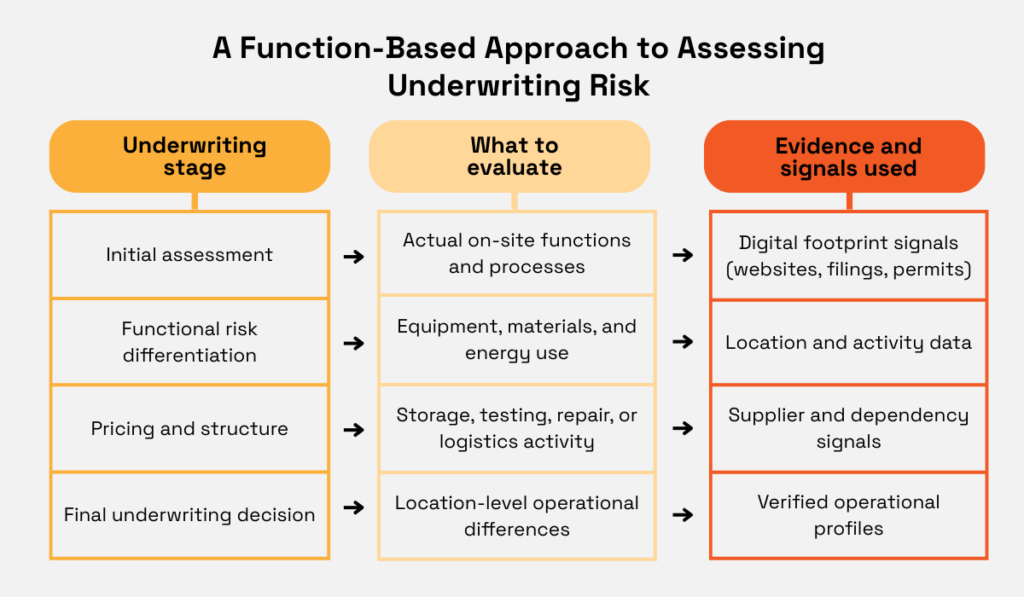
Source: Veridion
Once a mismatch between the stated code and the actual function shows up, the response should be deliberate.
This is the point to reassess pricing and structure.
Premiums, coverage limits, deductibles, exclusions, and business interruption assumptions may all need adjustment to reflect how the site truly operates.
When underwriting follows function rather than labels, coverage decisions become more accurate, and pricing becomes easier to defend.
Industry codes still matter, but they should never be the last word.
When you look at how a business actually operates, who it depends on, and how activity differs across locations, the risk picture becomes far clearer.
This shift from labels to evidence helps you avoid surprises at claim time and price coverage with greater confidence.
As operations continue to evolve faster than classification systems, underwriting that stays grounded in real-world signals will be better positioned to protect both the portfolio and the insured.