
Blog
Business Interruption Risk: The Role of Property Function in Insurance
By: Auras Tanase -
02 February 2026


We love our data, and now that you're here, you're one step closer to loving it too.
A wide sample of data, so you can explore what is possible with our data
Choose ->
built with procurement in mind. Focused on manufacturers, products and more
Choose ->
built with insurance in mind. Focused on classifications, business activity tags and more
Choose ->
built with sustainability in mind. Focused on sustainability commitments, and environmental and social governance insights.
Choose ->
built with strategic insights in mind. Focused on market trends, competitor analysis, and industry-specific data
Choose ->

Keep up to date with our technology, what our clients are doing and get interesting monthly market insights.

Key Takeaways:
Business interruption insurance is a core component of commercial property coverage, designed to replace lost income and cover ongoing expenses in case of disruption.
But the extent of losses isn’t driven by damage alone.
The way a property is used and what actually happens inside it often dictates the severity and length of the interruption.
If you want to understand the role of property function in insurance, you’ve come to the right place.
Operational dependencies determine a site’s business interruption exposure, and these dependency structures are closely tied to the specific property function.
Some properties, such as factories or manufacturing plants, rely primarily on internal processes, labor, and supply chains to maintain operations.
Their downtime is often tied to machinery failure, material shortages, or workforce availability.
But these are dependencies that are largely internal and localized.
Others, such as data centers, operate within a more complex ecosystem, where continuity is dictated by three critical external pillars: power, network connectivity, and service providers.
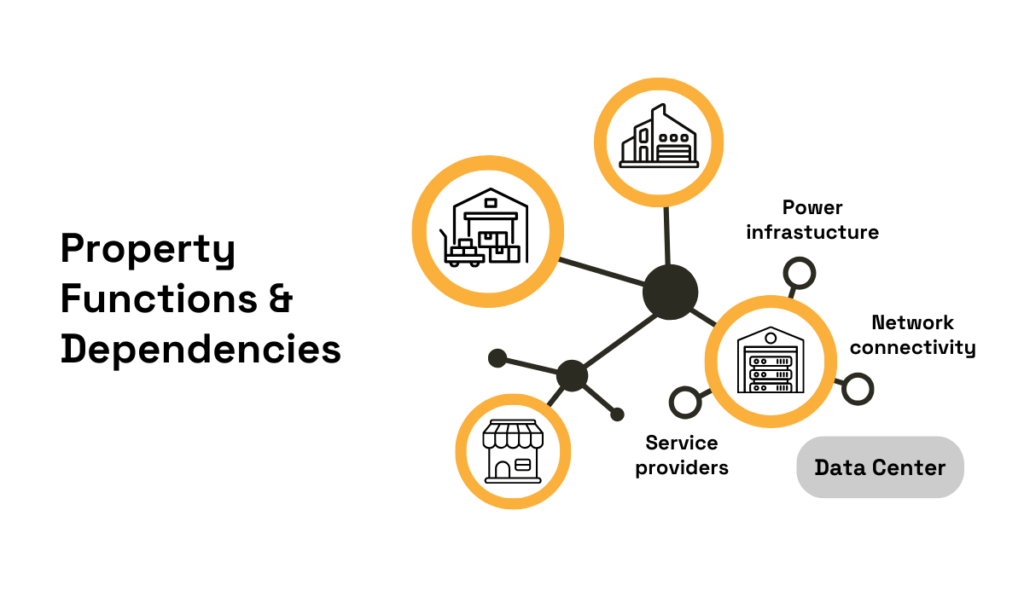
Source: Veridion
Each of these systems must function without interruption, as even brief failures can ripple across multiple tenants and disrupt critical services simultaneously.
Data centers thus provide a clear example of how dependencies influence business interruption risk.
The reliance on external systems makes them particularly sensitive.
Short outages in any one pillar can affect multiple clients, ranging from small enterprises to government agencies, amplifying the potential severity of downtime.
For underwriters, this means that properties with higher third-party reliance generally require more granular evaluation, as their potential BI losses are both larger and more complex to model.
Performance metrics, such as those developed by the Uptime Institute, help quantify this risk.
As you can see below, ratings correlate directly with expected annual downtime: lower-tier facilities may allow up to 28.8 hours per year, while top-tier sites aim for less than 27 minutes.
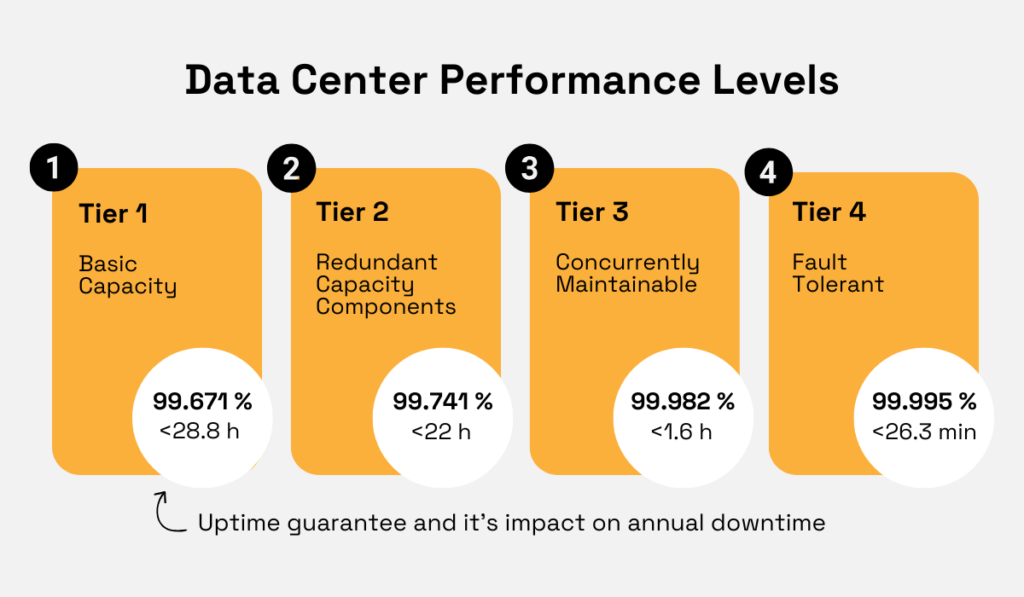
Illustration: Veridion / Data: Uptime Institute
While these benchmarks serve as a baseline indicator of resilience, they don’t capture all sources of interruption.
The physical design, redundancy, and the facility’s geographic location all impact resilience, and in many cases, these dependencies only become glaringly obvious due to external shocks.
One cautionary tale is the 2021 fire at OVHcloud’s Strasbourg data center.
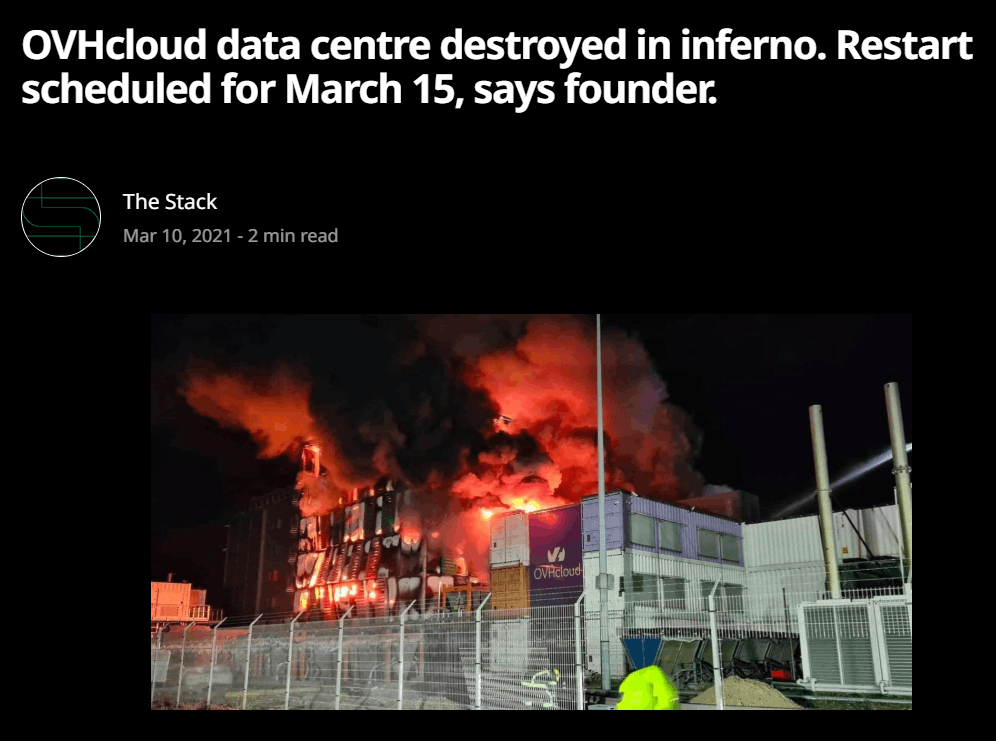
The investigation revealed that the automatic fire suppression and electrical cutoffs failed, which resulted in outages that affected French government websites and numerous commercial clients.
Beyond service disruptions, the incident generated substantial financial liability: over 140 customers filed a class-action lawsuit seeking compensation for losses incurred during the outage.
In other words, even facilities designed with redundancy and robust physical infrastructure can experience significant interruption when multiple external dependencies fail simultaneously.
To address such complex exposures, insurers have introduced specialized policies tailored to high-dependency facilities.
Rick Wong, Head of Insurance at Parametrix, explained that these products cover not only technical failures but also strategic and financial risks associated with service unavailability.
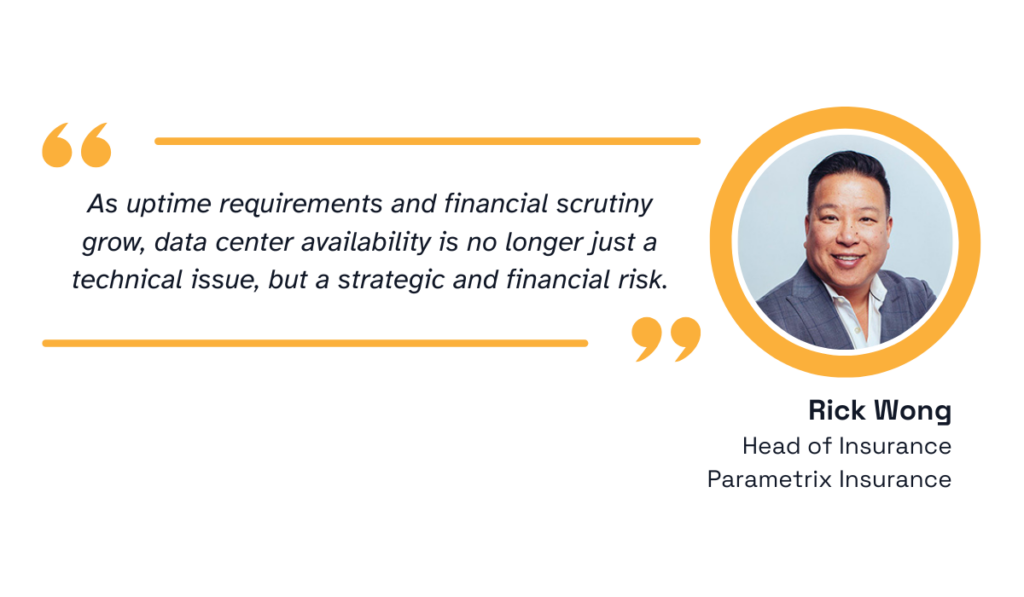
Illustration: Veridion / Quote: Lockton
Modern offerings integrate assessments of both core infrastructure and the broader dependency network, reflecting the operational realities of interdependent properties.
By incorporating SLA-focused coverage and specialized uptime policies, you can align risk assessment and insurance design with the nuanced realities of complex facilities, from baseline operational uptime to multi-tenant dependencies.
Ultimately, understanding the web of dependencies inherent in different property functions allows you to better estimate potential BI severity.
Understanding revenue generation is central to assessing business interruption exposure.
For starters, it’s not enough to classify a property based on broader categories like warehouse, office, retail, or industrial.
The actual function of the space drives the magnitude of risk and the potential financial impact of downtime.
This is why it’s useful to trace patterns by visualizing revenue through the property function.
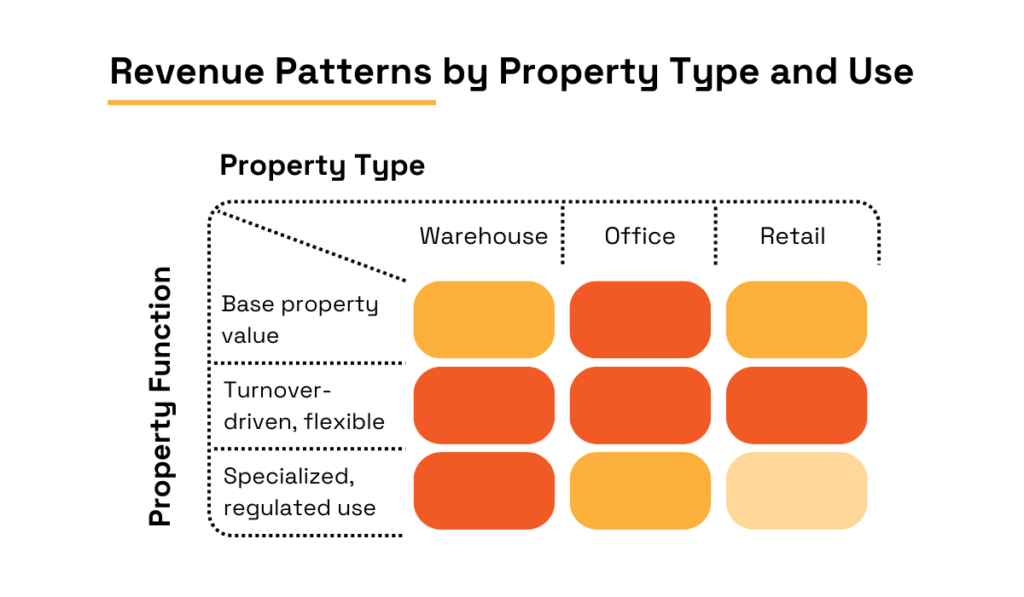
Source: Veridion
Warehouses used for general storage generate stable, occupancy-driven income, while fulfillment or last-mile facilities command premiums tied to speed and turnover.
Moreover, cold or regulated storage attracts higher rates due to compliance and energy costs.
On the other hand, offices and retail spaces vary in terms of location, tenant mix, and foot traffic, whereas industrial sites and data centers typically derive revenue from specialized infrastructure or services.
The operational realities of insurers amplify the importance of this insight.
HFS research reveals high technology and process debt in the insurance industry, with the underwriting aspect alone estimated to yield $28 billion in technology debt and $10.4 billion in process debt.
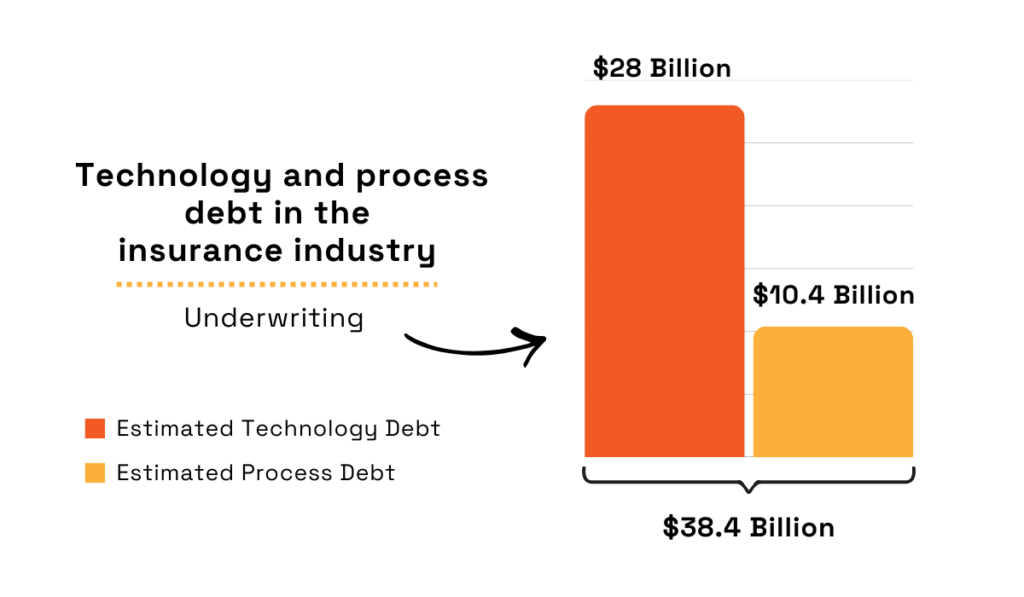
Illustration: Veridion / Data: HFS Research
Just seeing these numbers at a glance makes it clear that outdated systems, fragmented data, and poor visibility into property function affect core operations.
As such, it’s no wonder that over one-third of insurers surveyed by HFS increased their technology spending between 11% and 37% in 2024 alone.
But what sort of technology would benefit underwriting?
You might want to try an AI-powered intelligence platform that provides access to weekly-updated, granular data.
With 134+ million companies mapped across 250 countries, 500 million business locations, and 320 attributes per profile, Veridion’s unprecedented global coverage can aid several commercial insurance use cases.
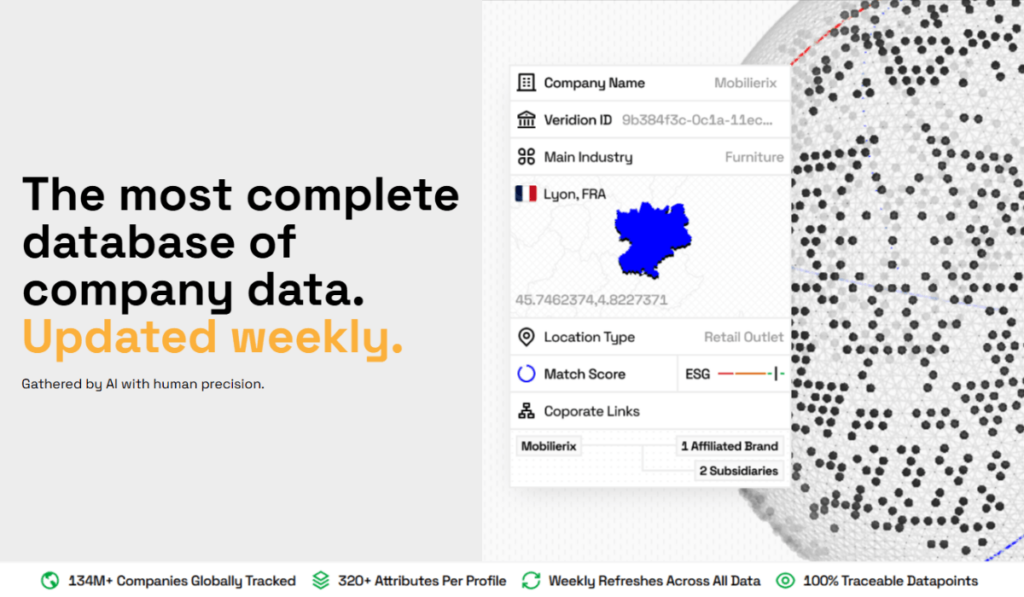
Source: Veridion
What’s more, no tool can measure up to Veridion in terms of delivering verified operational and functional data about a property’s tenants and usage.
This includes site-level financial metrics, co-tenancy information, and physical building attributes, all of which enable underwriters to map functions to potential disruption scenarios more precisely.
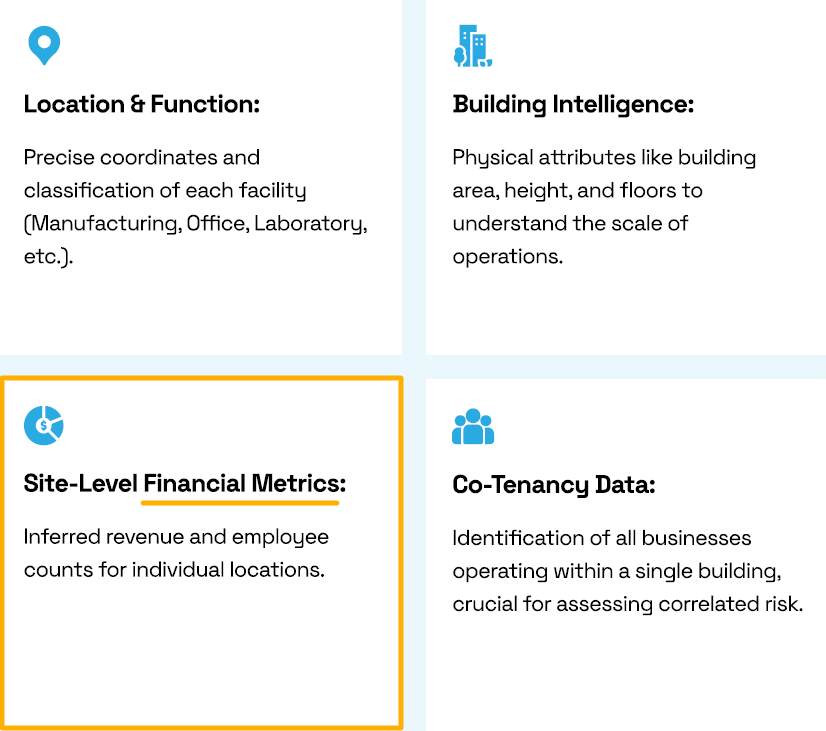
Source: Veridion
So, how could you track revenue patterns in practice?
Let’s zoom in on our recent case study.
Two warehouses of equal size can yield dramatically different revenue depending on whether one is a standard storage facility or a mission-critical R&D hub.
Without dedicated tools, a property generating $19 million in revenue could easily be mistaken for a standard property, a replaceable real estate, or a low-impact logistics node.
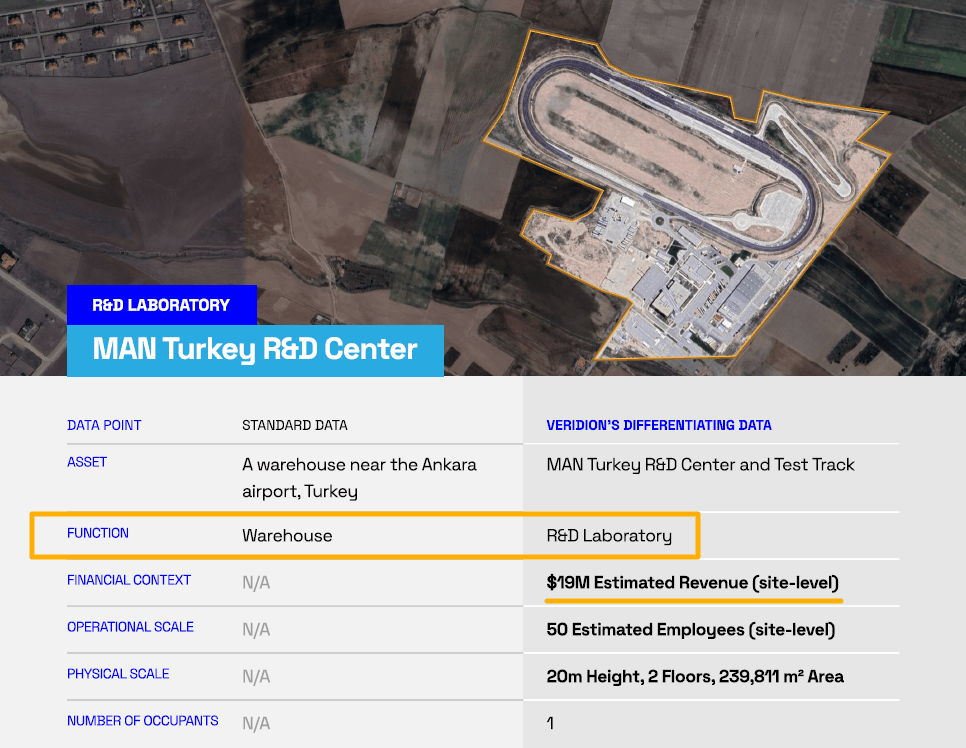
Source: Veridion
Misclassifying it could leave $15–20 million uninsured, but accurate data will directly support your team’s initial assessment and guide the design of specialized coverage.
By mapping function to revenue and disruption potential across your portfolio, you gain a clearer view of where high-value exposure exists.
With the right technology, evaluating these factors is faster and more accurate, allowing underwriting, risk management, and investment decisions to reflect the actual economic reality of each site.
The message is simple: when you understand how a property truly generates revenue, you’re better equipped to prevent costly blind spots and protect both clients and your firm from unexpected losses.
Not all property functions face supply chain risk in the same way.
Facilities that are closely tied to production, fulfillment, or real-time service delivery are inherently more exposed to disruption than those with slower operating cycles or greater substitution flexibility.
Business interruption severity, in turn, depends on how quickly a function feels the impact of upstream or downstream failure.
Recent research suggests this exposure is becoming more pronounced.
PwC’s 2024 study found that 46% of business leaders expect severe supply chain disruptions to become more frequent by 2030.
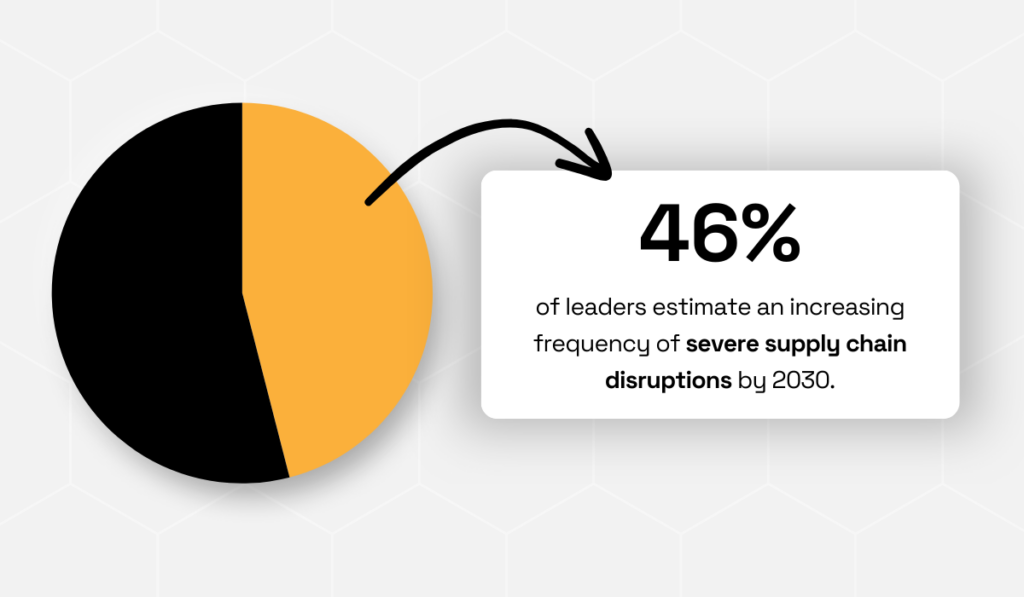
Illustration: Veridion / Data: PwC
At the same time, 41% anticipate that high-impact disruptions will be particularly felt within the next two years.
Crucially, this risk is not evenly distributed across functions.
Manufacturing plants dependent on specialized components, just-in-time delivery, or geopolitically sensitive suppliers face a very different interruption profile than facilities with diversified or localized sourcing.
Honda’s recent shutdown of several sites in China and Japan due to component shortages illustrates this dynamic perfectly.
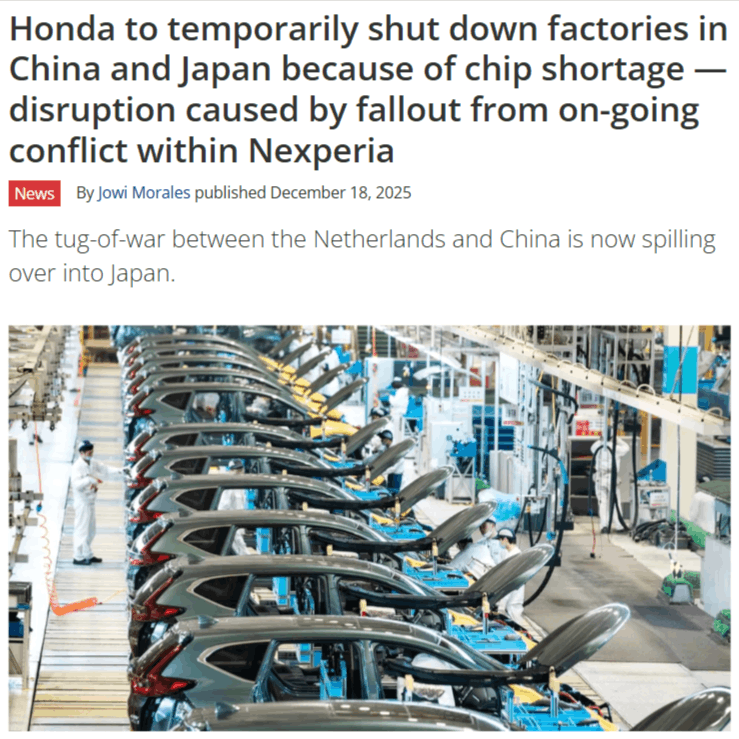
Source: Tom’s Hardware
The disruption that originated from a single upstream node quickly cascaded across multiple facilities, and the operations didn’t resume for several days.
The underlying cause of all this?
Geopolitics.
The Dutch authorities had previously seized Nexperia’s Netherlands-based operations over concerns about illegal technology transfers.
This triggered export restrictions, retaliatory measures, and uncertainty over chip availability, an issue that was already complicated by U.S. trade controls and entity listings.
For automakers, replacing such components is neither quick nor trivial, and even short disruptions can idle high-value facilities for days or weeks.
But physical components are only part of the picture.
Many high-value functions now rely just as heavily on digital supply chains, which translates to a complex ecosystem of third-party platforms and services that underpin daily operations.
As Neta Rozy, Co-founder and Chief Technology Officer at Parametrix, explains:
“Modern businesses are built on third-party solutions, including cloud applications, that make up the digital supply chain. Understanding the availability and vulnerability of each one is a new risk management challenge.”
These dependencies can include payment systems, cloud providers, CRMs, internet connectivity, or digital marketplaces.
But here’s the kicker:
While monitoring tools may alert organizations when a disruption occurs, mitigation options are often limited.
As Rozy points out in the same report, awareness doesn’t restore service, and until the third party is operational again, many users can do little but wait.
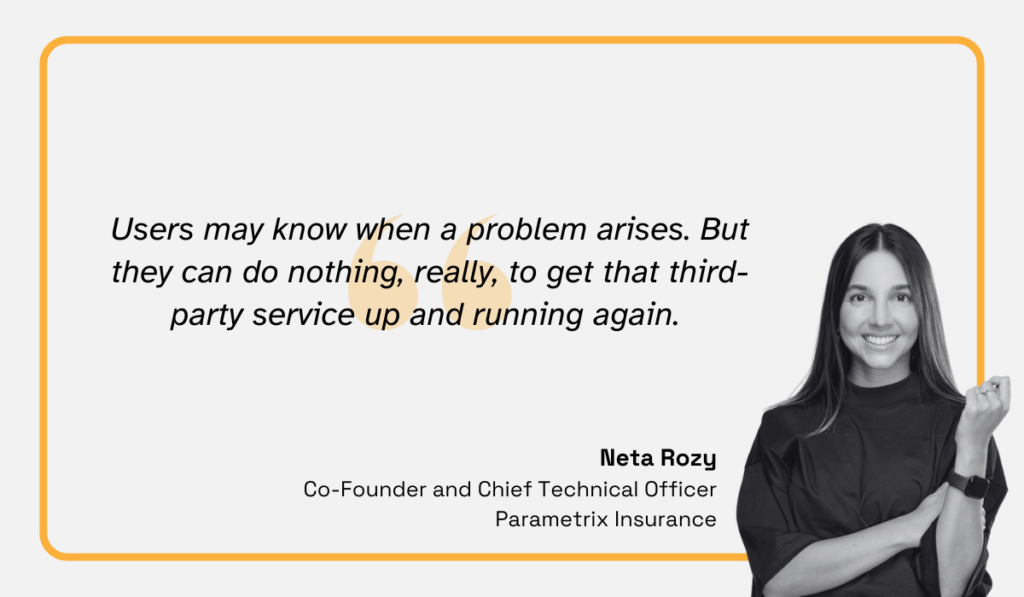
Illustration: Veridion / Quote: Parametrix Insurance
For underwriters, these mounting risks send a clear message: mapping critical digital paths deserves the same rigor as mapping Tier-1 and Tier-2 physical suppliers.
Integrating software supply chain risk into underwriting models is done by:
That way, probable digital downtime can be quantified alongside physical interruption.
To sum up, when you treat digital dependencies as first-class risk drivers, you’re far better positioned to anticipate where the next interruption will actually hit.
For certain property functions, business interruption isn’t governed solely by physical damage or operational fixes.
Regulatory clearance often determines when operations can actually resume, and in heavily regulated sectors, that clearance can take far longer than repairs themselves.
Healthcare facilities, pharmaceutical plants, laboratories, chemical sites, and food manufacturers all operate under standards where even minor deviations can trigger shutdowns.
As John Gray, a university professor and pharmaceutical supply chains consultant, has observed, regulatory slip-ups don’t always stem from negligence.
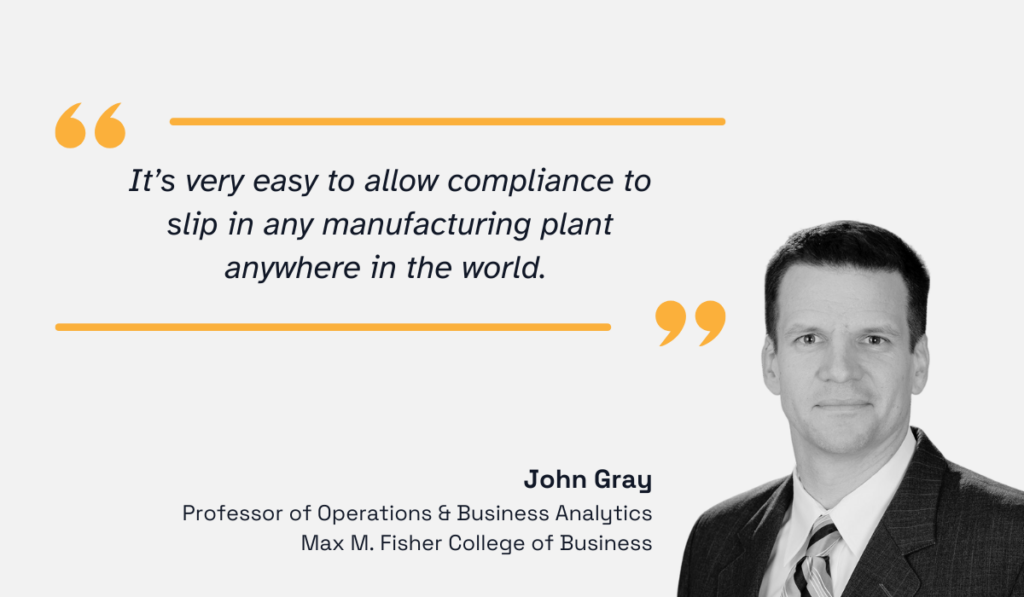
Illustration: Veridion / Quote: Supply Chain Brain
Nevertheless, in regulated environments, every failure can have outsized consequences.
A clear example comes from Teva Pharmaceutical Industries, which temporarily halted drug production at its Irvine, California, facility after an FDA inspection raised sterility concerns.
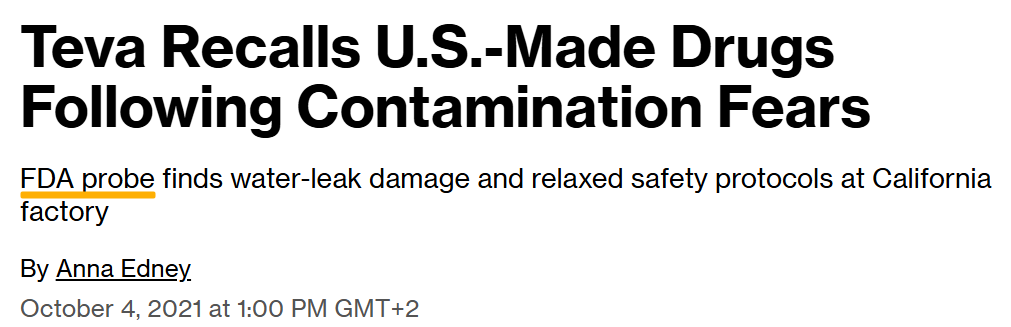
Source: Bloomberg
Inspectors identified water leaks and unrepaired water damage in production areas, indicating increased risk of mold growth and contamination.
They also noted inadequate contamination controls, including poorly maintained changing areas and insufficient procedures to prevent the spread of bacteria during sterility testing.
This meant that operations couldn’t restart without sterility clearance, validated testing, and formal regulatory sign-off.
Teva later confirmed that the facility received an FDA Form 483, a document listing inspection observations that may indicate regulatory violations.
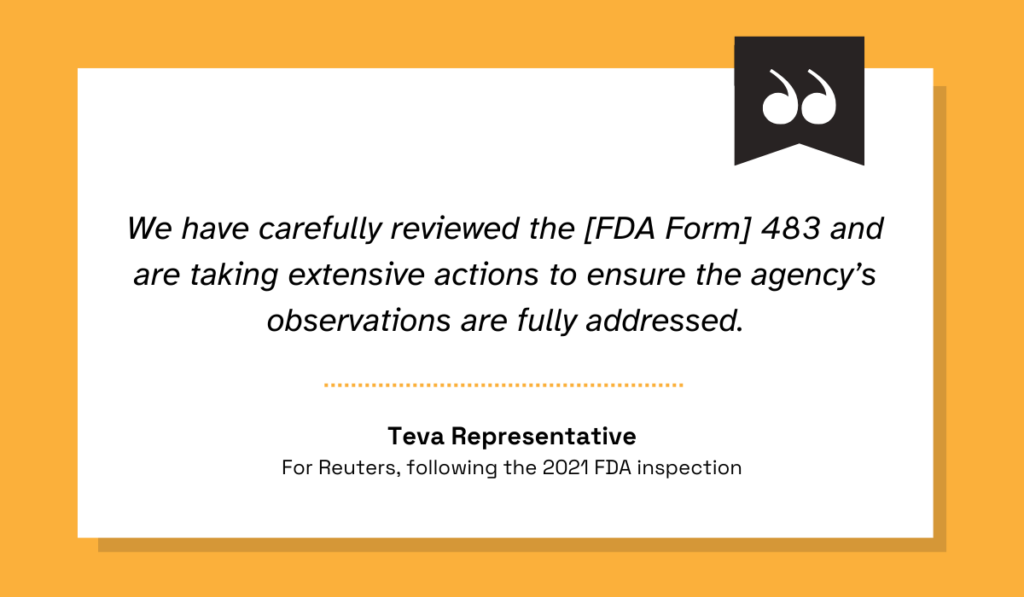
Illustration: Veridion / Quote: Reuters
While Form 483 represents the lowest level of formal warning, unresolved findings can escalate to product seizures, injunctions, or even criminal prosecution.
More importantly for insurers, the clock doesn’t start ticking toward recovery until regulators are satisfied.
Following regulatory-induced shutdowns, authorities typically require a sequence of corrective steps before permitting operations to resume.
These may include re-inspections, certification renewals, environmental or quality testing, and updated licenses or permits.
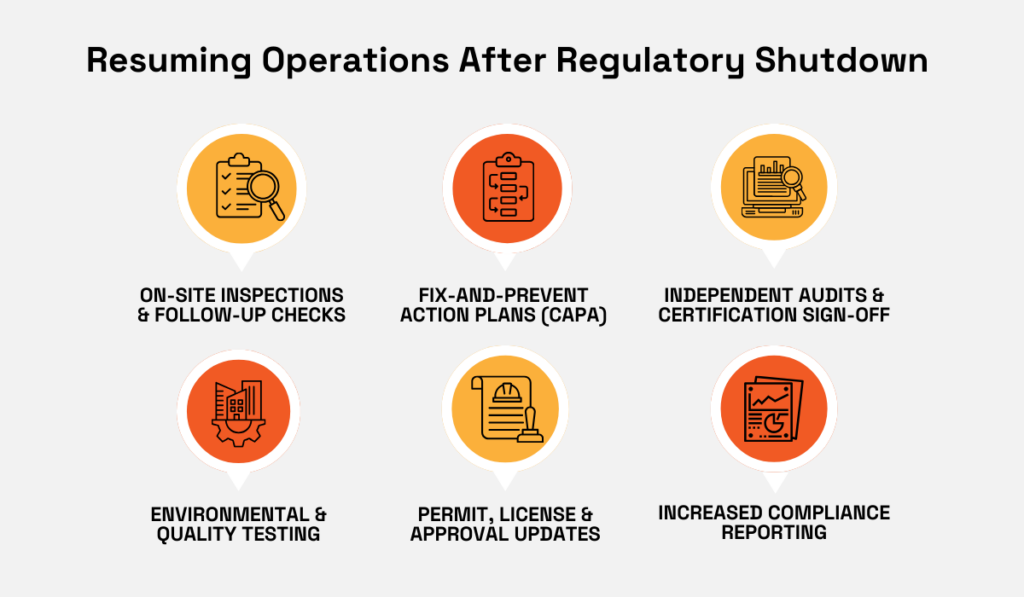
Source: Veridion
Compared to non-regulated functions, these requirements significantly extend downtime.
Two facilities suffering identical physical damage can experience radically different BI durations depending on inspection cycles and approval timelines.
That’s why you should treat regulations as a key time-to-recovery multiplier.
In practice, some sites may already operate under enhanced inspection regimes, conditional licenses, or provisional certifications.
These are all early warning signs that interruption risk could be prolonged if an incident occurs.
Government inspection and enforcement databases make this visibility possible.
For pharmaceuticals, the FDA’s compliance and enforcement database allows you to review inspection histories and individual Form 483s.
Meanwhile, environmental exposure can be assessed through the EPA’s Enforcement and Compliance History Online (ECHO) system, which provides facility-level compliance and enforcement data.
Source: ECHO EPA
When you factor regulatory clearance timelines into BI assumptions, as well as map regulatory exposure by location, you’re far less likely to underestimate downtime.
Remember, neglecting the regulatory aspect will skew your loss estimates, leaving you exposed to the longest, costliest interruptions of all.
Business interruption risk rarely comes from a single failure.
It builds at the intersection of operational dependencies, revenue concentration, supply chain exposure, and regulatory friction.
These are all factors frequently missed by traditional property classifications.
As assets become more specialized and interconnected, BI severity is increasingly shaped by what insurers don’t immediately see.
Improving outcomes means moving beyond static assumptions and toward a dynamic, site-level understanding.
In the end, the firms that adapt fastest will be those that can translate complexity into clarity before disruption strikes.