
Blog
Calculating Potential Revenue Loss at Industrial Sites Beyond Property Value
By: Auras Tanase -
09 January 2026


We love our data, and now that you're here, you're one step closer to loving it too.
A wide sample of data, so you can explore what is possible with our data
Choose ->
built with procurement in mind. Focused on manufacturers, products and more
Choose ->
built with insurance in mind. Focused on classifications, business activity tags and more
Choose ->
built with sustainability in mind. Focused on sustainability commitments, and environmental and social governance insights.
Choose ->
built with strategic insights in mind. Focused on market trends, competitor analysis, and industry-specific data
Choose ->

Keep up to date with our technology, what our clients are doing and get interesting monthly market insights.

Key Takeaways:
As an investor, you already know that property value alone doesn’t provide a complete picture of losses if an industrial site goes down.
That’s why, in this article, we highlight what else to consider when calculating potential profit losses, along with where to find this kind of data and the tools that can help.
Ready to finally gain a fuller understanding of financial risk and return?
Here’s how.
First, it’s important to identify all the ways a disruption could affect a site’s revenue.
If you don’t know how or what can be affected, you can’t model risk accurately or uncover hidden dependencies, which often leads to underestimating potential losses.
Natural disasters are a good example.
Many still downplay their impact during risk assessments, even though that impact can be significant.
Josh Gilbert, CEO & Co-Founder of Sust Global, a company that provides geospatial climate and physical risk analytics for investors and corporations, notes:
Illustration: Veridion / Quote: Environmental Finance
But it’s not just natural disasters.
Risk in general is becoming more frequent and severe, affecting companies all over the world.
A World Economic Forum survey confirmed this when they asked companies to identify the risk most likely to trigger a material global crisis.
The increased cynicism among survey respondents was reflected in their responses, which ranged greatly, from armed conflict and societal polarization to extreme weather events.
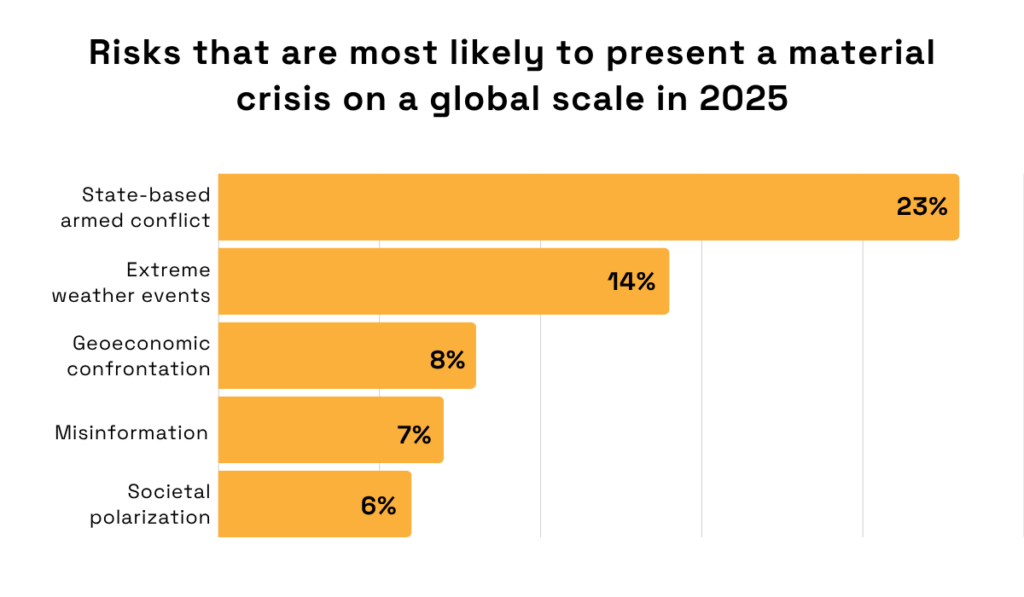
Illustration: Veridion / Data: World Economic Forum
This is why mapping risk sources is so critical.
It gives you a clear overview of everything that could harm an industrial site in this increasingly volatile era, allowing you to calculate potential losses more accurately.
Begin by assessing internal sources of risk.
Those originate within the organization and are generally under management’s control.
They include:
| Operational Risks | Equipment failure or breakdowns, process inefficiencies, inventory mismanagement |
| Safety and Health Risks | Poor adherence to safety protocols, leading to accidents or injuries |
| Financial Risks | Mismanagement of budgets or cash flow, fraud, or embezzlement |
| Cyber and IT Risks | System failures or downtime, cyberattacks |
Next, examine external sources of risk.
They originate outside the organization and often beyond direct control:
| Market and Economic Risks | Fluctuations in demand, price volatility in raw materials or energy, inflation, or currency issues |
| Environmental Risks | Natural disasters, environmental regulations |
| Political and Regulatory Risks | Changes in tax laws, tariffs, labor laws, or geopolitical instability |
| Supply Chain Risks | Supplier failure or delays, logistics disruptions |
| Social and Reputation Risks | Labor strikes or protests, negative publicity |
Some of this information will be available in the company’s public reports, such as, for example, disclosures on risks, sustainability performance, or safety data.
For everything else, you’ll need to monitor external signals that may reveal internal vulnerabilities.
Keep an eye on news sources, trade publications, press releases, industry benchmarks, regulatory and compliance databases, and any other channels relevant to the site or industry.
Now, translate these potential disruptions into estimated lost revenue or profit directly tied to site operations.
Direct losses are typically the easiest to calculate and provide a baseline for total potential revenue loss.
They are also often the largest component.
Virve Viitanen, Global Lead for Secondary Switchgear at ABB, a technology leader in electrification and automation, provides some specific figures:
“[…] in the food and beverage sector, for example, downtime can cost from between US$4,000 and US$30,000 per hour […] Paper producers, meanwhile, lose up to US$25,000 every hour […], with the steel industry averaging around US$300,000 in losses per critical machine failure.”
Clearly, a lot is at stake, which is why you need to approach this step carefully.
There are three components to incorporate into your calculations:
Start by estimating how long the disruption could last.
Use historical data, industry benchmarks, or scenario modeling to determine potential disruption durations for different types of incidents.
After all, there’s a big difference between a stoppage caused by a single broken machine that can be repaired and a disruption caused by a key supplier going bankrupt and halting deliveries.
Next, calculate potential revenue at risk by multiplying expected downtime by the revenue generated per time period for the affected operations.
Be sure to adjust for variable costs saved during this period, such as unused materials or reduced energy consumption.
Finally, identify any additional expenses incurred during the restoration period.
These are costs required to minimize or avoid suspension of business activities, whether to continue operating at the original location or at a temporary or replacement site.
Keep in mind that you can also supplement your own calculations with industry reports, like the one from ABB that shows plants typically lose an average of US$125,000 per hour of downtime.
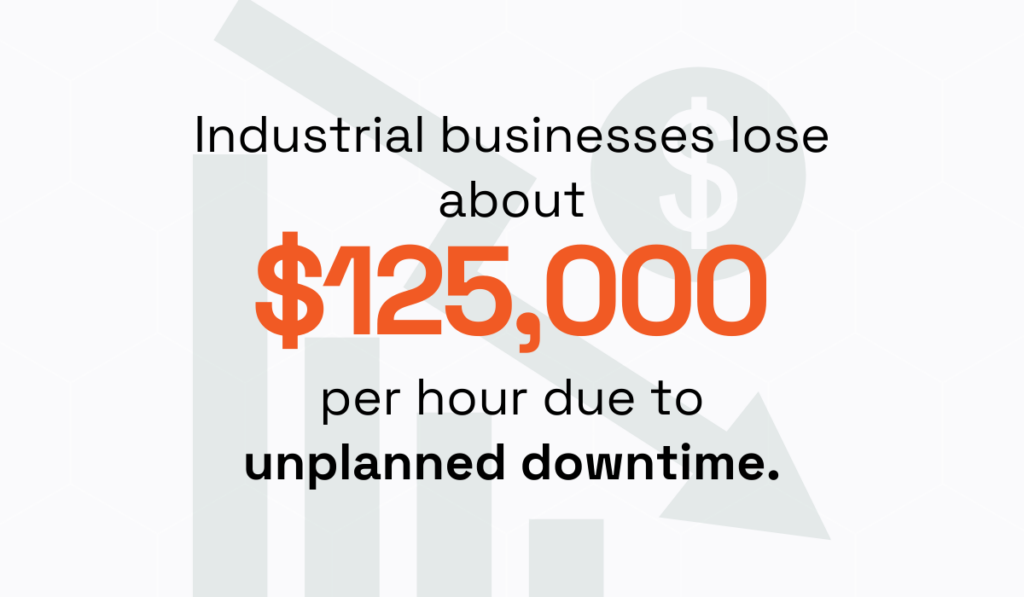
Illustration: Veridion / Data: ABB
Using real-world figures like these will provide context and help ensure your estimates are more reliable and grounded in actual historical data.
Unfortunately, revenue loss rarely stops at direct costs.
In industrial businesses, disruption typically creates a ripple effect, harming multiple areas of operations simultaneously.
Virve Viitanen explains:
“On top of the obvious direct financial costs, downtime also presents businesses with several indirect costs, like reputational damage, health and safety risks, loss of team morale, and insurance premium rises.”
Today, when social media reigns, reputational damage can be especially severe.
One misstep can reach millions of people in moments, damaging a brand, sometimes irreparably.
Carol Fox, former VP of Strategic Initiatives at Risk and Insurance Management Society, Inc. (RIMS), agrees:
Illustration: Veridion / Quote: Risk & Insurance
That’s why you need to factor these considerations into your calculations. Ignoring them underestimates risk and can only mislead you.
Think through potential impacts such as the following:
| Contract penalties | Missed delivery deadlines or service-level agreements can trigger fines or lost revenue |
| Customer churn or reputational damage | Delays or interruptions may reduce future revenue and hurt brand perception |
| Downstream production impact | Facilities or divisions relying on the affected site may also experience reduced output |
| Regulatory consequences | Some disruptions can result in fines or operational restrictions |
Now, it’s important to note that you’ll be mostly using your subjective judgment when assessing indirect impacts.
After all, these costs are less tangible than direct ones, making them more difficult to quantify.
So, to cover all bases, consider using scenario analysis.
Instead of assuming a single outcome, model multiple “what-if” cases to evaluate risk under different conditions.
Typically, best-case, worst-case, and most likely cases are calculated here.
However, Bojan Radojicic, Founding Partner and Finance and Business Advisor at the advisory WTS Tax & Finance, notes there are many ways you can go about scenario analysis:
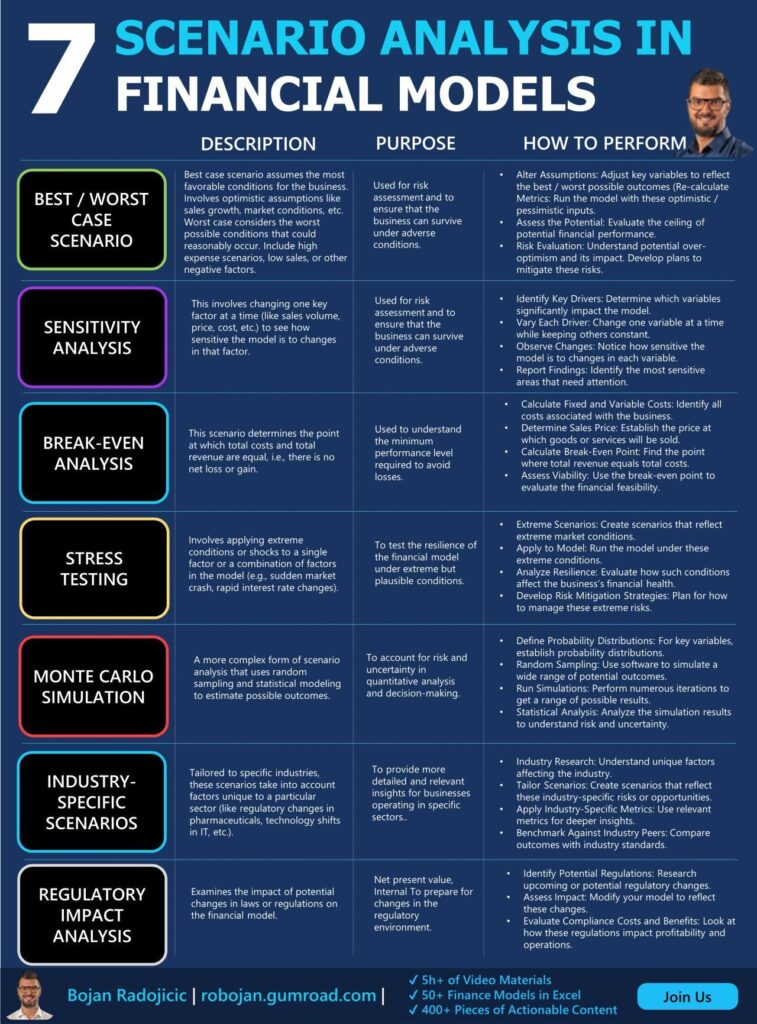
Source: LinkedIn
In the end, while indirect impacts are never 100% straightforward, this type of analysis provides a clearer overall picture and improves decision-making. It’s best not to overlook it.
Sometimes, disruptions cause enormous revenue losses. Sometimes, they cause none at all.
What makes the difference?
Business resilience.
Companies that plan for disruption and have clearly defined measures to mitigate risk are generally better at overcoming challenges and reducing their impact.
John Verdi, Sr. Director of Professional Services at Riskonnect, an integrated risk management software solution provider, puts it perfectly:
Illustration: Veridion / Quote: BCI
It’s what allows companies to withstand, adapt to, and recover from inevitable disruptions, ensuring continuity and long-term viability.
Therefore, be sure to add resilience factors into your evaluations.
Just keep in mind these measures can take many forms, for instance:
| Operational Redundancy | Backup facilities, duplicated equipment, or alternative production lines |
| Inventory or Stock Buffers | Extra inventory to absorb short-term production interruptions |
| Supply Chain Flexibility | Multiple sources for key materials or components |
| Insurance Coverage | Business interruption or property insurance to compensate for lost revenue and extra costs |
| IT Systems and Disaster Recovery Plans | Backup servers, cloud systems, and disaster recovery procedures to reduce downtime and operational loss |
This kind of information is often detailed in a company’s business continuity (BC) or disaster recovery (DR) plans, typically available on their websites.
Companies with robust continuity plans usually highlight them publicly.
Take, for instance, SMC, a manufacturer of automatic control equipment.
Their BC plan is readily available online, categorizing risks into internal, external, and natural threats and clearly outlining corresponding response efforts.
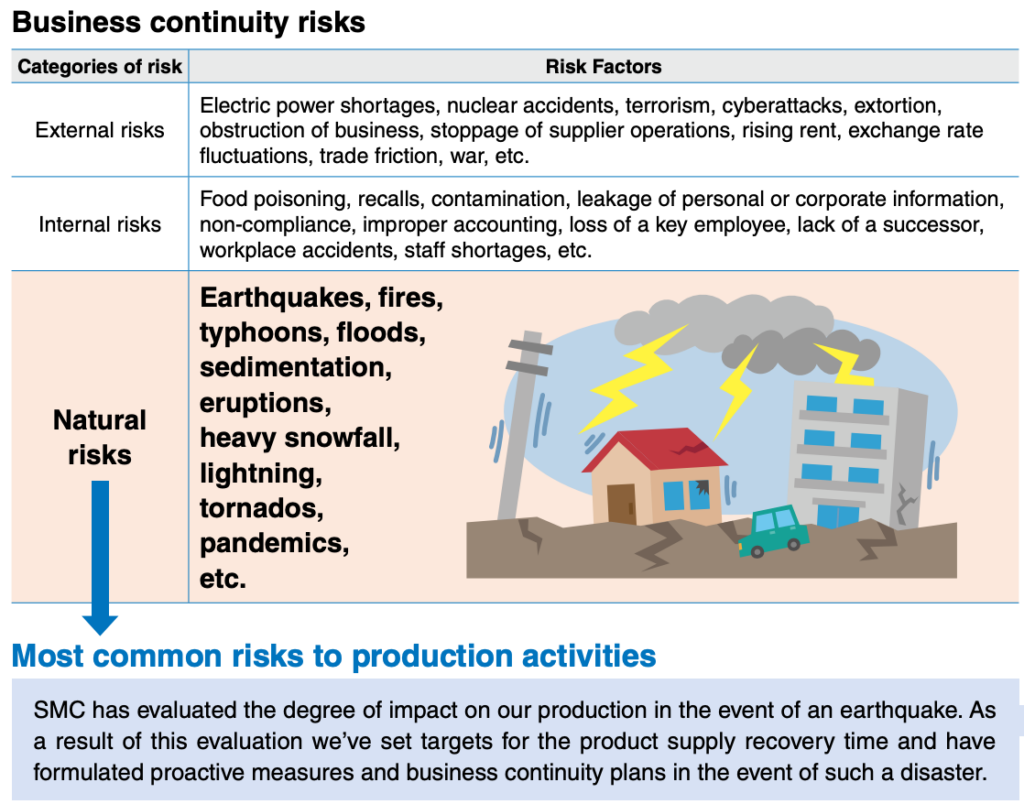
Source: SMC
They even provide a concrete example of how the plan was implemented during a crisis and how it helped:
“The Kamaishi area experienced three magnitude 7 earthquakes […] countermeasures were implemented, problems corrected, and disaster prevention training was completed […] Production resumed 8 days after the quake.”
This data is gold.
It enables you to more accurately quantify the impact of various resilience measures on the potential revenue loss.
Therefore, if a company you’re evaluating provides such a document, review it carefully and factor your findings into your calculations.
If not, don’t hesitate to reach out to them directly and ask about their risk mitigation strategies.
Without proper data validation, this entire process often becomes mere speculation and guesswork.
That’s where tools like Veridion come in, offering AI-powered business and firmographic data to make your risk assessments truly data-driven.
Here’s a brief overview of our data universe:
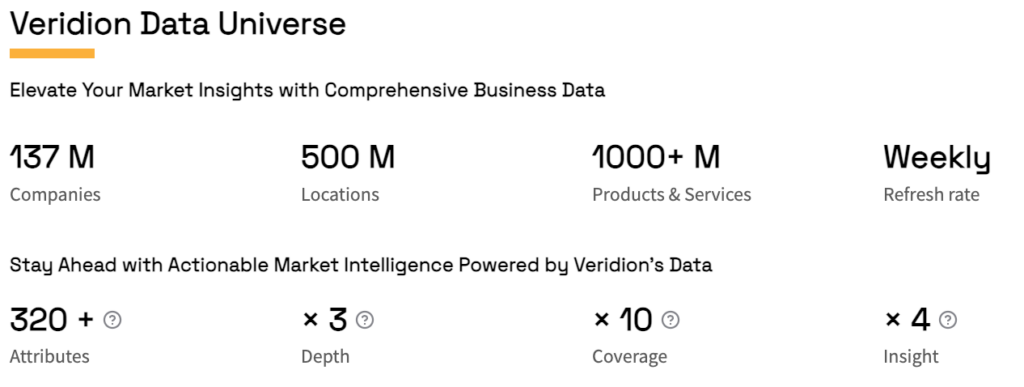
Source: Veridion
Veridion combines official business registry data with unstructured digital signals from websites, news, corporate filings, job postings, and more.
That’s what enables us to provide a truly comprehensive, timely view of a company’s entire operational footprint, including millions of active business locations that traditional databases often miss.
So, what does all of this mean for you?
It allows you to monitor risk and resilience factors across nearly every aspect of a site’s operations, including:
| FOCI | Identify risks related to foreign ownership and influence to ensure compliance and avoid geopolitical threats |
| Regional | Analyze the geographical distribution of companies to spot risks like political instability, sanctions, or environmental challenges |
| Operations | Assess operational stability by examining worker safety, labor law compliance, and other operational factors |
| Supply Chains | Trace dependencies and evaluate the potential impact of supply chain disruptions |
| Financial Health | Monitor companies’ financial stability to avoid exposure to financial disruption |
| Product | Understand the risks associated with the products and services companies offer |
| ESG | Evaluate environmental, social, and governance practices to ensure alignment with regulatory standards |
In short, Veridion integrates verified operational, financial, and asset-level data to model site-specific revenue exposure.
Linking physical hazards and operational risks to actual revenue streams allows you to accurately quantify potential losses, supporting more precise, risk-adjusted valuations and investment decisions.
Everyone knows that each investment carries some level of risk.
But does that mean you should simply accept it without taking action?
Absolutely not.
By regularly reviewing your portfolio and calculating potential losses based on the latest data, you can effectively rebalance your investments to align with your risk tolerance and goals.
So, invest in reliable data, stay informed, and monitor potential risks to adjust your strategies as needed.
Being proactive is the best way to reduce damage down the line.