
Blog
5 Step Process for Modeling Climate Risk
By: Fortis Agency -
20 March 2026

We love our data, and now that you're here, you're one step closer to loving it too.
A wide sample of data, so you can explore what is possible with our data
Choose ->
built with procurement in mind. Focused on manufacturers, products and more
Choose ->
built with insurance in mind. Focused on classifications, business activity tags and more
Choose ->
built with sustainability in mind. Focused on sustainability commitments, and environmental and social governance insights.
Choose ->
built with strategic insights in mind. Focused on market trends, competitor analysis, and industry-specific data
Choose ->

Keep up to date with our technology, what our clients are doing and get interesting monthly market insights.

Key Takeaways:
Between record-breaking wildfires, billion-dollar storms, rising insurance costs, and tightening regulations, climate became a direct business variable instead of a distant environmental issue.
But how do you actually model climate risk in a way that supports real operational and strategic decisions?
In this article, we’ll walk through a practical five-step process that makes climate risk modeling structured, manageable, and useful, whether you’re assessing facilities, suppliers, or entire global operations.
Before opening a climate model or looking at hazard maps, you need to be very clear about what exactly you are assessing and why.
Climate risk modeling only makes sense in relation to something specific.
It could be a portfolio of real estate assets, a global manufacturing footprint, a logistics network, a lending book, or even a single critical facility.
But without that anchor, the analysis quickly becomes abstract and disconnected from decision-making.
So, the first part of this step is defining the scope:
The answer will change both the complexity of the model and the type of data you’ll need.
Time horizon is just as important.
Short-term climate risk often shows up as extreme weather disruptions, insurance volatility, or operational interruptions.
Over a longer horizon, you start seeing structural shifts such as chronic heat stress, water scarcity, or sea-level rise.
And if you extend the timeline further, transition risks, such as carbon pricing, regulatory tightening, or technology disruption, become more material.
You also need clarity on which types of risk you are including.
Physical risks relate directly to climate hazards like storms, floods, or rising temperatures.
Transition risks, on the other hand, stem from the economic and regulatory transformation associated with moving toward a low-carbon economy.
We will cover that in more detail later, but for now, if you don’t explicitly define whether you are assessing one or both, you risk mixing fundamentally different risk categories into one unclear result.
This step may seem straightforward, but it determines whether your model produces actionable insight or just interesting charts.
After all, climate risk modeling should help you inform capital allocation, supply chain decisions, resilience investments, and long-term strategy.
Being precise about what you’re assessing ensures that every subsequent step is aligned with a real business question.
Once you know what you’re assessing, the next step is identifying what could realistically affect it.
Climate risk drivers fall into two broad categories:
Both can materially impact operations, costs, and long-term viability, and focusing on only one gives you an incomplete picture.
Physical risks are the most visible starting point.
They include acute hazards like floods, storms, wildfires, and heatwaves, as well as slower-moving changes such as rising temperatures, drought, and sea-level rise.
Unfortunately, these risks are more alive and dangerous than ever.
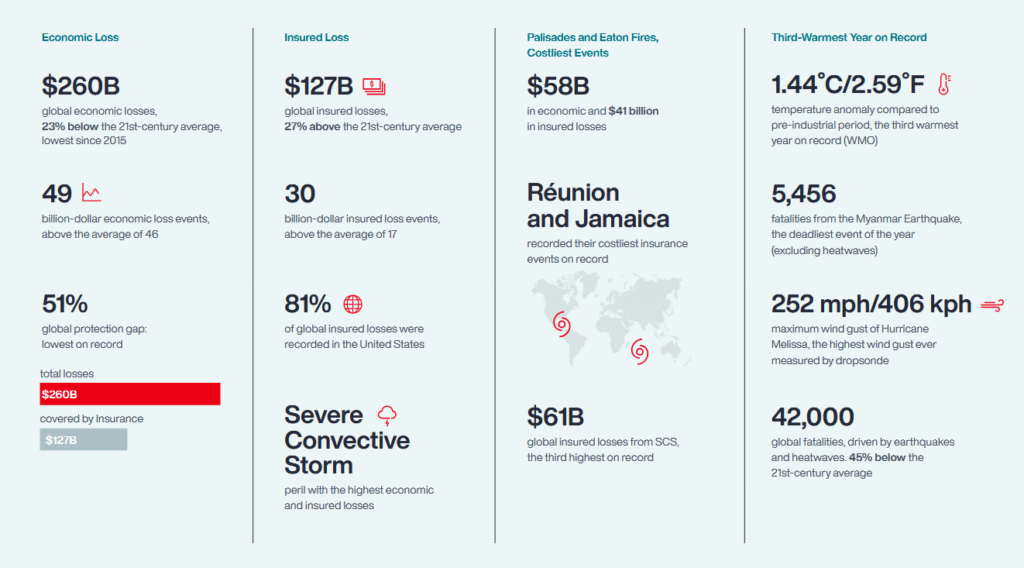
According to Aon’s 2026 Climate and Catastrophe Insight report, severe convective storms caused $61 billion in insured losses globally in 2025 alone—one of the highest totals on record.
Wildfires added another $41 billion in losses, while extreme heat contributed to at least 25,000 fatalities globally.
Source: AON
These events aren’t rare outliers anymore. They are recurring disruptions with measurable financial consequences.
For businesses, the impact shows up in very practical ways: facility damage, supply chain interruptions, logistics delays, higher insurance premiums, and operational downtime.
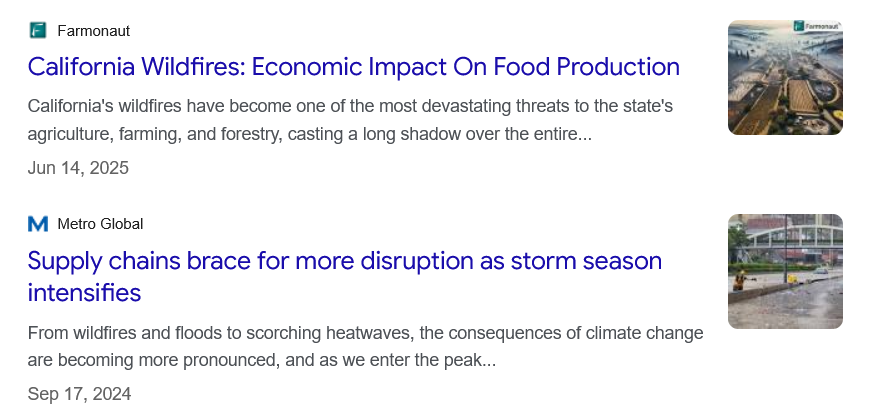
Source: Google
But physical hazards are only part of the picture.
Transition risks driven by the global shift toward a low-carbon economy can be just as disruptive.
They include regulatory changes such as carbon pricing, emissions caps, and mandatory climate disclosures, as well as market and technology shifts.
For example, the European Union is legally committed to reaching climate neutrality by 2050, with binding interim emissions reduction targets.
Policies like these translate into real compliance costs, reporting requirements, and operational adjustments for companies operating in affected regions.
Market dynamics are shifting as well.
In a PwC survey, 76% of consumers said they would stop buying from companies that treat the environment irresponsibly.
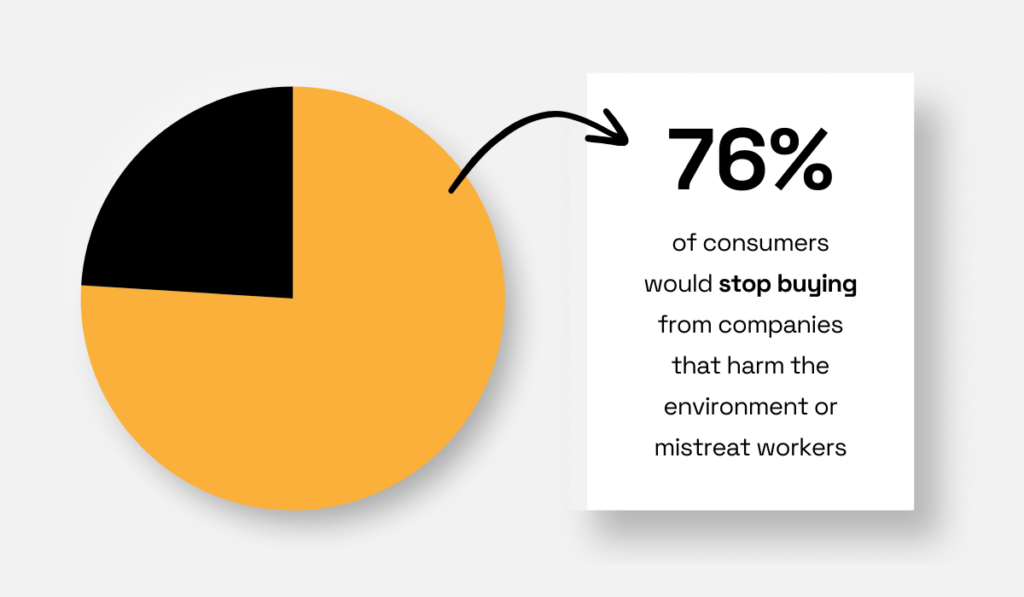
Illustration: Veridion / Data: PwC
That creates direct revenue and reputational risk, particularly for consumer-facing businesses.
Technology adds another layer.
As renewable energy and electrification accelerate, carbon-intensive assets may become more expensive to operate or less competitive over time.
The key here isn’t to list every possible hazard or policy but to identify the specific physical and transition risks most relevant to your assets and locations.
For example:
This is where climate risk modelling moves from general awareness to targeted analysis and sets the stage for the data preparation needed in the next step.
To model climate risk, you have to connect climate projections to real operational data.
In other words, climate risk modeling depends on combining two distinct data layers.
The first layer is climate intelligence, such as:
These datasets indicate how the frequency and severity of floods, storms, heat stress, drought, or wildfire may evolve over time.
The second layer is business-specific intelligence, including:
Climate data alone does not create insight.
A flood projection only becomes meaningful when you know whether a critical manufacturing plant or tier-one supplier sits inside that floodplain.
This integration is often the most technically demanding part of climate modeling.
Many organizations maintain incomplete or aggregated asset records.
Locations may be mapped only at the headquarters level, while disruptions typically occur at manufacturing facilities, contract producers, or logistics nodes.
Supplier networks are frequently opaque beyond the first tier. Without granular and standardized location data, exposure will be underestimated.
So, you have to be very precise here. Each asset must be accurately geocoded, and each supplier relationship must link to a real operational site.
It goes without saying that all data must be cleaned, standardized, and aligned so that hazard projections can be reliably overlaid onto operational footprints.
This is where structured location intelligence becomes critical.
For example, Veridion, our big data platform, provides structured data on more than 130 million companies across over 250 locations worldwide.
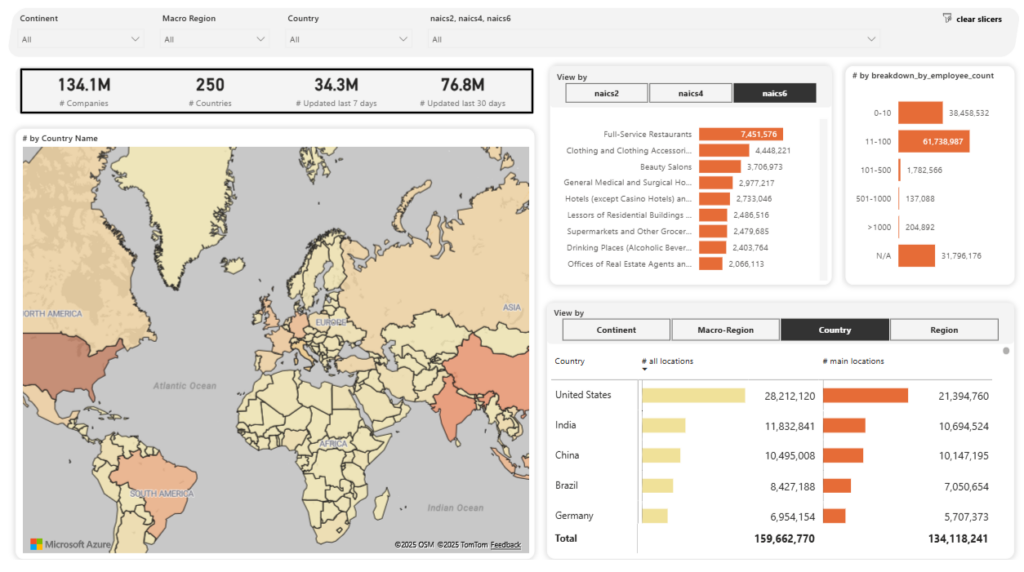
Source: Veridion
Its dataset includes not only headquarters information but also detailed facility-level intelligence, such as manufacturing sites, warehouses, R&D centers, and distribution hubs.
It also delivers over 300 structured company data points, including:
Below is just a small part of Veridion’s ESG insights:
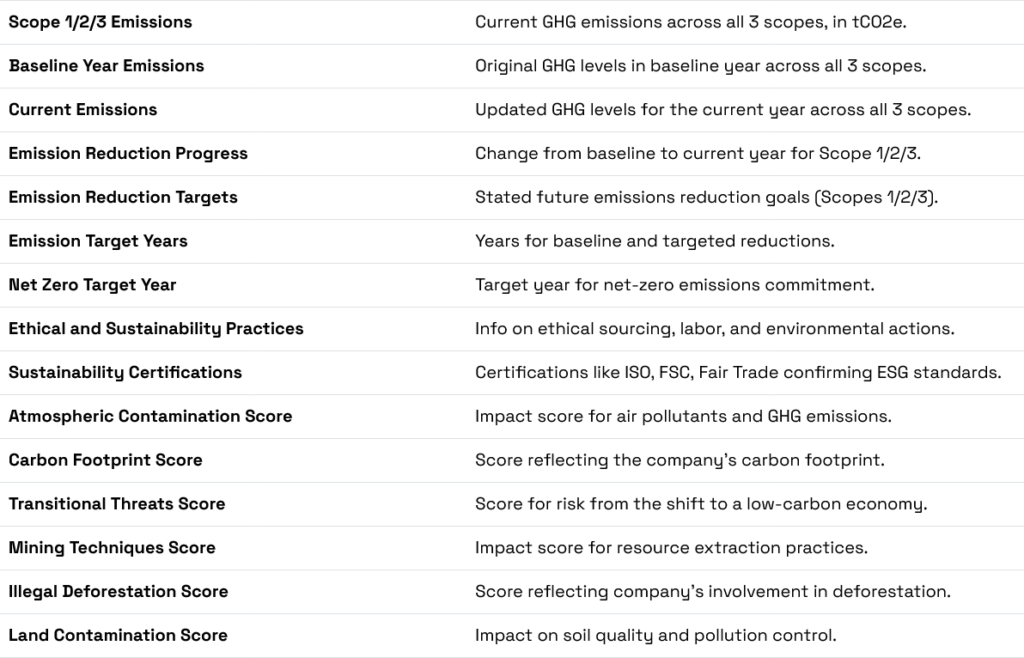
Source: Veridion
By combining granular location intelligence with ESG and operational data, organizations can identify where climate hazards intersect with critical suppliers or revenue-generating assets.
At this stage, the objective is to build a clean, geographically aligned dataset that connects climate hazards to business reality.
Only then can vulnerability be meaningfully assessed.
Once hazards and asset data are aligned, you need to determine how exposed and how vulnerable your operations actually are.
Exposure alone does not equal risk.
A facility can sit in a high-risk zone and still remain operational if it has strong resilience measures. Another facility in a moderate-risk zone may face severe disruption if it lacks redundancy or protection.
Start by measuring direct exposure.
Overlay your asset and supplier locations with hazard maps for storms, floods, heat stress, wildfire, or drought.
Identify which sites fall into high, medium, or low-risk zones under current and forward-looking climate projections.
Next, evaluate sensitivity.
Ask how each exposed site would respond if a disruption occurs:
Then assess adaptive capacity:
This is where vulnerability becomes quantifiable rather than theoretical.
For example, we analyzed more than 67,000 critical supply chain locations across the United Kingdom and overlaid them with storm hazard maps.
The results showed that more than 3,200 key sites sit in high-risk storm zones, representing nearly five percent of essential infrastructure exposed to increasingly severe weather.
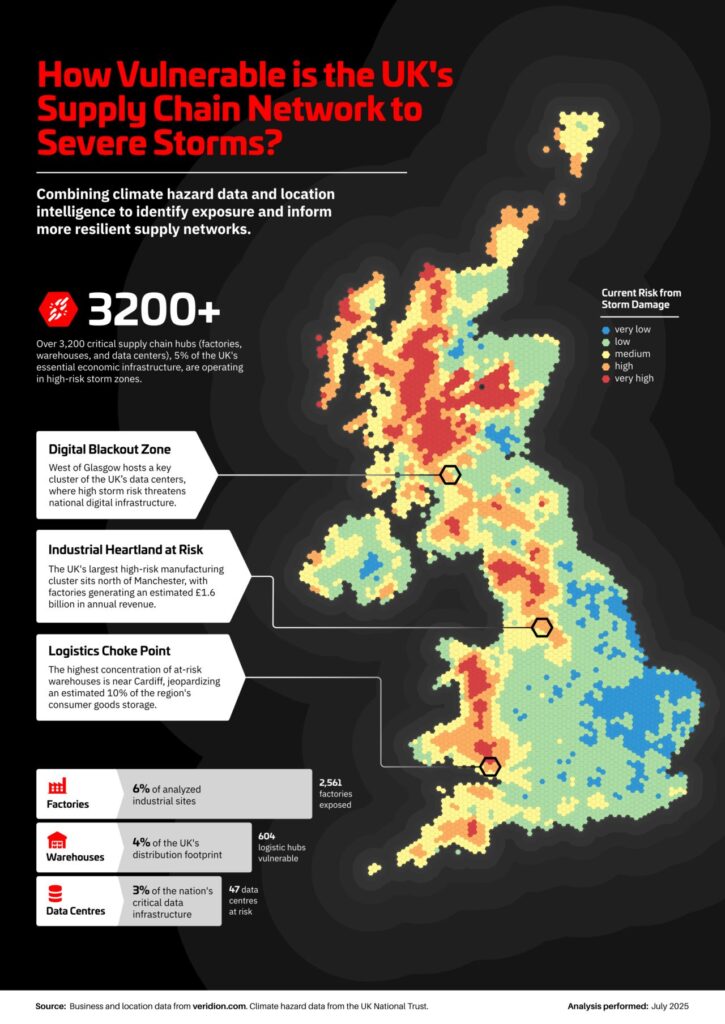
Source: Veridion on LinkedIn
The breakdown revealed concentrated vulnerability.
Over 2,500 factories operate in high-risk zones. More than 600 logistics hubs face elevated exposure. Dozens of data centers sit directly in projected storm paths.
And the concentration was not evenly distributed:
The analysis did not simply identify where storms occur. It showed which specific facilities and sectors could trigger national ripple effects if disrupted.
This type of vulnerability assessment becomes significantly stronger when you combine hazard overlays with structured operational intelligence.
Granular datasets, such as those provided by Veridion, allow you to identify the exact type of facility operating at each location, its industry classification, and its supply chain relationships.
That context helps you move from “a storm may hit this region” to “a critical supplier in this sector may be offline for two weeks.”
The final step is to look forward.
Climate risk modeling should not rely on a single projection. Instead, organizations must evaluate how risks evolve under different climate pathways, regulatory environments, and strategic responses.
Scenario analysis allows decision-makers to stress-test their operations under multiple plausible futures.
On the physical risk side, this means modeling how hazard frequency and severity change under different warming trajectories and time horizons; for example, comparing impacts under a 1.5°C pathway versus a 3°C world.
On the transition risk side, it involves evaluating how carbon pricing, emissions caps, technology shifts, or evolving disclosure requirements could affect operating costs, asset values, and competitiveness.
The results should inform concrete actions:
For instance, PwC supported a global fertilizer company in assessing both physical and transition risks across its global operations.
Their approach included:
The company didn’t just get a risk report. They got a strategic decision tool that informed capital planning and long-term business strategy.
This illustrates the true purpose of scenario modeling.
It is about understanding how different futures could reshape operational risk, cost structures, and strategic positioning.
Climate risk modeling is often perceived as complex and highly technical, but at its core, it follows a structured logic.
You define what you are assessing. You identify the relevant physical and transition risk drivers. You integrate forward-looking climate projections with detailed operational data. You evaluate vulnerability in financial and operational terms.
And finally, you stress-test your organization across multiple future scenarios.
When approached step by step, the process becomes less about abstract climate science and more about disciplined risk management.