
Blog
How to Assess Supply Chain Risk from Co-Located Suppliers
By: Stefan Gergely -
01 March 2026

We love our data, and now that you're here, you're one step closer to loving it too.
A wide sample of data, so you can explore what is possible with our data
Choose ->
built with procurement in mind. Focused on manufacturers, products and more
Choose ->
built with insurance in mind. Focused on classifications, business activity tags and more
Choose ->
built with sustainability in mind. Focused on sustainability commitments, and environmental and social governance insights.
Choose ->
built with strategic insights in mind. Focused on market trends, competitor analysis, and industry-specific data
Choose ->

Keep up to date with our technology, what our clients are doing and get interesting monthly market insights.

Key Takeaways:
If you asked your team where your most important suppliers are located, you would probably get a confident answer.
But there is a critical follow-up question many organizations overlook: are those locations where suppliers are registered, or where they actually operate?
When it comes to co-located supplier risk, that distinction matters.
Suppliers that appear diversified on paper can, in reality, be clustered in the same industrial park, campus, or even building.
This article walks you through a practical process for identifying, assessing, and prioritizing co-location risk before a single local disruption turns into a multi-supplier failure.
Assessing co-location risk starts with an uncomfortable truth: most organizations don’t actually know where their suppliers operate.
At least not in precise, physical terms.
Supplier records usually tell you where a company is registered or headquartered.
What they rarely show is where production, assembly, or storage takes place.
And that gap between a legal address and a real operational footprint is exactly where co-location risk hides.
This lack of visibility isn’t unusual.
Research from McKinsey shows that even direct supplier visibility remains incomplete for many organizations.
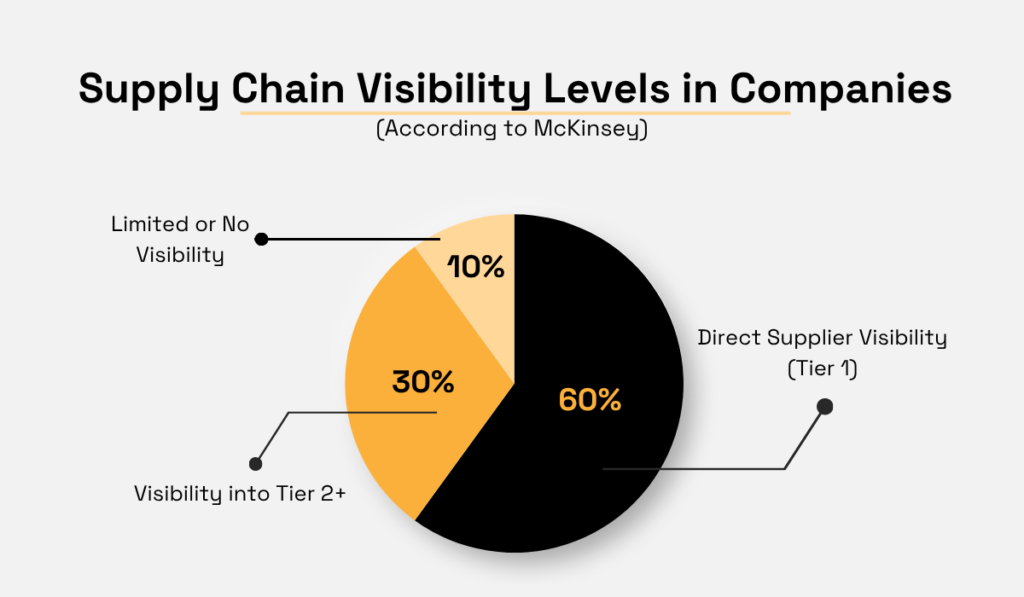
Illustration: Veridion / Data: McKinsey
So if companies struggle to fully map their Tier 1 suppliers, it’s not surprising that site-level concentration often goes unnoticed.
But it shouldn’t.
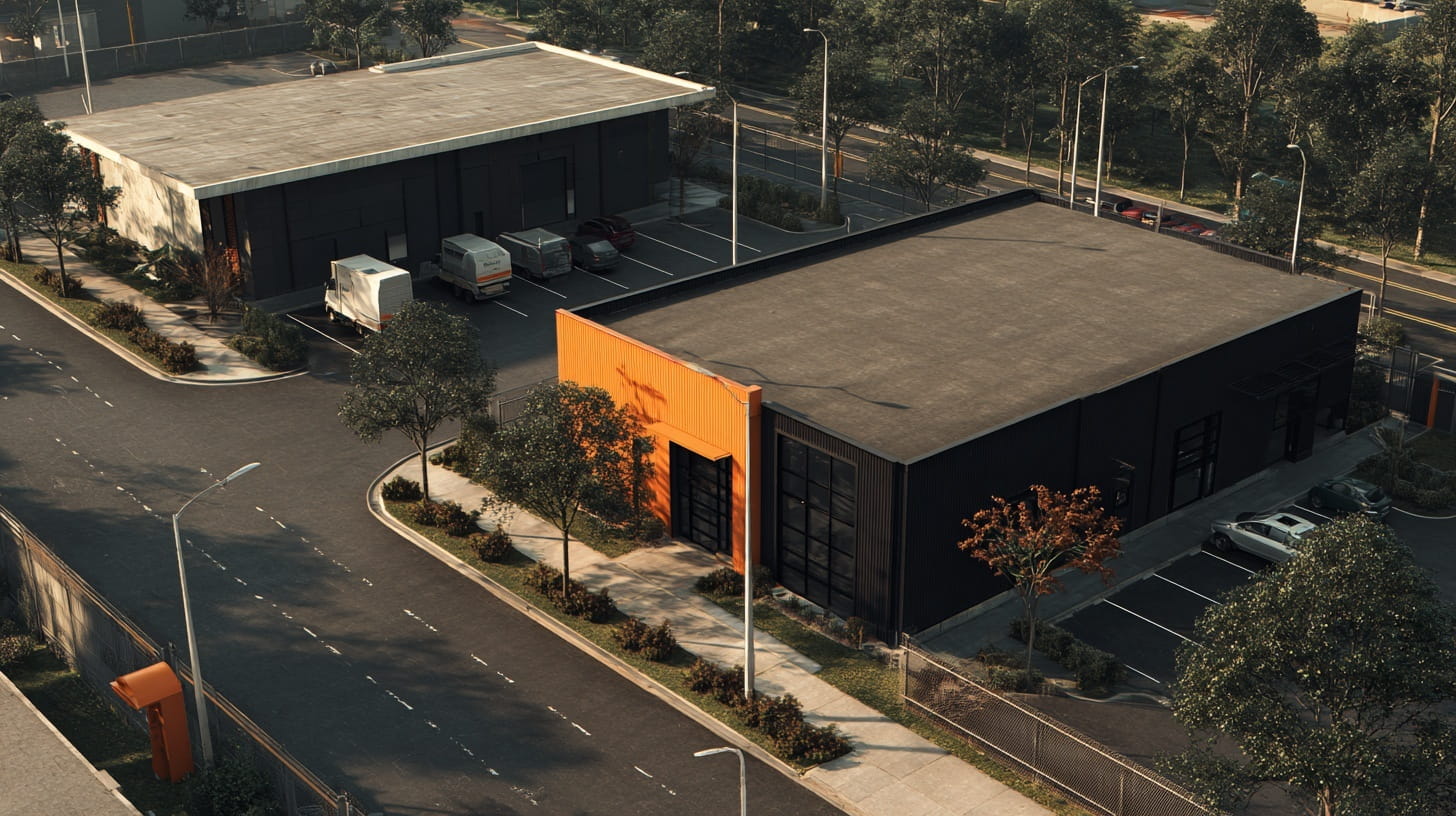
When suppliers are mapped only at the country or city level, they tend to look diversified.
Zoom in, and a different picture often emerges.
Many suppliers operate side by side, in the same industrial park, on the same campus, sometimes even in the same building.
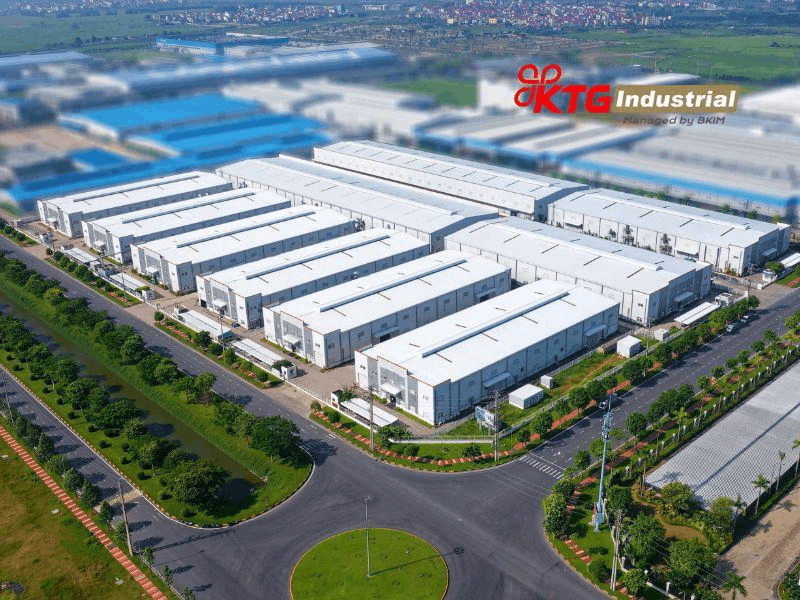
Source: KTG Industrial
From a risk perspective, those suppliers aren’t independent at all. They’re exposed to the same local conditions, the same infrastructure, and the same disruptions.
That’s why, if you want to assess supply chain risk, you first have to map suppliers at the site level, not just the regional one.
You need suppliers’ building-level addresses, precise geospatial coordinates, and clear facility boundaries to understand where they truly overlap.
Once all locations are visualized together, hidden concentrations quickly become obvious, and risks that once looked distributed reveal themselves as tightly clustered.
Of course, knowing where suppliers are is only the starting point.
To understand how vulnerable those clusters really are, you need to look at what those suppliers share next.
Co-located suppliers are often tied together by the same infrastructure:
These shared dependencies are where disruption spreads fastest.
In many industrial parks, infrastructure is designed for efficiency, not redundancy.
Multiple factories may rely on the same electrical substation, gas line, drainage system, or internal road network.
When everything works, this setup keeps costs down.
But when a disruption happens, the impact rarely stays contained within a single facility.
A clear illustration comes from a fire at an industrial park in Malaysia, where a blaze that started in one unit quickly affected several neighboring factories and a warehouse.

Source: The Star
Operations were halted across multiple businesses at once, said Rescue Department Assistant Director (Operations) Ahmad Mukhlis Mokhtar:
“The fire damaged two steel factories, while the others included a food processing factory, a compressor factory and a welding factory.”
What began as a localized incident became a multi-supplier disruption because the infrastructure connecting those sites was shared.
To identify shared infrastructure, look beyond the supplier record and focus on the site itself.
Industrial park and landlord documentation often shows which utilities and services are shared across tenants.
Public satellite imagery and mapping tools can reveal common access roads, gates, or loading zones.
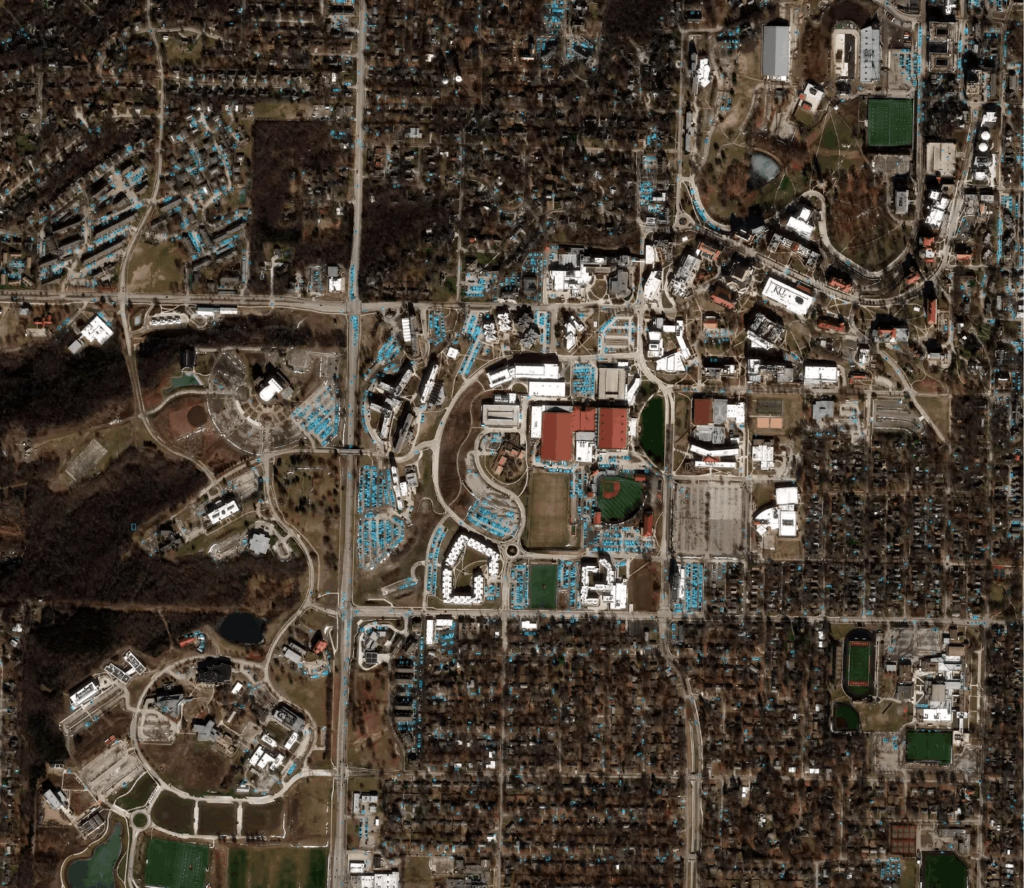
Source: Skyfi
Local utility providers, zoning plans, and municipal records can also indicate whether multiple facilities depend on the same substations, water systems, or transport links.
Once you know which suppliers are tied to the same infrastructure, the next question is which of those dependencies would hurt your business most if they failed.
After you’ve mapped where suppliers operate and what infrastructure they share, you need to think about how important each supplier actually is to your operations.
Why, you ask?
Well, not all co-located suppliers pose the same level of risk. Some may just be inconvenient to lose, while others could bring all your operations to a standstill.
A supplier with long lead times, specialized production capabilities, or regulatory approvals is far more critical than one that can be substituted quickly.
To assess criticality, ask these questions:
Co-location risk becomes especially dangerous when multiple high-criticality suppliers support the same product line or customer segment.
In that situation, a single local disruption can halt operations entirely.
A recent example illustrates why this matters.
A fire at an aluminum supplier’s plant in New York forced Ford to revise its production plans and financial outlook after the site went offline.

Source: Automotive Logistics
The issue wasn’t just the incident itself, but the supplier’s importance and the difficulty of sourcing equivalent material quickly from elsewhere.
When a critical supplier fails, the effects are felt far beyond the immediate site.
Now consider the same situation with co-located suppliers.
If several high-criticality suppliers are clustered in one location and exposed to the same infrastructure or hazards, the impact of a single event multiplies.
And what might have been a manageable disruption becomes a systemic risk.
Besides space, co-located suppliers share exposure.
A flood, fire, earthquake, or storm doesn’t stop at a property line. When it hits, everything in its path feels the impact.
That’s why analyzing co-location risk means thinking in scenarios, not isolated failures.
So how do you actually do this?
Start with the location itself.
Look at each industrial park, cluster, or logistics hub and ask yourself:
By overlaying hazards with supplier locations, you start to see where exposure concentrates.
For example, consider the 2011 floods in Thailand.
Large industrial parks north of Bangkok housed multiple hard disk drive manufacturers and component suppliers.

Source: Forbes
When flooding struck, Hutchinson Technology, a major supplier of HDD suspensions for Western Digital, had to suspend operations even though its plant itself wasn’t flooded.
Nearby suppliers, including ON Semiconductor and Microsemi, also shut down, along with multiple component manufacturers in the same park.
Nidec, producing roughly one-third of global HDD motors, shut down two facilities.
Major manufacturers such as Western Digital, Seagate, and Toshiba faced widespread production constraints.
What made this event so disruptive wasn’t just the flood, but how many critical suppliers were exposed to the same hazard at the same time.
Even facilities that avoided direct damage were taken offline by power outages, evacuation orders, and shared infrastructure failures.
You don’t need a disaster to see the principle in action.
Overlaying hazard maps with thousands of supplier and infrastructure locations often reveals concentrated exposure.
One analysis of UK industrial, logistics, and data center sites found over 3,000 critical facilities in high-risk storm zones.
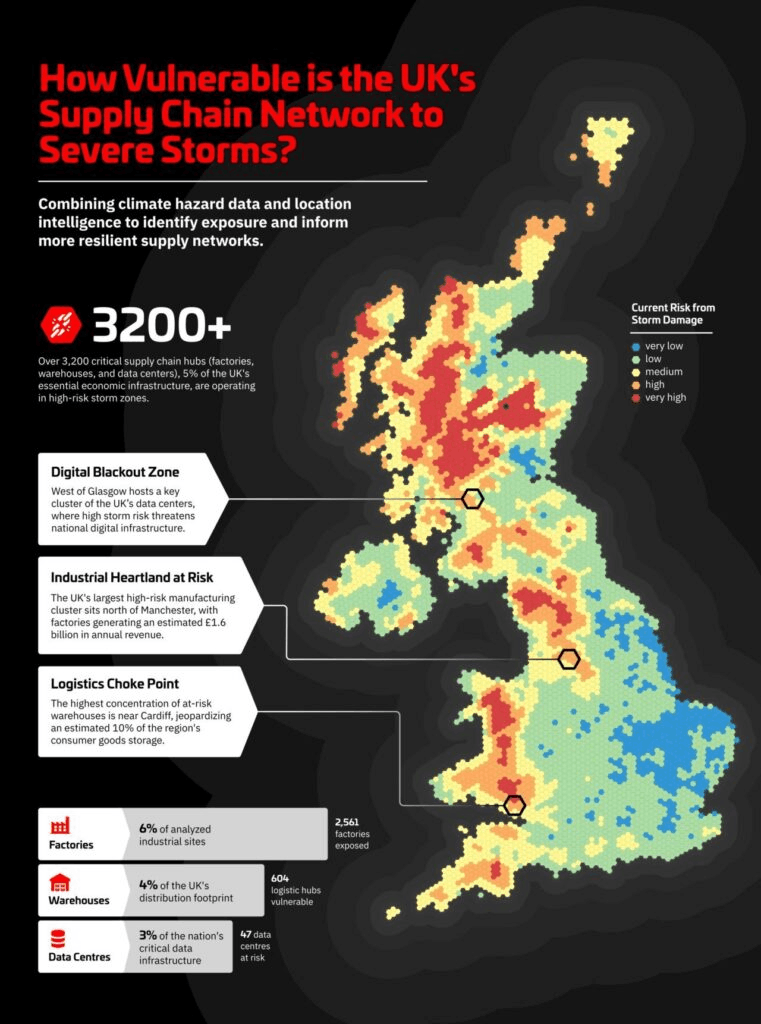
Source: Veridion
Some clusters carried outsized risk: factories along flood-prone rivers, warehouses near wildfire perimeters, and data centers exposed to heat-induced productivity losses.
These “pressure points” show that when one event hits a cluster, the consequences multiply.
The key takeaway for your supply chain?
Look for clusters, not just individual suppliers.
Map hazards against your suppliers’ locations, ask which shared infrastructure or local conditions could knock multiple critical suppliers offline, and identify which ones carry the highest potential impact.
And remember: the point of scenario analysis is not to predict every event.
More importantly, it should help you understand where your supply chain is exposed and stress-test it against realistic, location-specific risks.
Once you see these clusters, you can plan mitigations, such as geographic diversification, backup suppliers, pre-positioned inventory, or alternate logistics routes, with a clear sense of what’s most at risk.
By this point, you know where your suppliers operate, which ones matter most, and which locations are exposed to the same hazards.
The remaining challenge is spotting overlaps that don’t show up clearly in internal systems.
This is where more granular location intelligence becomes useful.
Instead of starting from a supplier list and hoping the data is accurate, you can leverage location intelligence tools.
With a data platform like Veridion, you can look at a supplier’s headquarters or production site and immediately see other companies operating in the same building, industrial park, or surrounding area.
Using proximity-based search, you can identify suppliers that sit next door to each other, share the same access roads, or rely on the same local infrastructure, even if they appear unrelated in your procurement records.
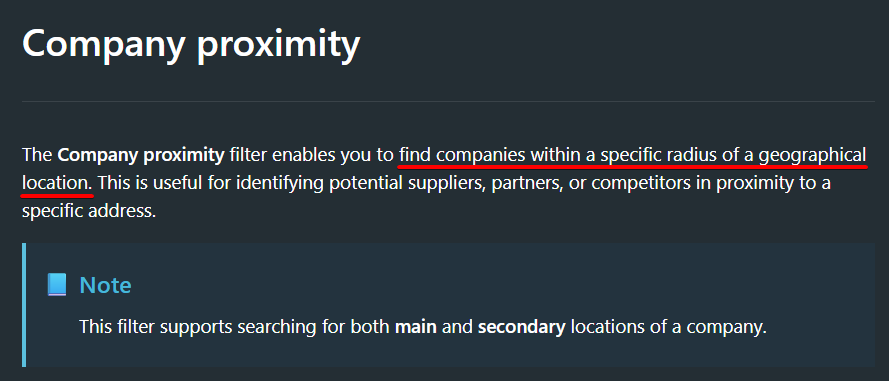
Source: Veridion
What makes this practical at scale is coverage.
Veridion’s database spans more than 120 million companies across over 400 million business locations worldwide, with supplier data sourced from company websites, social platforms, and global news.
Because this data is refreshed weekly, changes to a supplier’s footprint, such as new sites, closures, or relocations, are reflected quickly rather than months later.
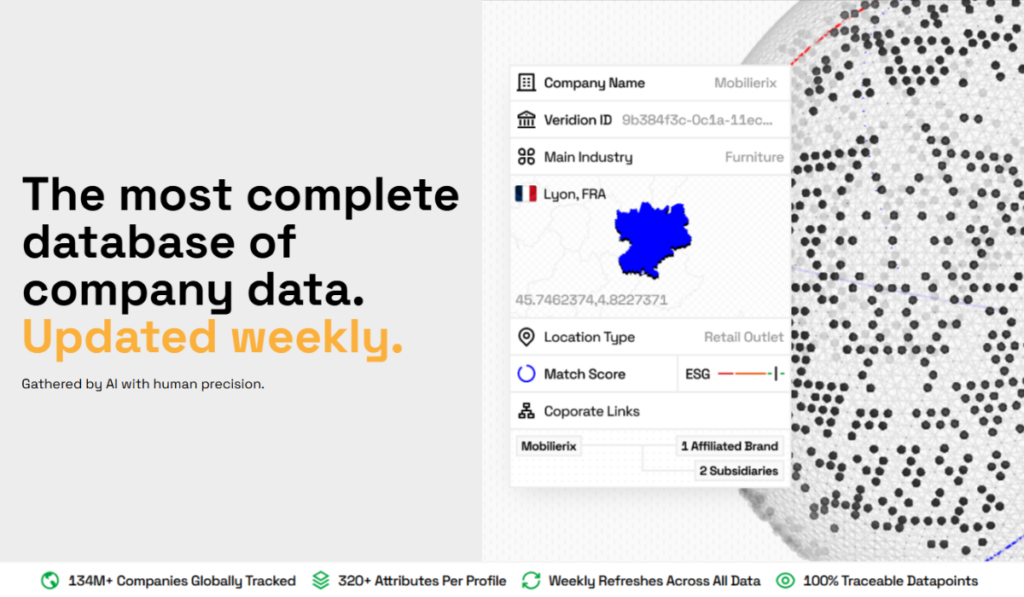
Source: Veridion
On top of that, Veridion distinguishes between different types of sites, so you can see whether a location is a factory, a logistics hub, a data center, or just a registered office with no real activity.
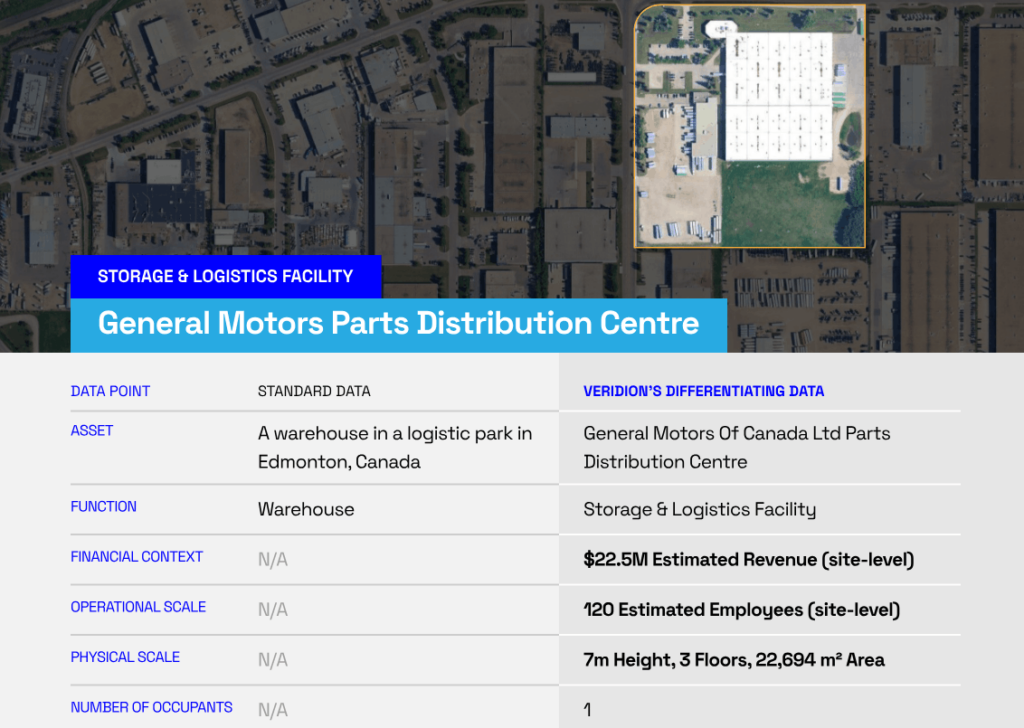
Source: Veridion
You can also tell whether a site is fully operational, inactive, or recently shut down, which matters when you’re assessing real exposure rather than legal presence.
In practical terms, this means you can uncover situations where multiple critical suppliers depend on the same site, landlord, or local infrastructure, even if none of them raised red flags individually.
Those are the overlaps that tend to surface only after a disruption.
Step 5 is about finding them early, while there is still time to act.
Once you’ve identified co-location risks, the final step is translating them into business impact.
This is where risk assessment stops being a mapping exercise and becomes something leadership can actually act on.
As AuditBoard’s Alan Gouveia puts it:
“Risk quantification means putting a number to uncertainty. Instead of describing risks as “high,” “medium,” or “low,” teams estimate potential losses, probabilities, and financial impact in clear, defensible terms — often in dollars. It moves risk management from a matter of gut feel to something you can explain, defend, and act on.”
In practice, this means taking a co-located supplier cluster and walking through a realistic disruption scenario.
Assume the site becomes unavailable for a defined period—for example, three days, one week, or longer—and then quantify what that disruption would mean across the business.
A useful way to do this is to break impact down into a small set of concrete metrics:
| Metric | What to quantify | Why it matters |
|---|---|---|
| Operational downtime | Hours or days of production lost | Shows how quickly losses accumulate once supply is disrupted |
| Revenue at risk | Lost sales per day or per week | Makes exposure visible in financial terms |
| Contractual impact | Penalties, SLA breaches, expediting costs | Often underestimated until after the disruption |
| Customer impact | Orders delayed, customers affected, service levels | Drives reputational and long-term risk |
| Recovery time | Time to restore supply or qualify alternatives | Multiplies the total cost beyond the initial downtime |
You don’t need perfect precision.
Even directional estimates help decision-makers compare risks and prioritize mitigation.
For example, U.S. manufacturers face unplanned downtime costs that can reach into the hundreds of millions annually, according to industry studies.
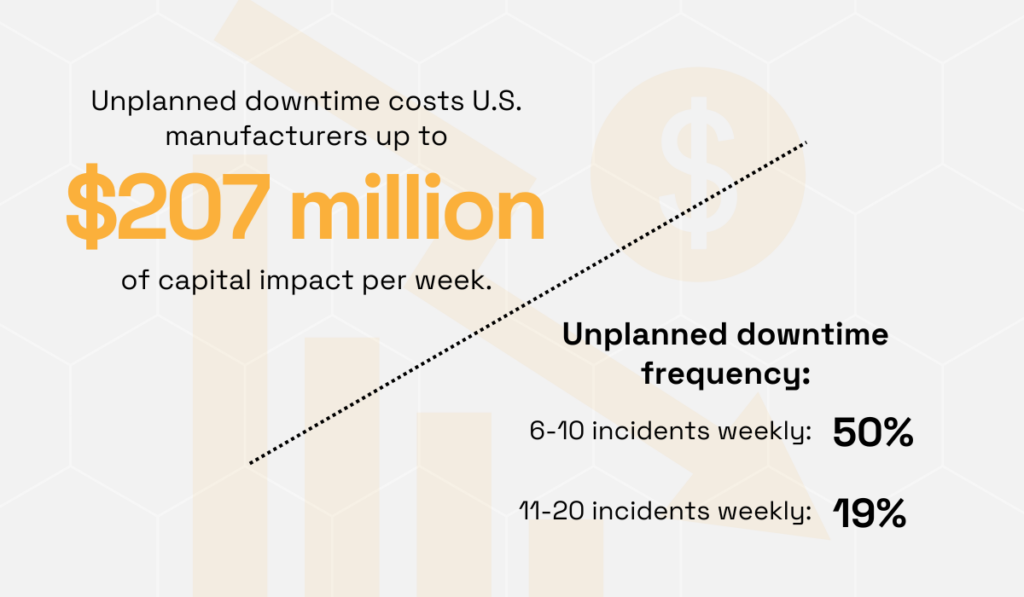
Illustration: Veridion / Data: Fluke
When multiple critical suppliers are co-located, a single local incident can compress months of “typical” downtime losses into a matter of days.
So, apply the same assumptions across different supplier clusters.
That way, leadership can clearly see which locations represent manageable exposure and which ones could materially impact revenue, customers, or operational continuity.
When co-location risk is expressed in dollars, days, and customers affected, it stops being abstract.
Instead, it becomes a business problem with a price tag, and that’s what enables informed decisions on diversification, contingency sourcing, inventory buffers, or alternate logistics routes.
Co-location risk is easy to miss until something breaks.
By looking at where suppliers actually operate, what infrastructure they share, which ones are the most critical, and what a disruption would really cost, you get a clearer view of where problems could cascade.
Remember: The goal isn’t zero risk.
It’s knowing which locations deserve attention now, before one local issue takes out multiple suppliers at once.