
Blog
6 Essential Steps of the Data Collection Process
By: Stefan Gergely -
02 April 2026


We love our data, and now that you're here, you're one step closer to loving it too.
A wide sample of data, so you can explore what is possible with our data
Choose ->
built with procurement in mind. Focused on manufacturers, products and more
Choose ->
built with insurance in mind. Focused on classifications, business activity tags and more
Choose ->
built with sustainability in mind. Focused on sustainability commitments, and environmental and social governance insights.
Choose ->
built with strategic insights in mind. Focused on market trends, competitor analysis, and industry-specific data
Choose ->

Keep up to date with our technology, what our clients are doing and get interesting monthly market insights.

Key Takeaways:
In today’s data-driven world, collecting raw data isn’t enough. You must collect the right data, then turn it into insight.
Without a clear plan, you risk drowning in noise.
The good news is that a disciplined process makes data collection efficient and valuable.
In this article, you’ll learn six essential steps, from setting goals to using insights, that guide enterprises to gather business data effectively and securely.
You must start with the question, not the data: why do you need the data?
Collecting information without a clear objective leads to waste. You accumulate noise, not insights.
Therefore, begin by identifying the specific business decision this data will support.
Are you entering a new market? Do you need to qualify suppliers for ESG compliance?
Your goal determines the data points you need.
Then specify what metrics or attributes you need.
Andy Powers, Sr. Solutions Consultant, Technical Validation at Adobe, advises playing the role of a “foreign detective.”
He states:

Illustration: Veridion / Quote: Adobe
Practically, this means defining fields, like annual revenue by customer segment or carbon emissions per supplier, formats, and updating frequency up front.
It also means deciding what quality thresholds are acceptable.
Here’s the thing: undefined data requirements lead to wasted effort. An unfocused collection produces piles of irrelevant records that don’t support any strategy.
To avoid this, align your data goals with business goals. Having concrete objectives stops you from gathering every detail just in case.
In short, here’s what you need to do in this first step:
| Define key actions | List the specific business questions and decisions that will use the data |
| Clarify scope | Decide which attributes, segments, time frames, and granularity matter |
| Set quality criteria | Define acceptable accuracy levels, formats, and update intervals |
| Work with stakeholders | Identify who needs the data and who will use the insights |
By the end of this step, you and your team should have a concrete data brief. This keeps everyone aligned and ensures you only collect what’s truly needed.
Once you know what data you need, figure out where to get it.
Large organizations have two broad categories of sources: internal systems and external sources.
Internal sources typically include enterprise systems like:
These capture your sales data, inventory levels, supplier contacts, employee records, and more.
External sources can include:
High-quality analytics rely on comprehensive, accurate data. Relying on just one system or provider, therefore, creates blind spots and biases.
And that leads to inefficiencies.
For instance, a McKinsey study found that 82% of firms still spend one or more days a week
fixing data errors, in part because they rely on manual or fragmented sources.
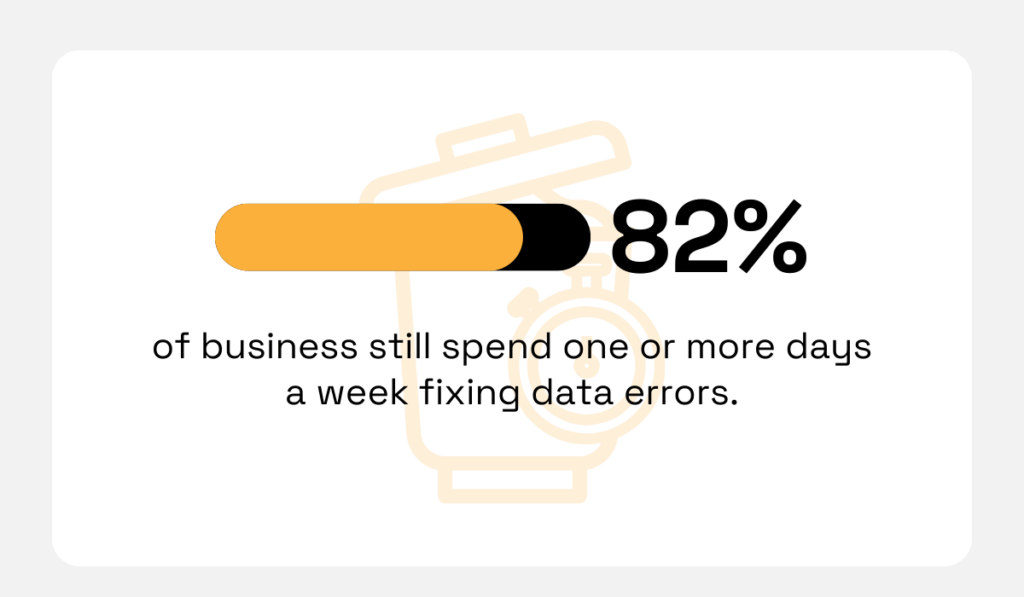
Illustration: Veridion / Data: McKinsey
By contrast, automated, multi-source approaches cut duplication and improve coverage.
So, don’t limit yourself to internal spreadsheets; look outside.
For example, combining your CRM data with external market reports or news can reveal opportunities or risks you’d otherwise miss.
In short, survey all possible sources. The goal is complete and reliable coverage of the attributes you need.
High-quality sources give you confidence that insights won’t be based on outdated or biased data.
With sources chosen, it’s time to actually gather the data.
Today, this step can often be heavily automated, saving you countless hours of manual work.
Methods vary by source:
| APIs and Data Feeds | For instance, your CRM or ERP might let you pull customer or transaction data on a schedule. Third-party vendors often provide API access for firmographics or market data |
| Web Scraping | For information not available via API (like details from company websites or regulatory sites), web scraping tools can extract structured data from HTML pages |
| Data Integration Tools | ETL (extract-transform-load) and integration platforms can connect to various sources and consolidate data into a data warehouse or data lake |
| Surveys and Manual Research | When no digital sources are available, you may need to collect data manually. This could mean conducting surveys, interviews, or having analysts research and enter data |
| Third-Party Enrichment | You can also purchase or license data. Commercial data providers supply enriched profiles of companies, people, or products. These services often draw on multiple sources and deliver ready-to-use data |
The goal is to consolidate everything into a centralized environment, like a database, warehouse, or master data system, so you can compare and merge records consistently.
Modern AI business intelligence platforms like Veridion simplify this process.
Veridion is built to collect and unify firmographics, operational data, and ESG attributes at scale, automatically syncing updates weekly.
Its database provides access to over 130 million companies, over 300 company attributes, across 500 million locations.
The platform helps companies automatically collect and structure global business data at scale, reducing the manual effort required to maintain broad coverage.
Source: Veridion
The takeaway is that with the right tools (APIs, cloud integrations, data pipelining), you can automate the bulk of collection, freeing your team to focus on defining strategy and analyzing results.
Now that the raw data is in hand, clean it.
Raw data is rarely ready for use. It arrives inconsistent, duplicated, or incomplete. You must enforce order.
Data cleaning standardizes naming conventions, addresses, and industry codes. This step is non-negotiable.
Joey Gault, Manager, Web Strategy, dbt Labs, a data transformation platform, explains what it entails.
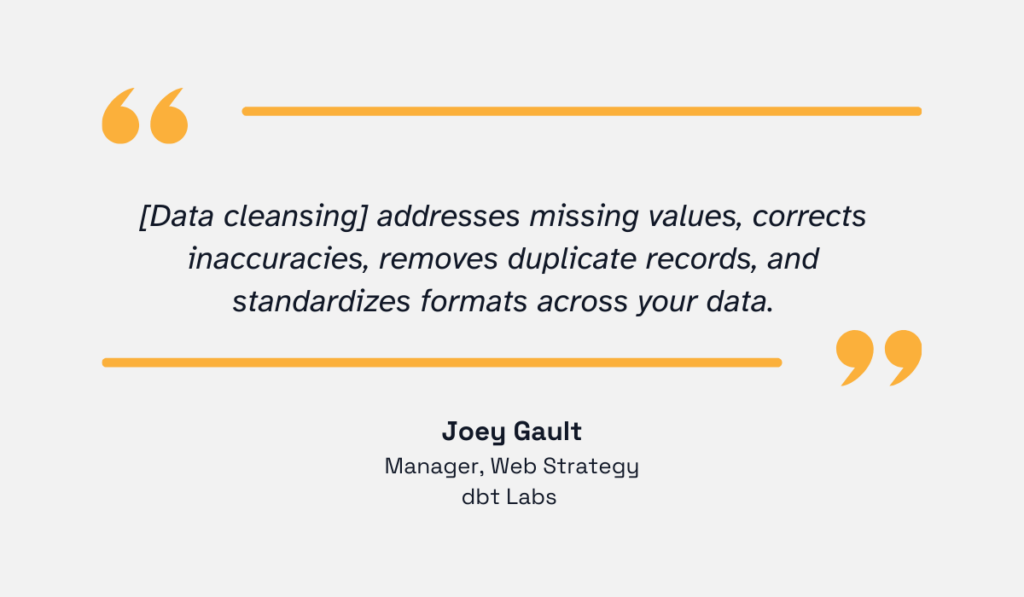
Illustration: Veridion / Quote: dbt Labs
But why bother?
Because dirty data drives bad decisions.
Gartner estimates that poor data quality costs organizations an average of $12.9 million per year.
What’s more, an IBM survey found that over 40% of COOs cite data quality issues as causing multi-million-dollar losses.
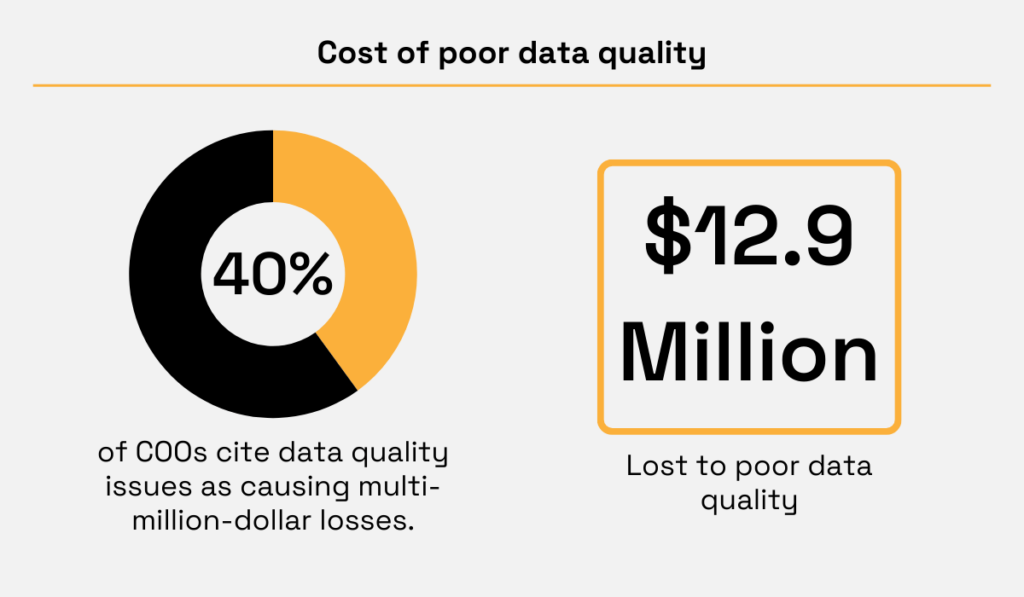
Illustration: Veridion / Data: Gartner and IBM
In other words, clean, reliable data is the foundation of trust. Here’s how to ensure your own data meets those criteria.
First, remove duplicates. Merged data from multiple sources will have overlapping records for the same company or product.
Use key identifiers, like company registration numbers, tax IDs, or matched URLs, to spot duplicates.
When you find them, decide on a single “master” record or carefully merge the attributes. Keeping only one canonical record per entity prevents inflated counts or incorrect aggregations.
Second, standardize formats and fields.
This means enforcing consistent naming conventions and codes.
For instance, all company names should follow the same punctuation rules; dates should use a unified format; and numeric values should have the same currency or units.
Third, correct obvious errors or gaps.
This can involve filling in missing fields where possible (e.g., looking up a missing SIC code) or removing clearly bad data (e.g., a date of 1900).
While 100% perfection is rare, the goal is to eliminate glaring issues that could skew analysis.
Thorough data cleaning prevents misleading results. For example, a misplaced decimal in revenue could distort calculations or trends.
Just keep in mind, this is not a one-time fix. Once you clean the data, set up ongoing hygiene: automated checks that alert you to new duplicates or format breaks.
Fixing problems at collection or ingestion time (rather than after analysis) saves headaches.
With clean data in place, analysis becomes much more accurate and efficient.
Once cleaned, your data needs a secure home.
Choose a structured, secure environment, such as a data warehouse, a master data management (MDM) system, or a secure cloud platform.
Proper storage has two goals: making the data accessible for analysis and protecting it from misuse or breaches.
Implement role-based access control (RBAC) so that only authorized users can view or modify sensitive fields.
For example, your finance team may need access to revenue data but not to proprietary R&D metrics.
RBAC not only improves efficiency but also helps meet compliance requirements: it provides regulators with transparency into who accesses sensitive information, when, and how.
This access control method also enforces least-privilege access, meaning each user only has the permissions necessary for their role.
This prevents accidental leaks and helps trace any data change back to an individual.
Apply encryption to data at rest and in transit. This protects sensitive business information and ensures compliance with privacy regulations such as GDPR and CCPA.
Lori Schafer, CEO of Digital Wave Technology, an AI-native enterprise solutions company, notes that all of this needs to be done across the entire organization.
Illustration: Veridion / Quote: Forbes
This means your databases or data lakes should encrypt sensitive columns, like PII or intellectual property. Back up data to encrypted storage.
Use secure connections (e.g., TLS) for any data transfer.
The goal is to keep raw business data, customer details, financials, etc., confidential, even if the infrastructure is compromised.
Maintain audit logs of who accessed or changed the data. Monitoring systems can flag unusual access patterns, like, for instance, a user downloading an entire dataset.
Regular vulnerability scans and patching are also part of security hygiene.
In short, treat your data repository with the same security rigor as any critical system.
By properly securing data, you ensure it remains an asset, not a liability.
Collection is pointless without action. The final step is transforming your clean, structured data into insights.
The effectiveness of your entire process is measured here.
Does the data support better decisions?
For business leaders today, this is critical.
Gonzalo Gortázar, CEO of CaixaBank, a Spanish multinational financial services company, puts it perfectly:
Illustration: Veridion / Quote: IBM
You get that analytic support through your data.
Here’s how: use analytics and reporting tools to model the data.
Build dashboards that show real-time metrics, like:
Then, apply statistical or machine learning models for forecasting or risk assessment.
For example, you might use the data to predict supplier delivery delays or identify sectors where demand is surging.
Visualization tools, like Power BI, Tableau, and custom BI apps, let executives slice the data by region, product line, or year.
The important thing is: tie every analysis back to your original goals.
Why is this step critical? Ultimately, it’s the only way to justify the data effort.
McKinsey research found that companies that use analytics intensively are nearly 19 times more likely to achieve above-average profitability than those that don’t.
In other words, quality data collection and analysis can be a huge competitive edge. When executives have reliable data at their fingertips, decisions are faster and involve less guesswork.
Of course, don’t just look inwards. External benchmarking and risk models are part of using data.
For instance, you can benchmark your company’s growth against industry trends, or use third-party credit scores and ESG ratings to assess partner risk.
Integrating internal and external data often reveals insights you can’t see by looking at one alone.
Finally, measure effectiveness. Track key performance indicators (KPIs) and see if the data is driving improvement.
Are procurement costs down? Is customer churn reduced? Is compliance reporting faster?
Use these metrics to close the loop: if your data isn’t answering the right questions, refine your requirements and repeat the process.
By turning data into decisions, you complete the cycle.
The success of data collection is ultimately judged by the decisions it enables.
Data collection might seem daunting, but by following these six steps, you’ll have a repeatable process.
Remember: start with clear goals, gather from trusted sources, use the right methods to collect and centralize, then clean meticulously, store securely, and finally derive insights.
Do this well, and you turn raw figures into a solid foundation for strategy, making your enterprise more agile, informed, and competitive.