
Blog
How to Gather Market Intelligence In 5 Steps
By: Stefan Gergely -
25 November 2025


We love our data, and now that you're here, you're one step closer to loving it too.
A wide sample of data, so you can explore what is possible with our data
Choose ->
built with procurement in mind. Focused on manufacturers, products and more
Choose ->
built with insurance in mind. Focused on classifications, business activity tags and more
Choose ->
built with sustainability in mind. Focused on sustainability commitments, and environmental and social governance insights.
Choose ->
built with strategic insights in mind. Focused on market trends, competitor analysis, and industry-specific data
Choose ->

Keep up to date with our technology, what our clients are doing and get interesting monthly market insights.

Key Takeaways:
You’re already collecting plenty of data: from customers, suppliers, and the market itself.
But the challenge isn’t getting information. It’s turning it into something useful.
That’s where market intelligence comes in.
It helps you organize what you know, fill in what you don’t, and turn scattered data into clear direction.
Whether you need to trim costs, strengthen your supplier network, or simply avoid getting caught off guard, the right intelligence process makes it possible.
This guide breaks down five steps to gather market intelligence that drives real action, not just more spreadsheets nobody reads.
To get the most out of market intelligence, you need to start with a clear picture of what you’re trying to achieve.
In supply chain management, that typically means zeroing in on four key priorities:
But to truly make intelligence useful, you also need to connect it to your company’s broader strategic objectives.
Are you exploring new markets, or are you trying to sharpen your competitive position?
Are you perhaps adjusting pricing to stay profitable as costs rise?
Each goal requires a different focus.
In other words, you need to match your intelligence efforts to what you’re actually trying to accomplish.
Without that alignment, you’ll collect plenty of data, but struggle to turn it into decisions that move the needle.
To illustrate, let’s look at a real-world example of how this has been done effectively.
A semiconductor manufacturer faced stagnant growth and rising churn.
But when they began using strategic market intelligence to truly understand their customers, everything changed.
The sales pipeline grew by 25%, and churn was cut by 50% through smarter cross-selling and upselling.

Illustration: Veridion / Data: Contify
Their success came down to one thing: knowing exactly what problem they needed to solve and using intelligence to guide every decision.
The key is to begin with your end goal: define what decisions your leadership needs to make, then collect intelligence that helps support those decisions.
When you’re building a market intelligence program for your supply chain, one of the most important steps is choosing the right data sources.
Without reliable data, even the best intelligence strategy falls apart, and you’ll end up making decisions based on incomplete or outdated information.
The problem? Most supply chain leaders don’t trust what they’re working with.
In early 2022, Zencargo surveyed 200 senior supply chain decision-makers in the UK and Benelux retail and found that only 4% trust their data.
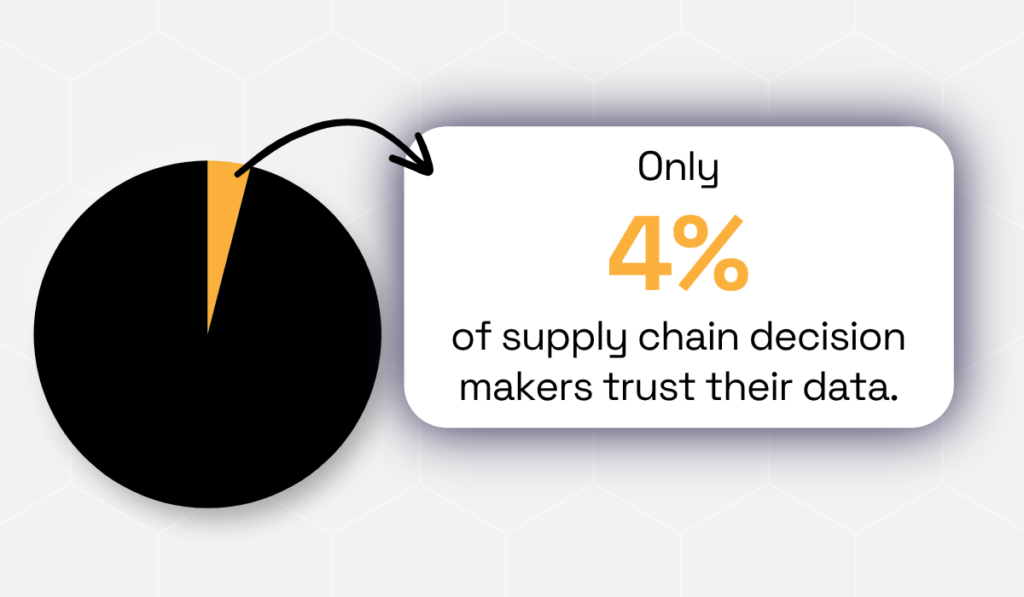
Illustration: Veridion / Data: Zencargo
If 96 out of 100 supply chain leaders don’t trust their data, something’s fundamentally broken.
The solution?
Being smarter about where you get your data from.
But before you can evaluate any source, you need to know what you’re looking for, and that starts with understanding the basic building blocks of data itself.
To choose the right data, there are two things you need to understand: the difference between internal and external data, as well as primary and secondary data.
Knowing these distinctions will help you build a more accurate and actionable market intelligence program and get a complete view of your supply chain environment.
First, let’s explore the difference between internal and external data.
Internal data is generated within your organization, and it shows you exactly what’s happening on your side of the supply chain.
When used right, it can completely change how your business runs.
One company’s experience shows just how transformative this approach can be.
A global electronics manufacturer partnered with an AI supply planning software company to make sense of their scattered internal data: ERP records, production logs, and shortage reports.
Once they unified and cleaned those datasets, problems that had been hiding in plain sight suddenly became obvious.
Within a year, they’d cut inventory by 15% and slashed critical shortages by 60%.

Source: LeanDNA
The takeaway?
They didn’t need more data, just better organization of what they already had.
Internal data, when properly centralized, can unlock improvements you didn’t know were possible.
But it only tells half the story. It reveals what’s working inside your walls, but not what’s happening in the market.
To truly optimize your supply chain, you need to combine it with external data sources.
External data comes from outside your organization, and it reveals what you can’t see from the inside.
In practice, companies are already seeing the impact.
A global manufacturing company started integrating third-party datasets into its risk-monitoring system.
Instead of relying only on supplier self-reports, they began tracking external data such as:
By combining this with their internal supplier records, the company spotted supplier risks up to 30% faster and cut investigation times by nearly half.
Source: LexisNexis
Simply put, external data filled in the gaps that internal records couldn’t. The result was a complete risk picture that let them act before problems escalated.
Internal and external data work together, but they serve different purposes.
Here’s the breakdown of what each one actually covers:
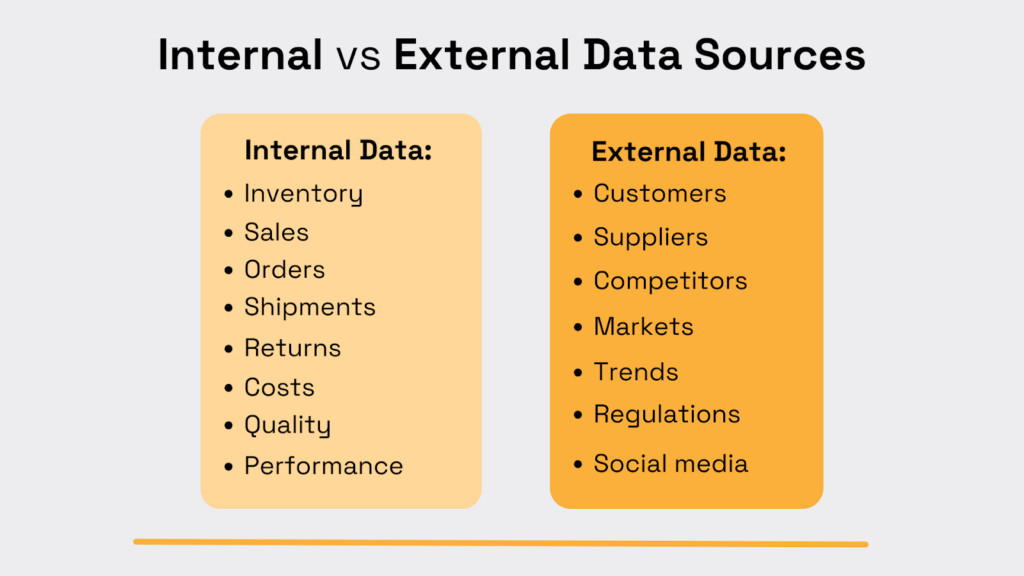
Source: Veridion
But there’s another layer that matters just as much.
Your data breaks down into primary and secondary sources depending on how it’s gathered.
Primary data refers to original information you gather directly from your sources, such as:
This data is your most accurate and relevant resource for making immediate supply chain decisions.
Unilever, a consumer goods company, knows this very well.
They used primary data to measure emissions across every tier of their network.
The result?
60% of their carbon footprint was hidden among Tier-2 and Tier-3 suppliers, something secondary reports wouldn’t have revealed.
Secondary data, on the other hand, is data you didn’t collect, but can access and use.
It includes:
It gives you what you need to understand market trends, benchmark your performance, navigate regulations, and plan ahead.
Combined with primary data, it gives you the visibility and insights to transform your supply chain strategy and respond faster than ever.
But, there’s one problem: building this data foundation is time-consuming and resource-intensive.
And doing it all manually in 2025 is simply not practical.
Fortunately, you don’t have to.
Veridion helps you gather and enrich global company data accurately and at scale.
Instead of piecing together fragmented data from multiple sources, you’ll get comprehensive, real-time intelligence on suppliers, customers, and competitors.

Source: Veridion
Veridion automates the entire process: gathering, enriching, and contextualizing company data across the globe.
In the end, you get accurate, actionable intelligence faster than you could ever build it yourself, right at your fingertips.
It’s also worth mentioning that no overhaul is needed for Veridion to work for you.
Veridion works with your existing tools, whether it’s BI dashboards, analytics workflows, or data lakes.
You get the data when you need it, formatted the way you need it, without disrupting your current systems:
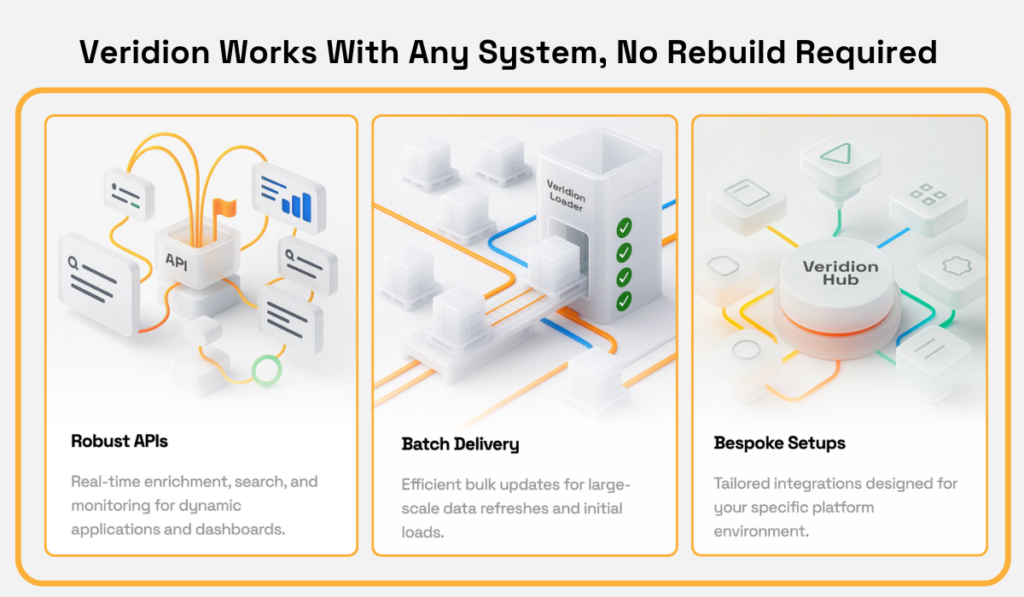
Source: Veridion
What it comes down to is this: you need market intelligence that’s fast, accurate, and easily integrated into your workflows.
Veridion delivers all three, without requiring you to rebuild your systems or overhaul your processes.
Up next, we’ll look at how to centralize all that data effectively, because collecting it is only half the battle.
If your data lives everywhere, your insights live nowhere.
Centralization brings everything together so intelligence can actually drive action.
So, the challenge isn’t gathering information. It’s organizing it.
Most supply chain teams already track hundreds of signals concerning suppliers, markets, logistics, and pricing.
Without a centralized system, this data lives in silos, making it nearly impossible to see the full picture or act quickly when conditions change.
According to the 2025 State of Supply Chain Report, less than 10% of companies have automated most of their core supply chain activities, while more than 45% are still doing mostly manual work.
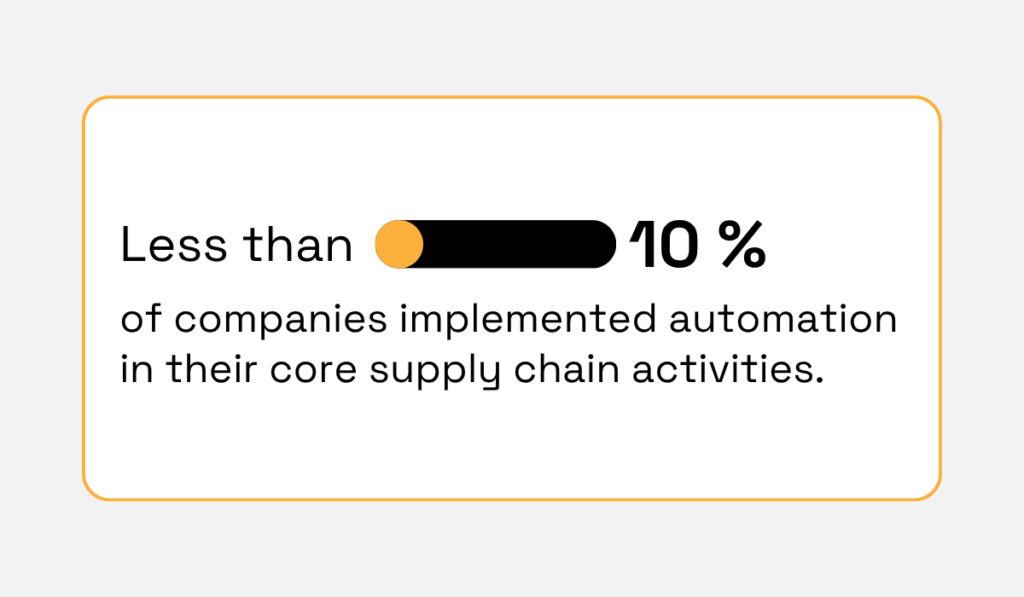
Illustration: Veridion / Data: Inspectorio
As a result, their data is scattered across different systems, making it harder to see the full picture and respond quickly when things change.
Data centralization doesn’t just reduce complexity, but enables faster, cross-functional collaboration and smarter, more proactive moves.
But to build that kind of system, automation is key.
Manual data collection or spreadsheet consolidation simply can’t keep up with today’s market velocity.
Instead, you could use tools that automatically pull and refresh information from your internal systems.
Consider ERP, CRM, and logistics software, while also tapping into external sources like supplier databases, risk platforms, and pricing indexes.
The shift toward automated, real-time intelligence is already well underway.
According to The Intuitive Supply Chain Report, 64% of CSCOs say AI is completely transforming their supply chain workflows.
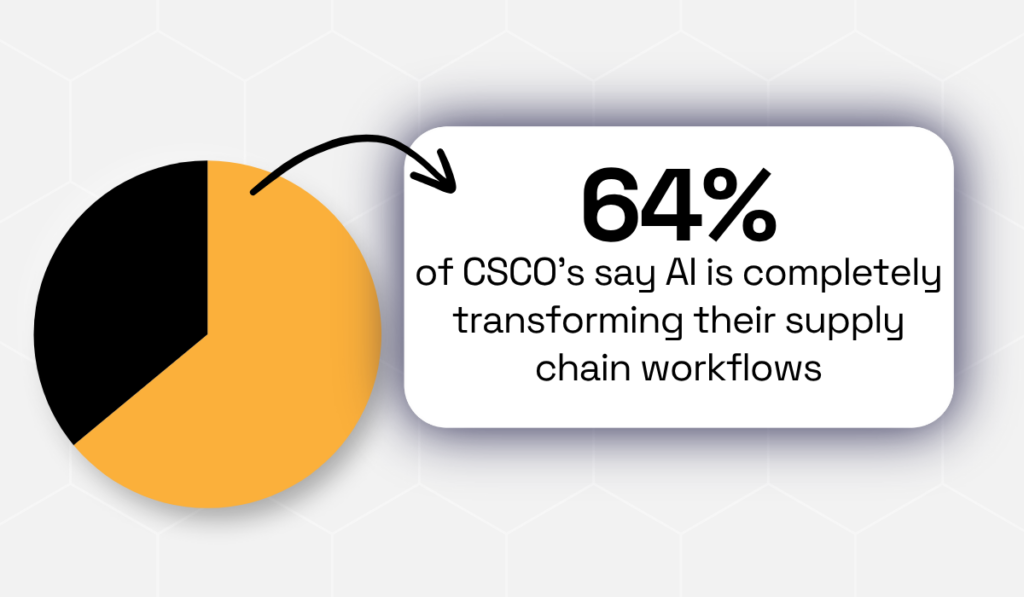
Illustration: Veridion / Data: IBM
Supply chain teams aided by AI are forming a new working dynamic that reaches across the entire supply chain, from planning and procurement to manufacturing and distribution.
In practical terms, this means they spot issues before they become crises.
Your team can act on what’s actually happening right now, not what happened last week or last month.
You can take it further by setting up automated alerts within your centralized platform.
For example, trigger notifications for supplier credit rating changes, shipment delays, or sudden price fluctuations.
This turns your data hub from a static archive into a live decision-making engine.
Finally, make sure your central repository is user-friendly and integrated into daily workflows.
It should serve as your “single source of truth,” where teams can pull consistent, verified information without wasting time reconciling numbers.
Raw data doesn’t make decisions; you do.
The goal now is to turn what you’ve collected into clear guidance your team can act on.
Start by organizing your analysis around a simple framework: SWOT.
It helps you separate what’s happening inside your operation from what’s shifting in the market around you.
Strengths and Weaknesses show you where you stand right now.
This includes matters like whether your costs are competitive, if quality is holding up, or where your suppliers are underperforming.
Opportunities and Threats point you toward what’s coming next.
New suppliers entering the market, regulatory changes that could impact sourcing, or shifting demand patterns that you need to get ahead of.
This structure keeps your analysis focused and makes it easier to decide what to do next.
You could use this SWOT breakdown to organize everything you’ve learned into four clear buckets that show you what to do next:
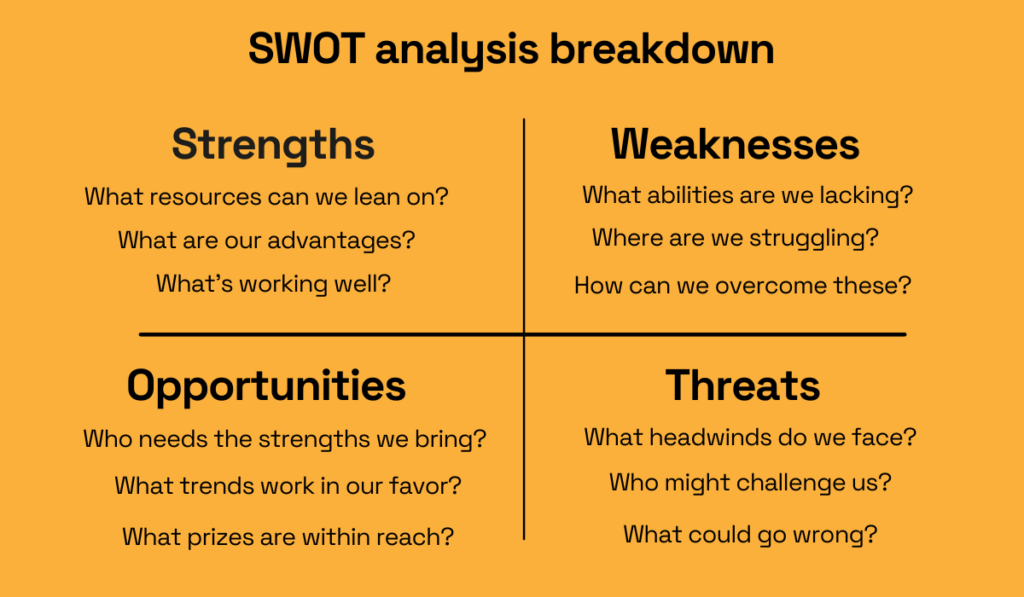
Illustration: Veridion / Data: BiteSize Learning
This will force you to move from “interesting data” to prioritized levers you can pull next.
In supply chains, SWOT is your reality check.
It helps you see which suppliers strengthen your position, which categories drain resources, and where hidden risks could hit next.
Take Qatar, for example.
As one of the world’s top liquefied natural gas exporters, its supply chain is a logistical powerhouse.
It is backed by vast gas reserves, a strong global fleet, and strategically located infrastructure.
But when researchers ran a full SWOT analysis on the system, they uncovered more than just strengths.
Despite Qatar’s dominance, the study flagged two big weak spots: emissions across the chain and gas loss from boil-off during transit.
On top of that, they saw potential threats, such as stricter shipping regulations and overdependence on a single route through the Strait of Hormuz.
The takeaway?
Even a market leader needs constant visibility and strategic foresight to stay ahead.
And that’s the real power of SWOT: it doesn’t just confirm what’s working, but tells you what could knock you off course.
Next, consider adding competitive benchmarking to see where you actually stand.
Compare your lead times, on-time delivery, cost-to-serve, and contract compliance against competitors or industry averages.
The numbers reveal where you’re winning (so you can push harder) and where you’re falling behind (so you can fix it fast).
Just make sure you’re comparing apples to apples.
Then look for patterns over time.
Track trends in pricing, demand, and supplier performance.
When a metric drops for multiple periods, flag it immediately.
When seasonal patterns emerge, plan around them. This turns your data from a history lesson into a forecasting tool.
Finally, use sentiment analysis when external opinions start to shape outcomes, whether that’s customer reviews, social media posts, news coverage, or forums.
These “soft signals” help you catch shifts in perception before they become bigger problems.
You can track brand reputation, prioritize support issues, or spot product concerns buried in feedback.
Once you have these insights, they need to reach the people who can act on them, fast.
Insights only create value when the right people see them.
Your job now is to deliver clear, role-specific views so teams can act without digging.
Centralized, role-based dashboards give everyone—from executives to category managers—a clear view of what matters most.
They pull everything into one place and show each person exactly what they need to see.
You can see this in practice at Deere & Company.
They redesigned their supply chain network: consolidating facilities, optimizing terminals, and integrating logistics partners.
With clear visibility across operations, they slashed inventory by $1 billion, cut delivery times from 10 days to 5, and saved 5% annually on transportation costs.
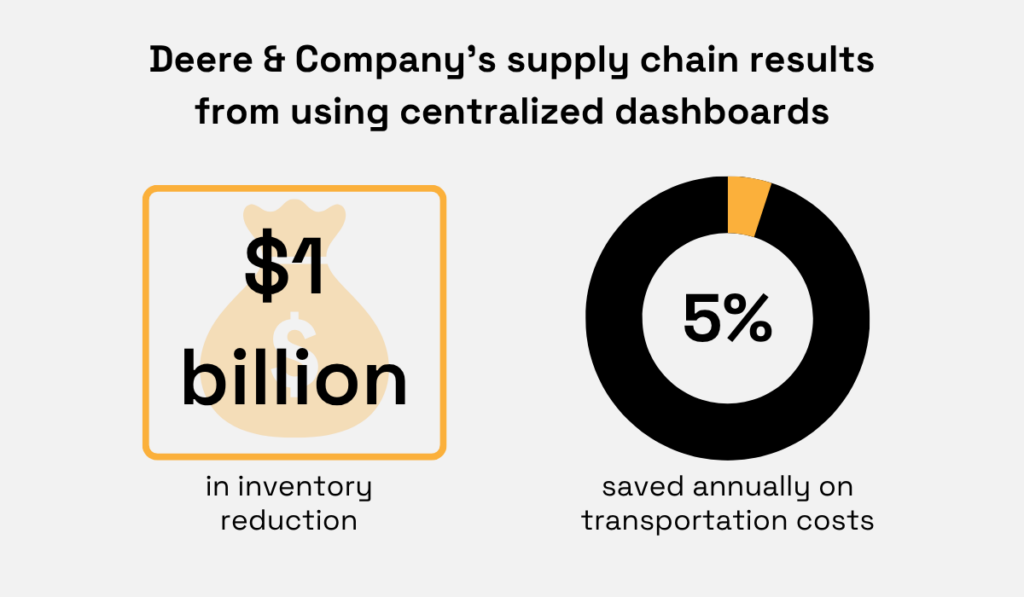
Illustration: Veridion / Data: Scribd
Centralized dashboards don’t just organize information.
They unlock performance across your entire supply chain.
When teams see the same data, they make better decisions, faster.
Executives can see total spend, supplier risk, and performance trends in one place, while procurement specialists can drill into cost drivers, lead times, and contract compliance.
And the ROI of getting this right is substantial.
In fact, the 2023 report from Ardent Partners indicates that each new dollar of spend managed by procurement teams can save 6–12% and improve quality and risk management.
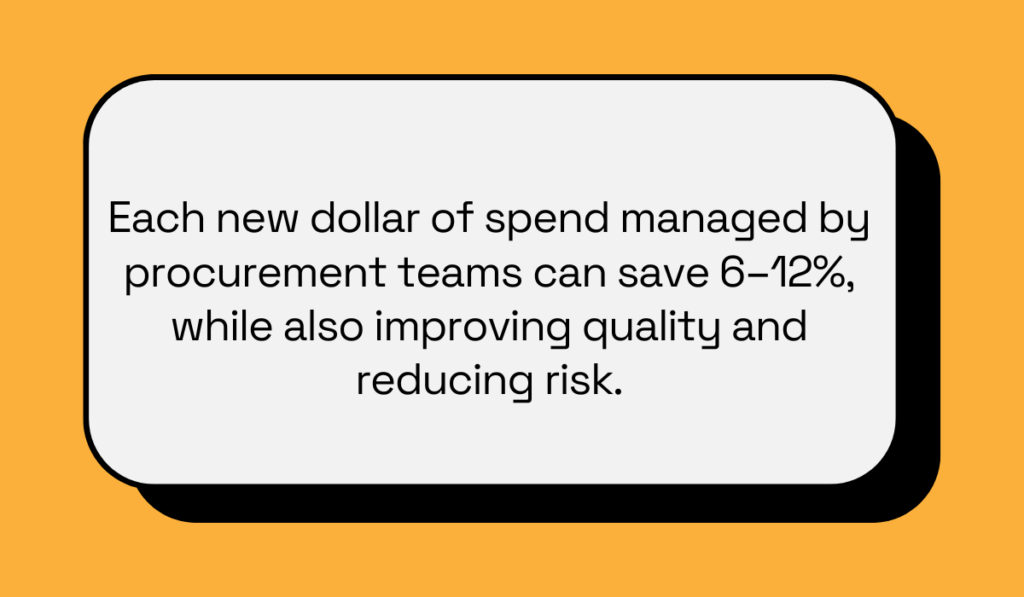
Illustration: Veridion / Data: Ardent Partners
To put it into perspective, if procurement manages $1 million of spend, the company could save $60,000–$120,000.
That’s because real-time visibility helps teams act proactively instead of reactively.
But dashboards alone aren’t enough.
Pair them with short, focused summaries that distill what changed, why it matters, and what action to take.
A concise weekly or monthly brief with three key takeaways and next steps can drive far more alignment than a 20-page report.
The goal isn’t more information, but information you can take action on.
Finally, make your insights impossible to miss by weaving them into the tools your teams already live in.
Imagine a sourcing manager opening their dashboard to find a quick note:
“Supplier A’s on-time delivery dropped 6% this quarter. Consider shifting 20% of volume until performance improves.”
These small, timely nudges will help your teams move faster and make smarter calls in the moment.
When insights are easy to find and simple to act on, people actually use them.
If you’re still gathering market intelligence manually, you’re wasting time you don’t have.
Whether you need to optimize sourcing, mitigate supply chain risks, or stay ahead of market shifts, a strong intelligence process is the line between “playing catch-up” and setting the pace.
And with today’s tools that automate data collection, centralize insights, and deliver real-time visibility, you can skip the grunt work and focus on making smarter decisions faster.
Build the system now, and you won’t just keep up with market changes.
You’ll see them coming and be ready to act before your competitors even notice.