
Blog
Insurance Business Intelligence: A Quick Guide
By: Stefan Gergely -
10 November 2025


We love our data, and now that you're here, you're one step closer to loving it too.
A wide sample of data, so you can explore what is possible with our data
Choose ->
built with procurement in mind. Focused on manufacturers, products and more
Choose ->
built with insurance in mind. Focused on classifications, business activity tags and more
Choose ->
built with sustainability in mind. Focused on sustainability commitments, and environmental and social governance insights.
Choose ->
built with strategic insights in mind. Focused on market trends, competitor analysis, and industry-specific data
Choose ->

Keep up to date with our technology, what our clients are doing and get interesting monthly market insights.

Key Takeaways:
Insurance companies generate vast amounts of data every day, but raw information alone doesn’t create value.
Business intelligence (BI) transforms that complexity into actionable insights that insurers can use to predict claims, optimize portfolios, enhance customer experience, and more.
In this guide, we explore insurance BI through key use cases and components, as well as challenges that can make or break its implementation.
Business intelligence (BI) provides a structured framework for turning raw data into timely, decision-ready insight.
In insurance, that means sharper underwriting, seamless claims management, and better operational efficiency across the board.
Insurance BI spans a connected ecosystem of technologies, processes, and governance designed to collect, integrate, analyze, and visualize data at scale.
By accessing intuitive dashboards and reports, executives and operational teams can make evidence-based decisions faster and maximize value in real-time.
But while the usability of dashboards and monitoring feeds matters a great deal, BI’s biggest near-term impact comes from advanced analytics.
As highlighted in a recent McKinsey study, insurers with mature analytics capabilities can increase their operating profit by 10–25%.
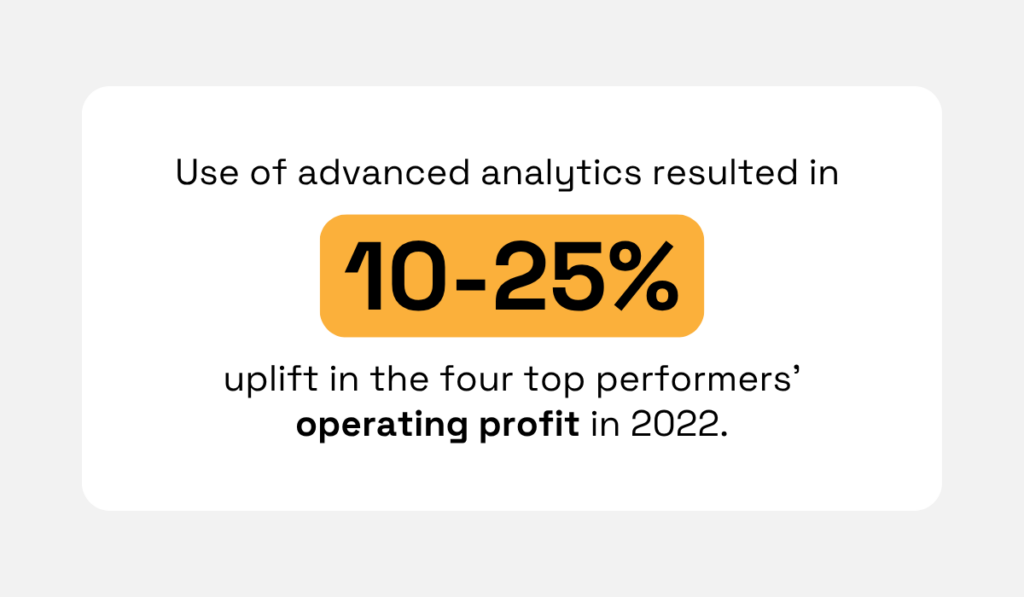
Illustration: Veridion / Data: McKinsey
While that upside is palpable, the report also indicated that many in the industry capture only a fraction of it.
The reasons why?
Limited C-suite sponsorship, analytics that are disconnected from business outcomes, and weak monitoring and change management practices.
If you want to make a tangible difference with insurance BI, these four data domains serve as key starting points:
Naturally, the implementation process has to be guided by clearly defined goals.
According to Dresner’s Business Intelligence Market Study, the top three objectives for BI deployments are better decision-making, revenue growth, and efficiency or cost savings.
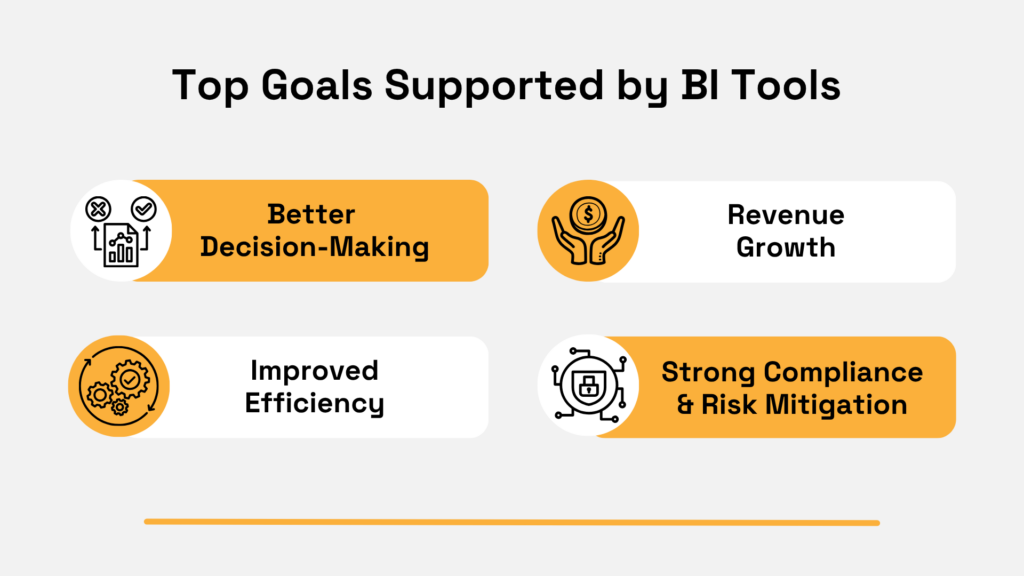
Illustration: Veridion / Data: Dresner Advisory Services
For finance and insurance, compliance and risk management emerged as the fourth most important driver.
With objectives clearly defined and governance gaps closed, the effects of BI become evident in both metrics and general strategic alignment.
To sum up, BI isn’t a single tool or system.
It comprises several capabilities that deliver both immediate and long-term value, in line with your defined use cases.
Insurance business intelligence has several use cases, helping organizations transform a variety of processes, from underwriting to customer service and sales.
Of course, delivering measurable gains depends on making targeted digital investments. Without those, even the most ambitious BI initiatives will fall short.
Unfortunately, the reality is that many incumbent insurers still rely on outdated, siloed systems, and the long-term cost of maintaining those inefficiencies is massive.
According to 2025 HFS research, the industry carries $134 billion in technology debt and $66 billion in process debt.
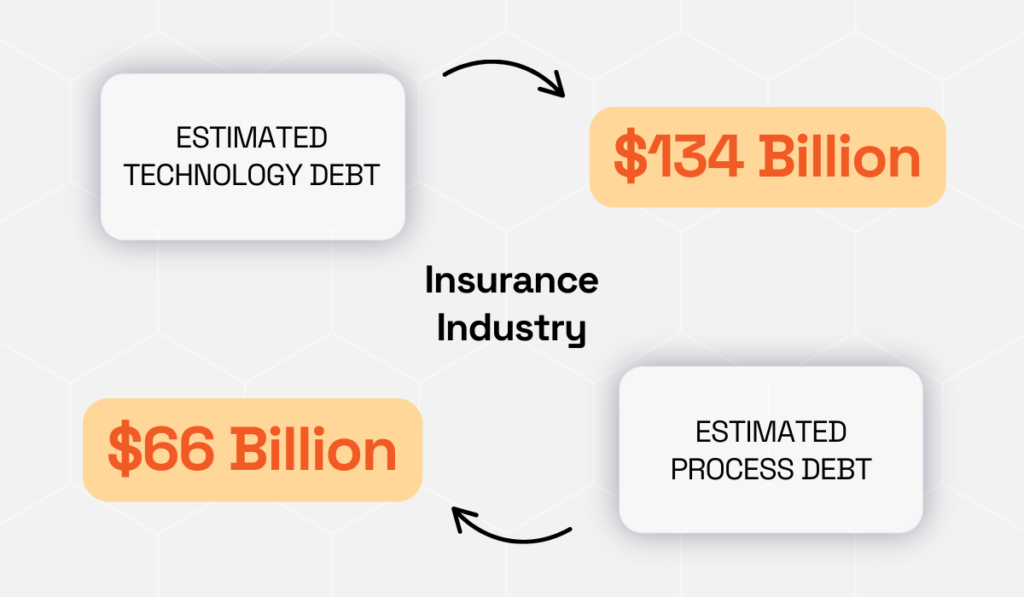
Illustration: Veridion / Data: HFS Research
Furthermore, most of these obsolete technologies and inefficiencies impact claims processing, underwriting, and core operations.
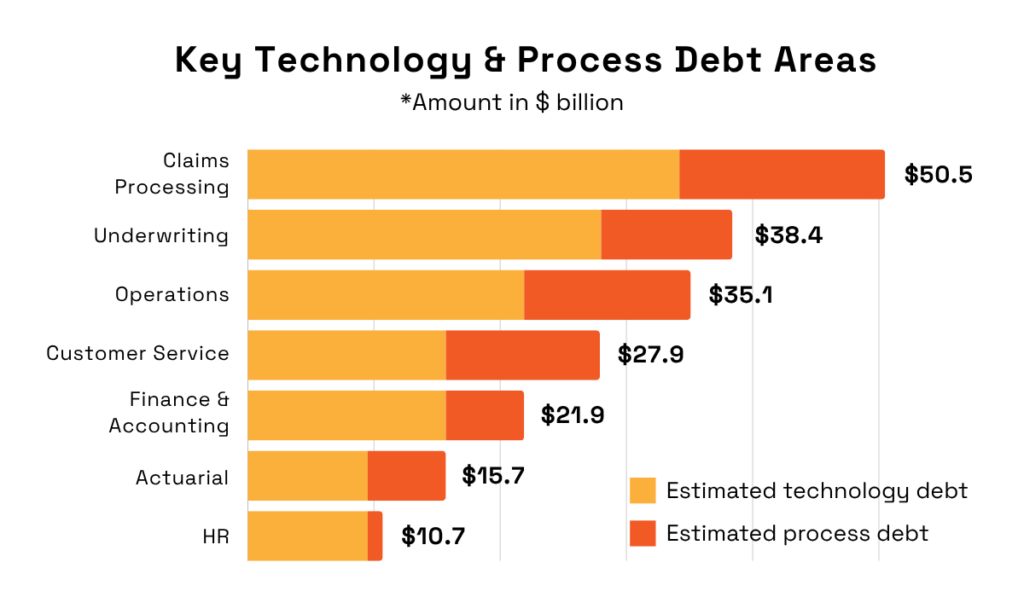
Illustration: Veridion / Data: HFS Research
And these are exactly the functions where insurance business intelligence creates the most value.
Take claims processing, for instance.
By combining climate and weather data with policy information, you can anticipate spikes in claims and then prioritize and streamline payouts when disasters strike.
As Richard Weurding, Managing Director of the Dutch Association of Insurers (VVV), explains, unlocking access to accurate data enables insurers to create stronger risk models and enhance their general disaster readiness.
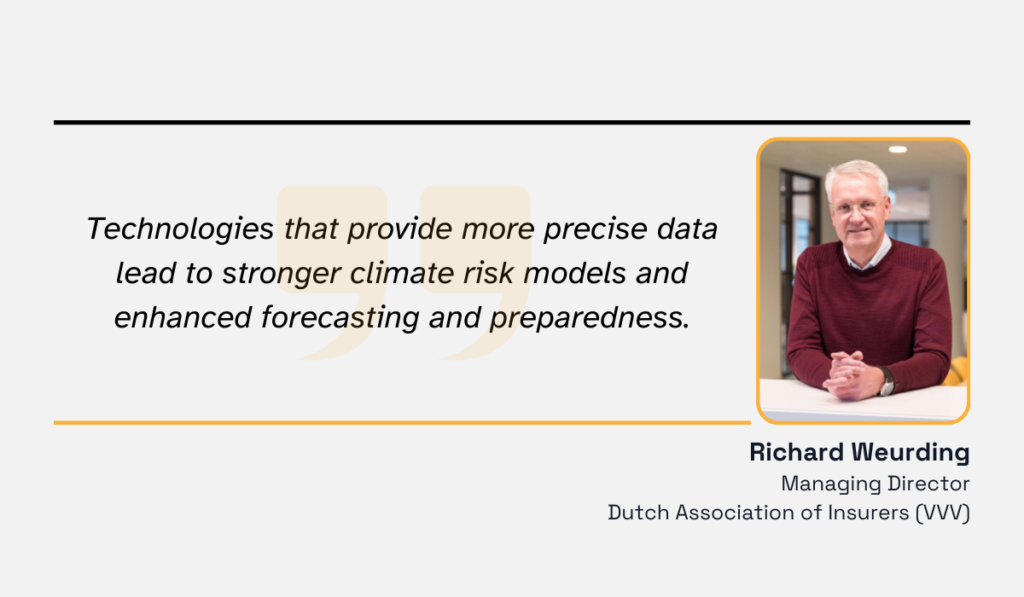
Illustration: Veridion / Data: EY
And just like that, a reactive process turns predictive instead.
Improvements in overall service are also powered by artificial intelligence.
Coupled with BI and advanced analytics, AI provides a more complete, real-time picture of your customers, both in terms of actions and sentiments.
These insights enable you to predict churn and focus your attention on high-value customers.
More importantly, with the right intelligence, your team will be able to advise and make relevant offers at key moments.
Personal-line carriers such as HDFC ERGO are already applying AI within their BI ecosystems to deliver hyperpersonalized customer experiences, improving onboarding, claims handling, and service efficiency.
When it comes to commercial insurance, the same intelligence frameworks are used to sharpen underwriting accuracy, optimize portfolio risk, and support faster, data-informed decisions between brokers and clients.
But keep in mind that as Insurtech innovation accelerates, regulators are adapting in kind.
A recent Mercer report found that 61% of insurers cite changing regulatory requirements as their top operational concern in 2024.
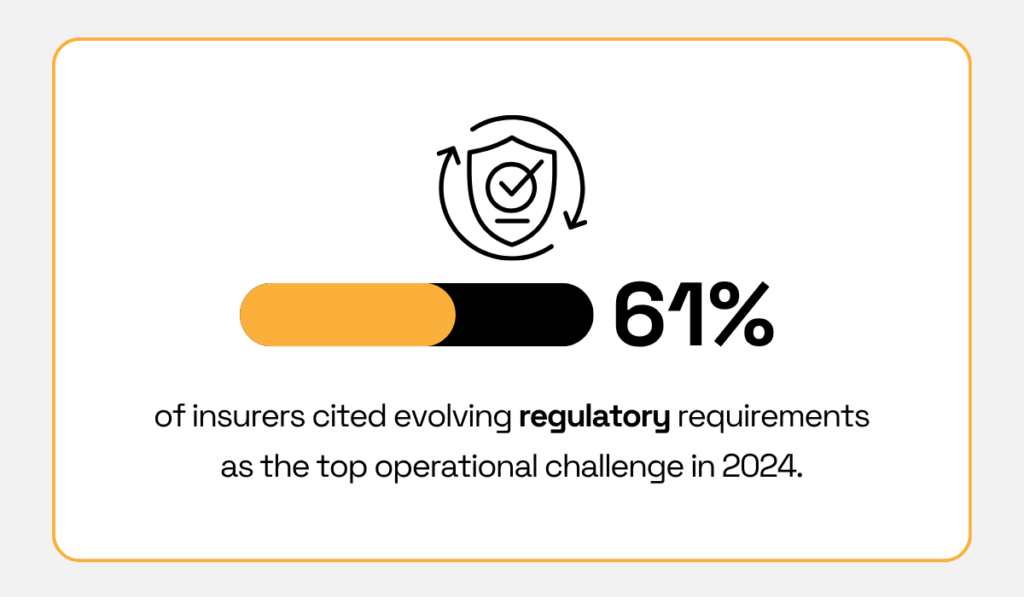
Illustration: Veridion / Data: Mercer
While not all requirements extend to technology, insurance companies leveraging BI and AI-powered tools need to stay ahead of the changes to ensure compliance and maintain consumer trust.
Ultimately, the most impactful BI use cases boil down to automation and forecasting capabilities.
Insurance business intelligence consists of several core components, from data collection to predictive insights.
A clear understanding of how these elements connect ensures they work in sync, helping your company derive value from BI at every stage.
Here are the five components at a glance:
| Component | Purpose in Insurance BI |
|---|---|
| Data collection | Aggregates data from internal and external sources into a single ecosystem |
| Data cleaning | Removes errors and duplicates to ensure the reliability of reports and models |
| Data analysis | Identifies performance trends, risk correlations, and loss patterns |
| Data visualization | Turns insights into dashboards for adjusters, underwriters, and managers |
| Predictive modelling | Uses models to forecast claims, detect fraud, and anticipate churn |
For starters, both data collection and data cleaning stages pave the way for strategic insights to follow.
Reliable BI systems aggregate streams of information from multiple internal and external sources quickly and consistently, be it claims and policies or data related to market and weather.
And since even minor errors or duplicates can erode the reliability of models, skew risk scores, and mislead decision-makers, cleaning the incoming data is essential.
Next up, robust analytical capabilities enable you to uncover performance trends, risk concentrations, and loss correlations that would otherwise go unnoticed.
For insurers, this translates to identifying underperforming products, tracking claims ratios, or detecting inefficiencies across underwriting and operations.
Solutions like Tableau have also extended BI’s accessibility with pre-built dashboards, known as Accelerators.
For instance, The Information Lab’s expert-built dash focuses on broker benchmarking, underwriter performance, and renewal analysis.
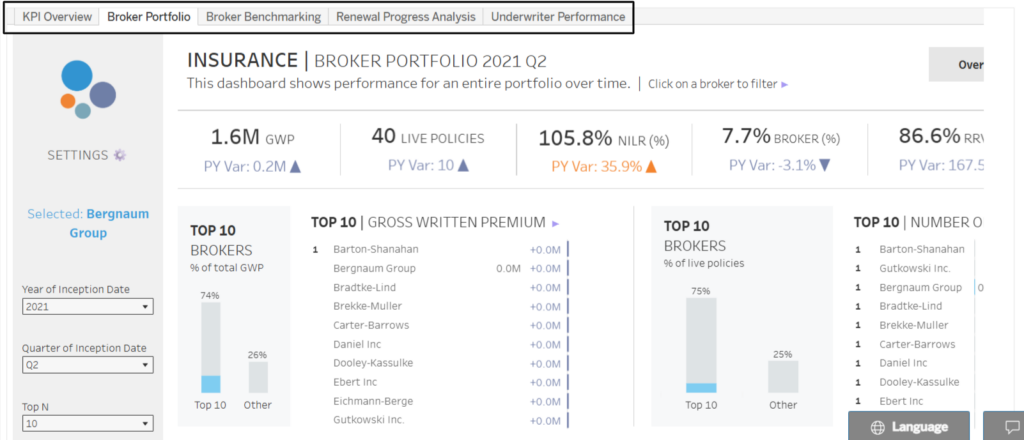
Source: Tableau
Of course, intuitive dashboards are only as good as the visualizations they rely on.
Firstly, unlike static reports, dynamic, visual feeds ensure fresh insights reach the right people faster and with the right context.
Secondly, visual data is more easily accessible to different departments, including non-technical teams.
In the image below, you can see how insurers can visualize claims and payout patterns to identify anomalies or regional trends.
Source: wynEnterprise
Geo-visualization is there to enhance situational awareness further.
Tools like Guidewire’s Canvas match policy and claims locations to external peril data such as hail, wind, flood, or wildfire.
This enables insurers to triage claims more effectively, maximize reinsurance recovery, and spot potentially fraudulent activity.
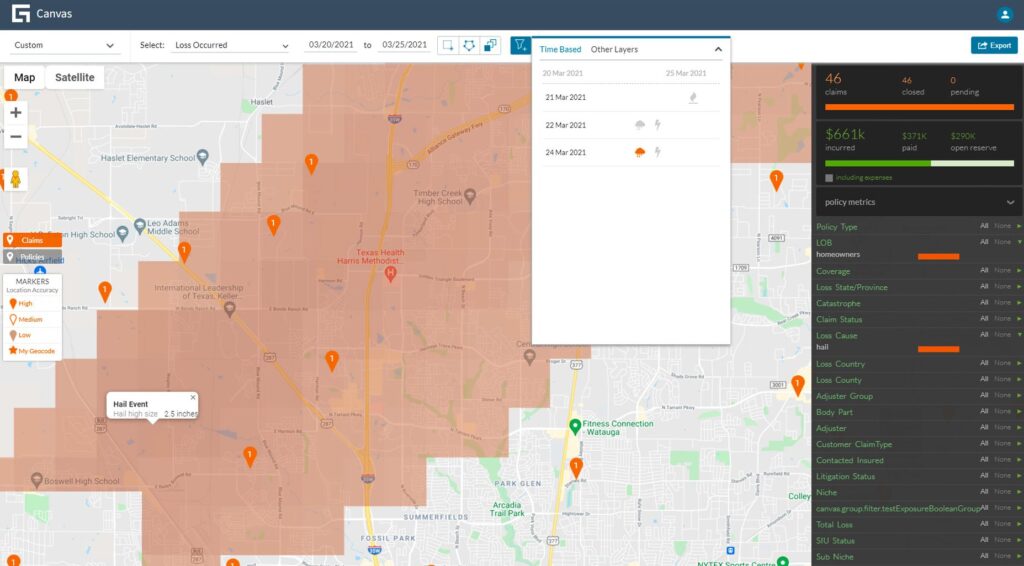
Source: Guidewire
Predictive insights make up the final layer.
They empower insurers to act ahead of time rather than simply mitigate losses as they occur.
Predictive modeling uses historical and external data to forecast claims frequency, detect fraud patterns, and even anticipate policyholder churn.
In other words, it enables dynamic risk assessments and smarter policy pricing.
For commercial insurers in particular, the ability to predict reserves accurately can make or break profitability, especially when claims involve litigation or long recovery timelines.
Jacqueline Schaendorf, Co-Founder and Director of Cogitate Technology Solutions, underscores the strategic potential of predictive BI:

Illustration: Veridion / Quote: American Association of Insurance Services on YouTube
Accurate forecasting not only improves financial stability but also gives insurers the foresight to adapt pricing and reinsurance strategies before market shifts occur.
Clean data, strong analysis, rich visualization, and forward-looking models.
When all these BI components work seamlessly, what follows is faster decision-making, more resilient operations, and a measurable competitive edge.
Despite its transformative potential, insurance business intelligence is not without challenges.
As insurers move from siloed systems to connected ecosystems, three pain points consistently emerge: data integration, data quality, and data security.
Integrating data from multiple sources, such as policy systems, claims databases, customer portals, and external market feeds, remains one of the biggest hurdles in implementing BI.
When data flows are fragmented, analytics lose accuracy and timeliness.
Still, legacy infrastructure and poor cross-functional collaboration remain a common condition.
According to Deloitte Digital, 76% of carriers cite the need for better integration between IT and business units.
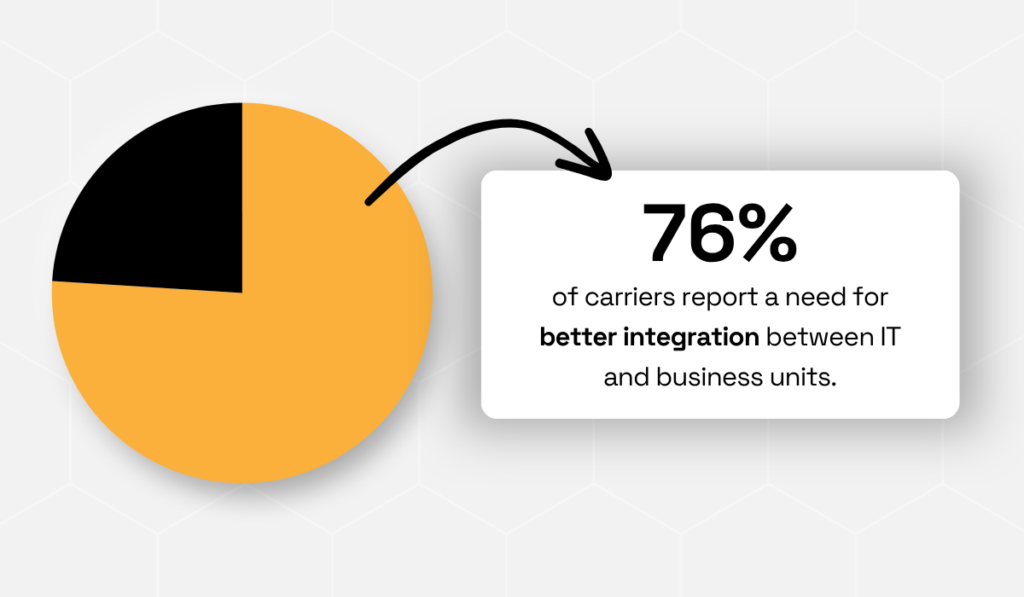
Illustration: Veridion / Data: Deloitte Digital
This underscores that data silos are both a technical and organizational obstacle, one that’s unique to each organization.
As such, true data integration involves aligning people, processes, and governance, instead of merely linking systems.
Of course, continuous data collection and defined data ownership don’t automatically translate to being able to maintain a competitive edge.
It’s about one practical question: Does your system efficiently process, analyze, and interpret data and deliver the insights to relevant staff?
Leaner integration unlocks higher-value services, from predictive modeling to consultative risk management that goes beyond policy coverage.
Swiss Re’s Global Head of Alternative Risk Transfer, Ole Ohlmeyer, highlights this mindset, emphasizing the company’s strategic focus on real-time data integration as a driver of more adaptive client solutions.

Illustration: Veridion / Data: EY
Proper integration requires effort and continuous refinement.
But when done right, BI shifts from being a reporting tool to becoming the foundation for smarter underwriting, faster claims decisions, and scalable digital growth.
Even the most sophisticated BI tools are only as reliable as the data that feeds them.
Inconsistent, outdated, or incomplete datasets can distort risk assessments, pricing models, and customer analytics, ultimately undermining the value of BI initiatives.
With this in mind, it’s no wonder that 56% of Dresner survey respondents cited data quality as one of the key focus points for BI implementation.
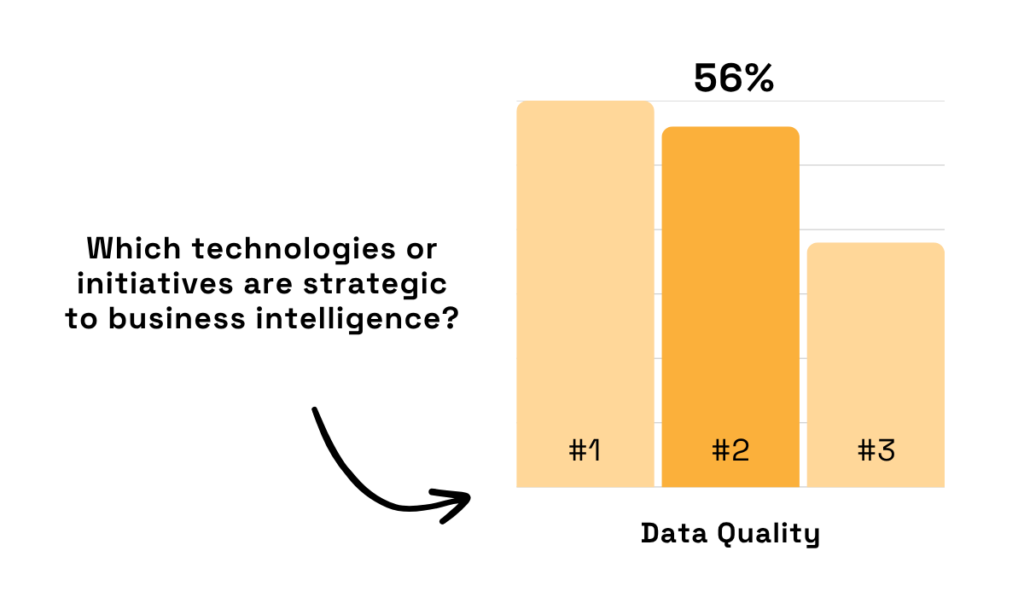
Illustration: Veridion / Data: Dresner Advisory Services
Maintaining this level of quality requires strict data governance and cleansing protocols across all sources.
Insurers increasingly rely on verified third-party data to fill gaps, ensure accuracy, and support informed decision-making.
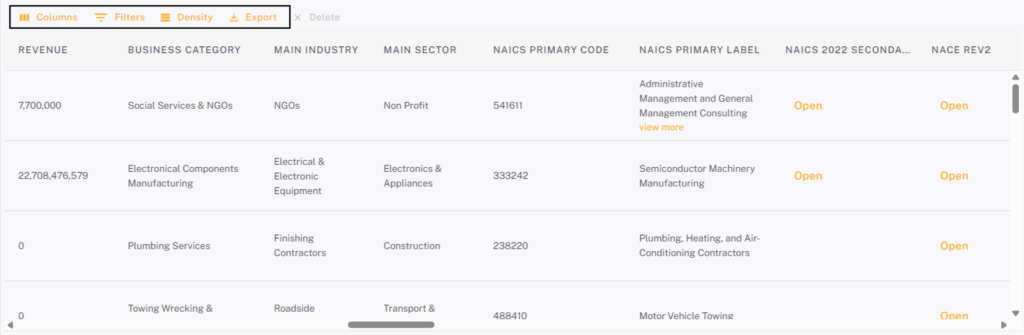
For example, incorporating data from trusted providers like Veridion can enrich underwriting processes with detailed business firmographics, operational activities, industry classifications, and location-specific risk indicators.
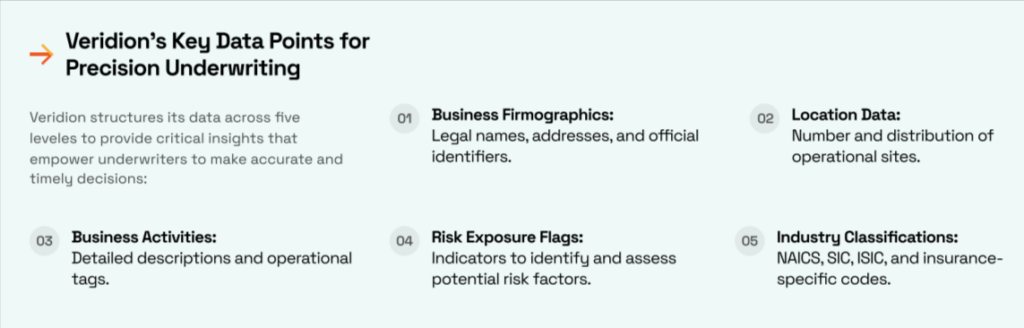
Source: Veridion
Veridion’s weekly updated profiles cover over 136+ million businesses globally, including small and medium enterprises.
And with Veridion’s AI-driven Match & Enrich engine, every new data point will align with existing records while continuously expanding your datasets with relevant, verified insights.
Once the duplicates are eliminated and entries standardized, the only thing that’s left is easy navigation through fresh, in-depth profiles.
Source: Veridion
High-quality data directly translates into better BI outputs, be it more accurate predictive models, reliable risk scoring, or actionable customer insights.
For insurers, investing in data quality is not optional, and without the right tools, BI initiatives will produce misleading insights, undermining both operational efficiency and strategic decision-making.
With insurers handling vast volumes of sensitive customer and claims information, robust security is a critical concern in BI implementation.
Balancing analytical accessibility with stringent cybersecurity is hard, and recent reports only serve to highlight the stakes.
Namely, 26% of the top 50 UK insurers have inadequate cyber ratings that would prevent them from obtaining cyber insurance themselves.
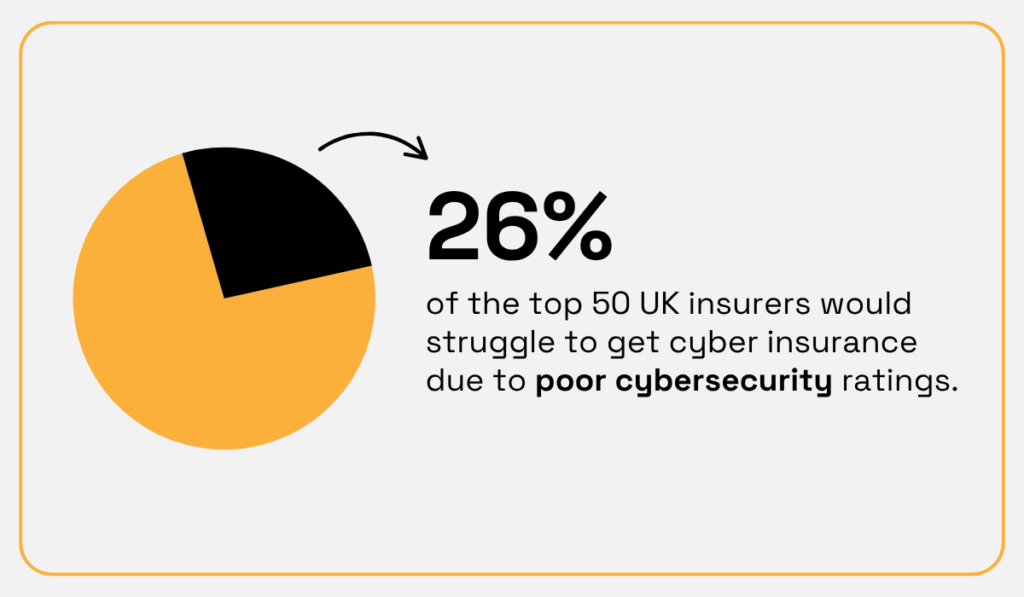
Illustration: Veridion / Data: World Economic Forum & Security Scorecard
Potential vulnerabilities range from unauthorized access and data leaks to regulatory compliance violations.
Meeting these challenges requires more than standard measures such as encryption, role-based access controls, and adherence to data privacy laws like GDPR and HIPAA.
For example, the aforementioned SecurityScorecard report found that 59% of breaches impacting the insurance sector originated from third-party attack vectors.
To address this, carriers are advised to implement strong vendor risk management programs and verify that all partners maintain their own TPRM protocols.
Solutions tailored to the unique risks of insurance operations are also beneficial.
Customizable BI security tools, such as Group-IB, allow insurers to adapt access rules and monitoring controls to their specific risk profiles and regulatory obligations.
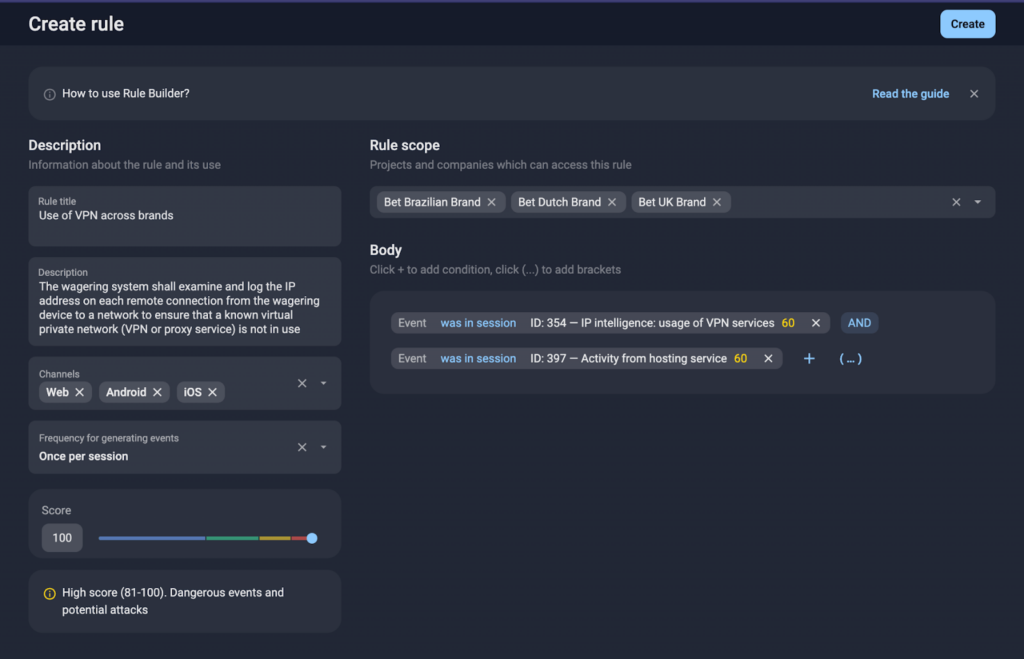
Source: Group-IB
In the end, you want to be able to act quickly, but without exposing sensitive data to internal missteps or external threats.
Approach data security as a critical component to maintaining your organization’s operational integrity, and your insurance BI system will remain a reliable, safe foundation for decision-making.
Insurance BI immediately brings to mind dashboards or predictive models, but its structured capability to turn disparate data into foresight is much more than that.
From advanced analytics powering claims forecasting to robust data governance and security protecting both decisions and customers, every component contributes to operational resilience and strategic advantage.
Insurers that overcome integration, quality, and security challenges, while linking BI to measurable outcomes, gain the agility to act decisively in an increasingly competitive, tightly regulated market.
Our key takeaway?
Being ready for tomorrow means identifying how BI can secure immediate wins and lasting value for your organization today.