
Blog
Quantitative Risk Assessment: A Quick Guide
By: Auras Tanase -
25 March 2026


We love our data, and now that you're here, you're one step closer to loving it too.
A wide sample of data, so you can explore what is possible with our data
Choose ->
built with procurement in mind. Focused on manufacturers, products and more
Choose ->
built with insurance in mind. Focused on classifications, business activity tags and more
Choose ->
built with sustainability in mind. Focused on sustainability commitments, and environmental and social governance insights.
Choose ->
built with strategic insights in mind. Focused on market trends, competitor analysis, and industry-specific data
Choose ->

Keep up to date with our technology, what our clients are doing and get interesting monthly market insights.

Key Takeaways:
Uncertainty is a given in modern businesses of all kinds.
What separates resilient organizations from fragile ones, though, is how clearly they understand risk before it materializes.
And it goes without saying that to do this, you can’t just rely on intuition. Supply chains now stretch globally, and operational complexity is ever-growing.
Executives, thus, need a way to compare risks objectively, allocate resources rationally, and justify decisions with solid data.
That’s where quantitative risk assessment swoops in. Here’s a quick guide on all things QRA.
Quantitative risk assessment (QRA) is a structured method for evaluating risk using numerical values rather than descriptive labels alone.
So instead of classifying risks as simply “high” or “low,” QRA assigns measurable estimates to both the likelihood of an event and the severity of its impact.
This approach then translates into data points that can be modeled, compared, and prioritized.
So your high-stakes decisions are based on probability and potential loss, not perception or instinct.
As Douglas W. Hubbard, a leading thinker in quantitative decision science, puts it:
“Understanding how to measure uncertainty is key to measuring risk. Understanding risk in a quantitative sense is key to understanding how to compute the value of information. Understanding the value of information tells us what to measure and about how much effort we should put into measuring it.”
In practice, QRA looks at how often a risk might occur and what it would cost if it did.
And “cost” can mean anything from actual financial losses to operational downtime, regulatory penalties, or reputational damage.
Now, as you probably know, trade-offs are often unavoidable in large companies.
That’s why expressing risk in numbers can prove so valuable: you’re ranking threats objectively and focusing mitigation efforts where they matter most.
Insurance companies, for example, rely on QRA for underwriting and pricing.
Cybersecurity teams use it to estimate breach impact.
And supply chain leaders apply it to assess supplier disruption and geopolitical exposure.
According to the Center for Internet Security, qualitative risk analysis alone is not sufficient for organizations that need to compare risks, estimate financial impact, or support executive decision-making.
Quantitative methods are required as a complement to qualitative ones to express risk in terms of probability and loss, especially in complex environments.
Let’s look at a quick difference between the two methods:
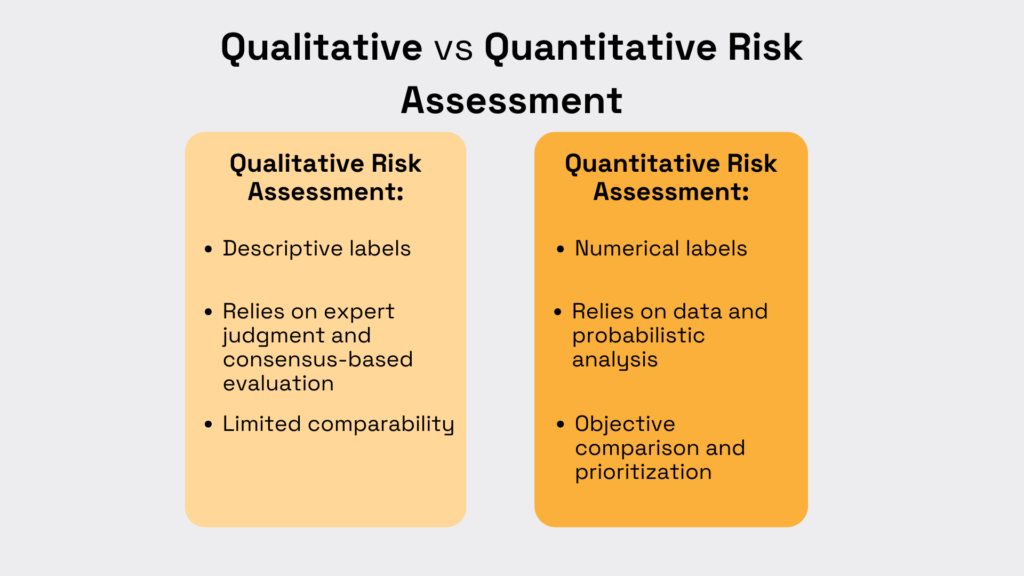
Source: Veridion
Now, let’s take a closer look at the benefits of using QRA.
The greatest value QRA delivers is clarity, which in turn leads to smarter decisions.
Rather than debating perceptions, leadership teams can compare scenarios using the same assumptions and metrics.
This means better prioritization, stronger financial planning, and more resilient strategies.
Here are three key benefits organizations gain from applying QRA.
QRA lets you rank risks based on measurable likelihood and impact. This helps decision-makers focus their attention on the threats that pose the greatest material risk.
When this prioritization fails, the consequences snowball hard.
Take U.S. trading firm Knight Capital Group as a cautionary tale.
In 2012, the company suffered a catastrophic loss of $440 million in less than 45 minutes.
The reason? A simple software deployment error in its automated trading systems.
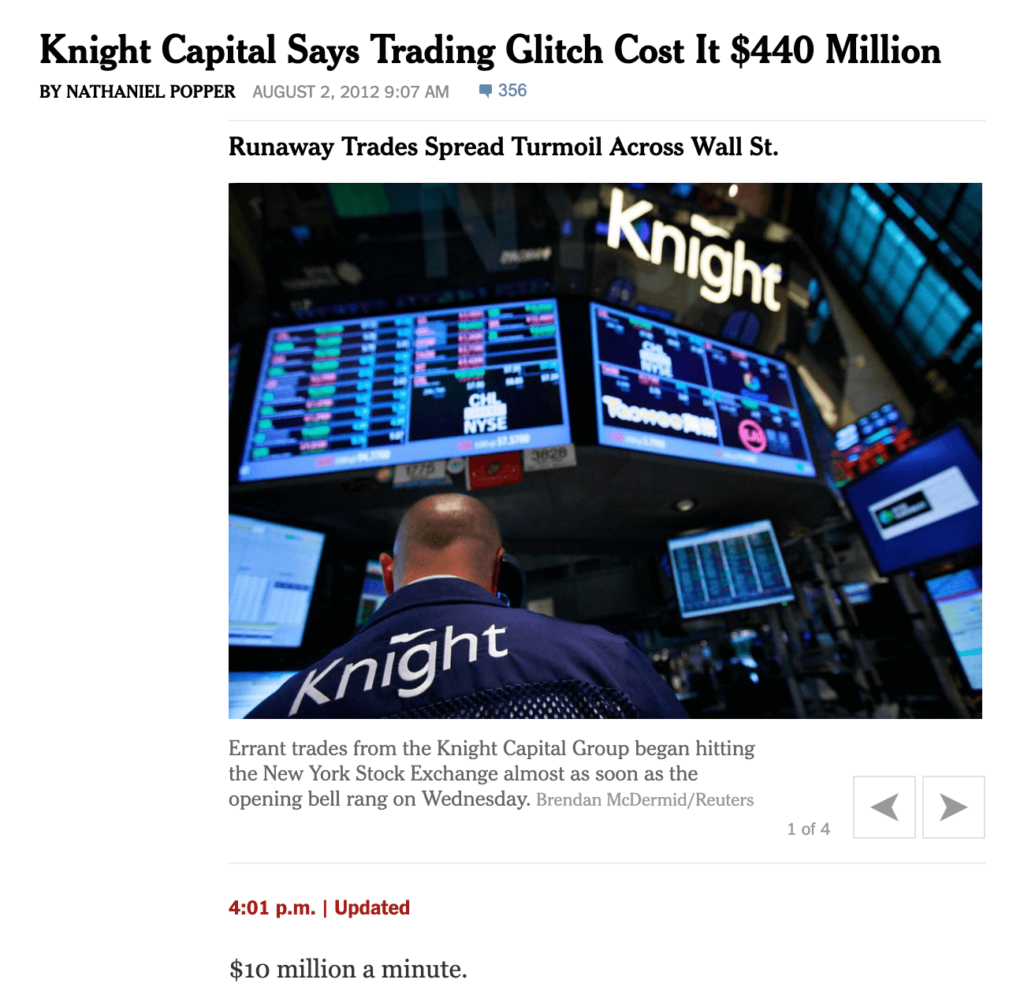
Source: The New York Times
Investigations later showed that Knight Capital lacked the proper controls to prioritize and mitigate operational risk in its automated trading systems.
A legacy code component was accidentally activated during a software update, triggering millions of erroneous trades before the issue was stopped.
What’s worse, the risk was known.
But the firm relied on fragmented controls and qualitative judgment rather than quantified exposure modeling.
Within days, Knight Capital required an emergency bailout and was ultimately acquired.
Quantitative risk assessment addresses this exact issue by estimating probability and potential loss. That way, you can focus investment where downside risk is existential.
Now, you may ask, why not use a simple risk matrix, like the one below?
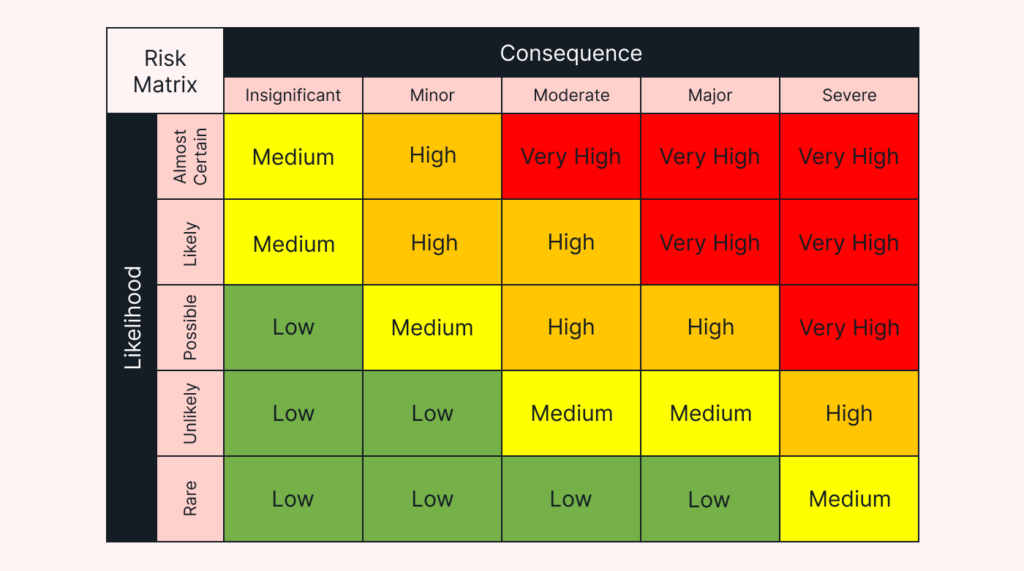
Source: Motion
Well, because a matrix does map risk likelihood against potential impact, but it groups threats into very broad categories.
This can mask huge differences in financial exposure.
QRA complements this by assigning actual numerical values to probability and loss.
These quantified risk scores make it easier to address the right risks, but also to justify mitigation investments to leadership and stakeholders.
Just as valuable is QRA’s ability to connect risk to financial outcomes.
By modeling expected losses, organizations can gain a clearer picture of how risk impacts factors like revenue, margins, or capital requirements.
This means leadership teams can stress-test budgets against disruption scenarios. Without QRA, they would usually rely on best-case assumptions.
In volatile markets, that insight can be the difference between resilience and surprise.
Sometimes, big changes happened in retrospect.
Take Maersk, the Danish shipping line, which was hit by the NotPetya cyberattack in 2017.
This disrupted global operations and, just like in the previous case, caused a stomach-turning revenue loss: $300 million.
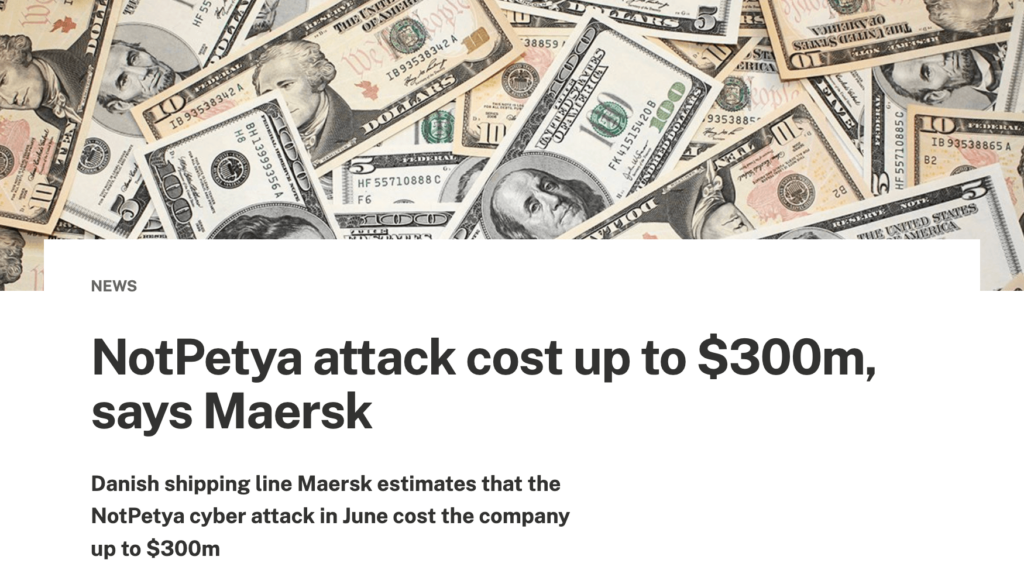
Source: Computer Weekly
The incident turned into a valuable lesson, as it reshaped Maersk’s financial planning.
After the attack, leadership publicly acknowledged the need to better quantify operational and cyber risk in monetary terms, so exposure could be incorporated into capital allocation and contingency planning.
The lesson was clear: when risk is modeled as expected financial loss, resilience investments become vital business decisions.
And this is done across myriad businesses today.
In insurance and financial services, QRA underpins pricing models and reserve calculations. In corporate environments, it supports capital allocation and contingency planning.
And to really drive the point home, IBM’s Cost of a Data Breach Report shows that the average cost of a data breach in 2025 reached $4.4 million.
They also explain that the 9% decrease over last year is due to faster identification and containment.
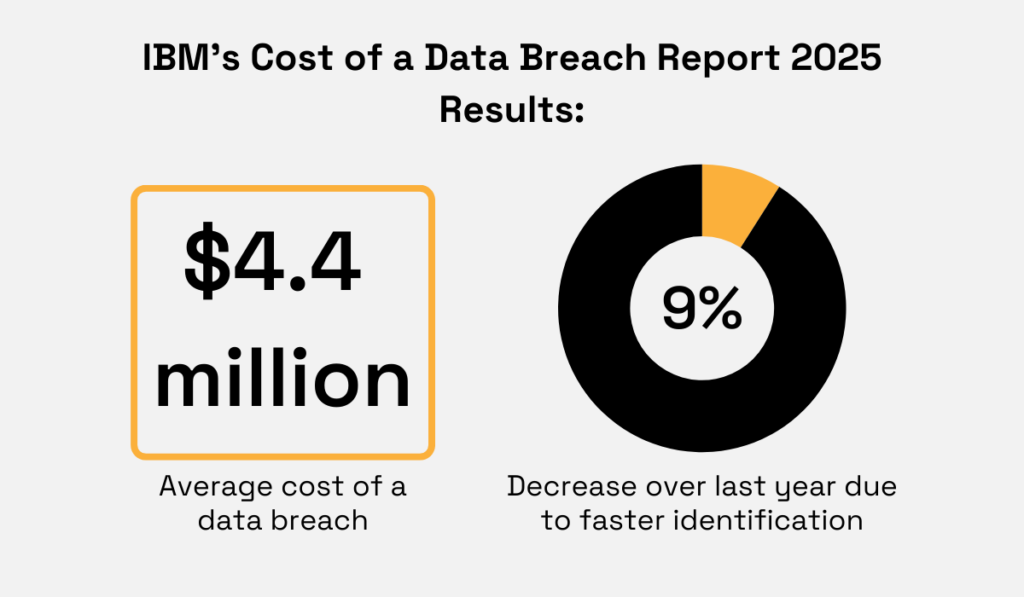
Illustration: Veridion / Data: IBM
That just goes to show why organizations need to model risk in financial terms.
QRA is there to do just that, turning risk into a financial variable that you can plan around.
The last key benefit of QRA done right is that it lets you simulate a very wide range of disruption scenarios.
And that means you can also observe how risks interact with one another. This reveals cascading effects that are often invisible in simpler assessments.
For example, a supplier disruption might trigger production delays, which then affect revenue, customer retention, and contractual penalties.
QRA makes all these interdependencies clear and detailed.
Scenario analysis is thus vital when risks do not exist in isolation.
Many organizations struggle not because they fail to identify risks, but because they fail to understand how multiple risk drivers interact under constantly changing conditions.
This PwC survey of over 3,500 global risk executives shows the most common challenges they face in risk management:
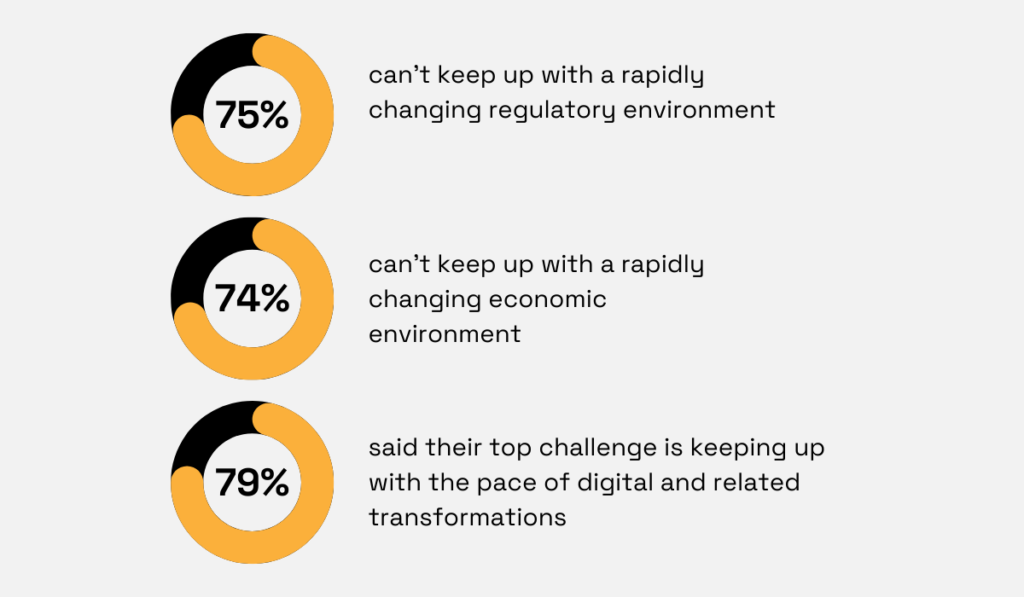
Illustration: Veridion / Data: PwC
And there’s a special emphasis on “rapidly changing.” Risk today is driven by speed and compounding uncertainty.
Andy Grove, former CEO of Intel, had a really good reflection on this:
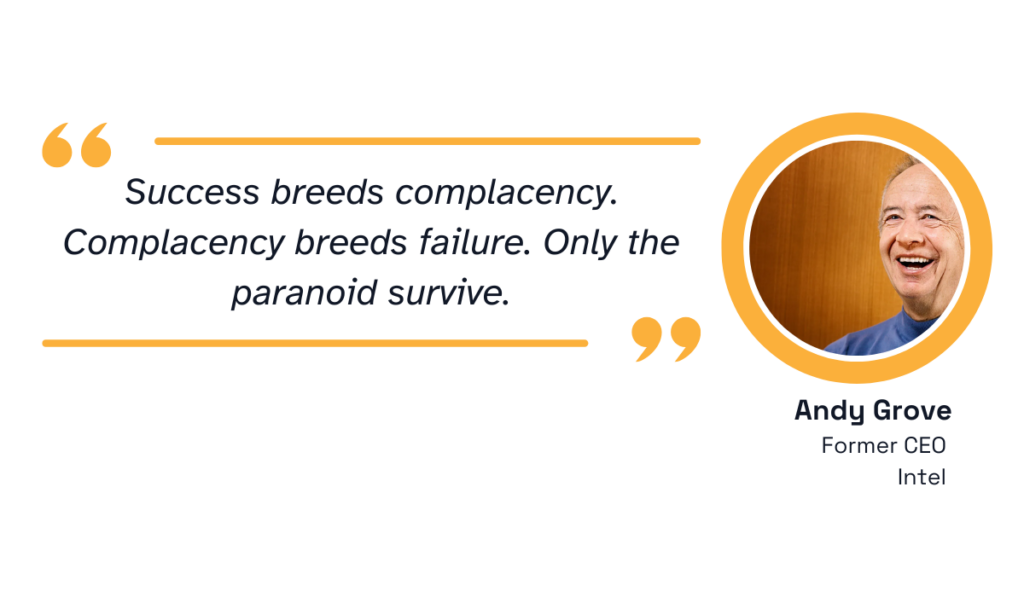
Illustration: Veridion / Quote: Esquire
Of course, paranoia is mentioned as a touch of humor. Let’s replace it with vigilance.
Scenario modeling addresses this uncertainty by testing multiple futures at once. This way, leaders can choose mitigation strategies that improve resilience.
By testing scenarios before they occur, organizations are able to respond decisively rather than reactively.
QRA can vary by industry, but strong frameworks share a common structure.
Each element builds on the previous one, and it’s there to make sure outputs are grounded in data.
A solid QRA starts with understanding what needs protection, then identifies what could go wrong, and finally, it measures how likely and severe those outcomes might be.
Let’s break it down.
The foundation of QRA is a thorough inventory of assets.
These can include facilities, suppliers, infrastructure, systems, or business units. All of these will be critical to operations and financial performance.
Each asset must be clearly defined and contextualized:
Without this context, even the most sophisticated risk models rest on shaky ground.
Missing suppliers, duplicated records, outdated locations, or misclassified business activities can easily lead to underestimated exposure.
Sometimes, concentration risk can be overlooked entirely.
And imagine how this issue grows for an enterprise that manages oodles of suppliers across myriad jurisdictions, where data is fragmented across procurement, finance, compliance, and third-party systems.
This is where enriched asset intelligence becomes critical.
So let’s talk Veridion.
Veridion strengthens asset inventories by matching and enriching company records with verified firmographic, product-level, and location intelligence.
It uses minimal inputs (like company name and country) to normalize identifiers like addresses, registry IDs, websites, and phone numbers.
Then, it returns a unified, enriched company profile.
Here’s what you can expect using Veridion’s Data Enrichment Service:
| Continuous Cycle | Description |
|---|---|
| Normalize | Identify duplicates, standardize data, and roll suppliers to parent entities. |
| Enrich & Update | Enrich and update each supplier with attributes such as contact information, locations, names, products & services, sustainability information, tax ID, etc. |
| Classify | Classify suppliers by industry classifications, geographies, diversity ownership, etc. |
| Validate and Monitor | Validate supplier records to ensure accuracy and continually monitor for changes. |
For QRA, this enables far more precise exposure modeling and impact calculations.
Asset inventories can be validated across jurisdictions and linked to actual products and services sold.
And here’s one of Veridion’s biggest selling points: data is continuously refreshed as supplier conditions change.
Source: Veridion
With cleaner, deduplicated, and fresh asset data, quantitative risk outputs become meaningfully more reliable.
When leadership can trust the asset inventory, they can trust the risk numbers built on top of it.
Once assets are clearly defined, QRA works to identify threats that could affect them.
Think natural hazards, cyber incidents, operational failures, regulatory changes, or supplier disruptions.
Large enterprises know failures can cascade quickly, so more and more of them are putting serious resources into identifying specific threats early.
Take Netflix’s Chaos Monkey program, as explained by Medium:
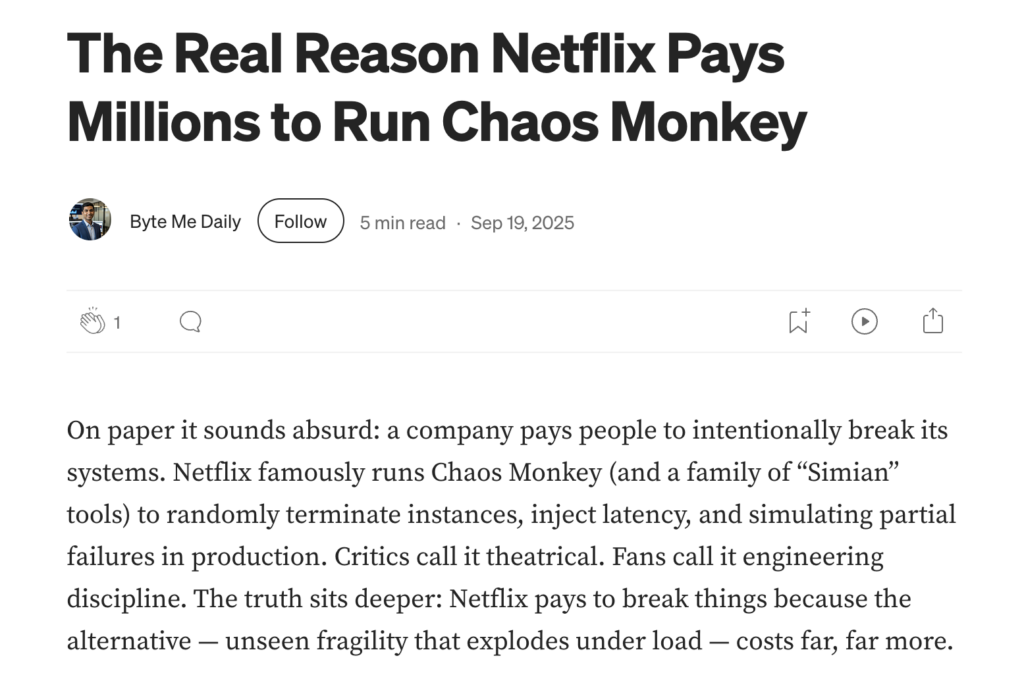
Source: Medium
Chaos Monkey deliberately simulates specific failure modes to flag hidden operational threats before they cause outages and millions in damage.
Now, to do this, each and every threat must be explicitly defined. Vague categories produce unreliable results.
For example, “supplier risk” is not a threat on its own.
A clearly defined threat might be, for instance, “single-source supplier disruption due to geopolitical instability.”
Clear definitions lead to risk assessments that reflect real-world exposure rather than hypothetical or overlapping scenarios.
A clearly defined risk answers four key questions:
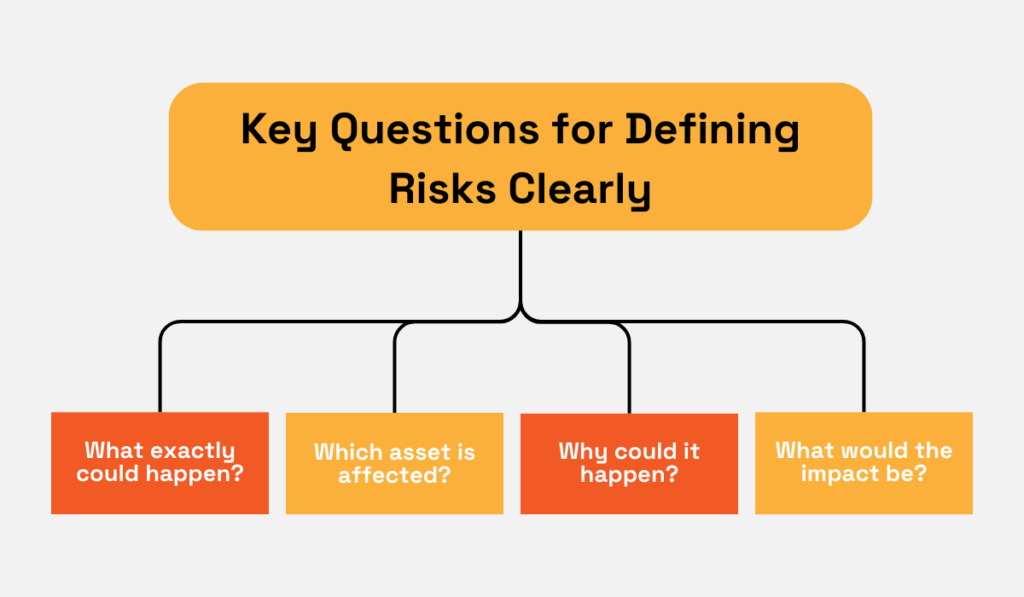
Source: Veridion
Threat identification is about realism, not pessimism.
The goal is to always model plausible events with clear, measurable consequences.
For each asset–threat combination, QRA assigns numerical values to both likelihood and impact.
This is thus the final golden element of QRA, where risk becomes measurable.
Likelihood estimates can be based on factors like historical data, predictive analytics, or probabilistic models.
Impact, on the other hand, can be measured in financial loss, downtime, safety implications, or reputational damage.
The visual below explains these side by side:
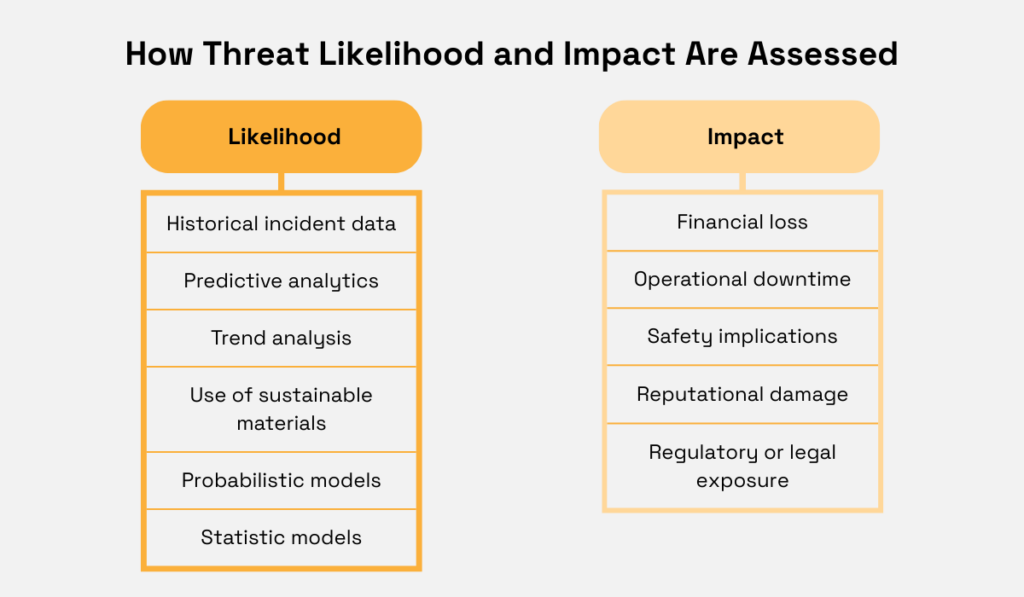
Source: Veridion
These values are then combined to generate risk scores that support objective comparison.
So, for example, you can evaluate a low-probability, high-impact event in parallel to more frequent but less severe risks.
And that’s why combining likelihood and consequence numerically works so well. You’re improving both transparency and repeatability in risk decisions.
According to Tom Thimot, CEO of Supply Wisdom, unpredictability is the modern businesses’ reality today:
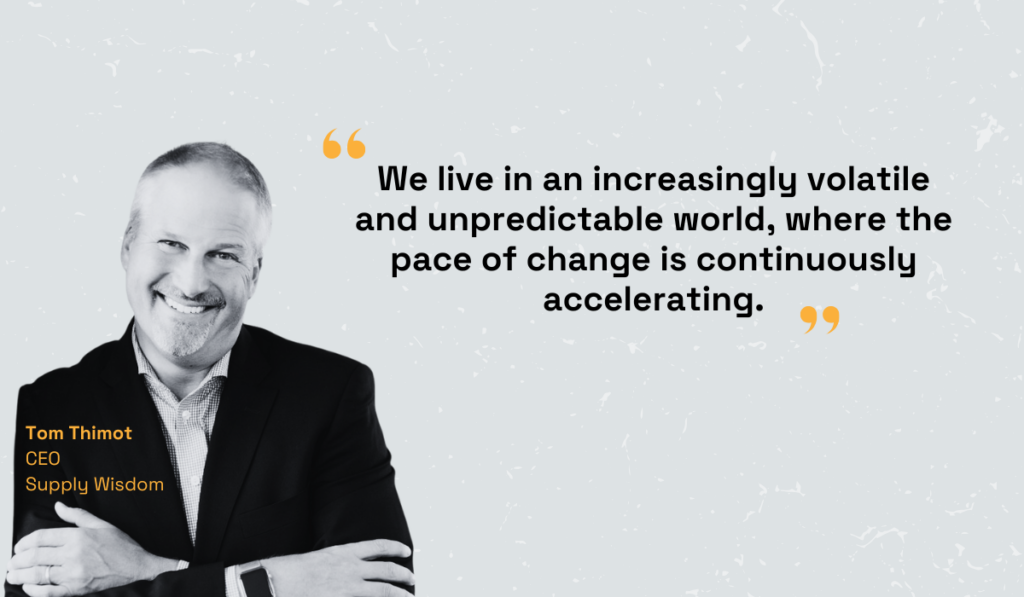
Illustration: Veridion / Quote: Supply & Demand Chain Executive
Adaptation is the only way.
With QRA’s likelihood and impact assessment, you get comparable data points that can be ranked and tracked.
Meaning you can prioritize what risks you need to address first, and how many resources you allocate to each.
And that’s the whole magic of QRA.
You’ve made it to the end!
You’re now equipped to approach QRA with clarity and confidence.
To put this into practice, start small and focused: with your most critical assets, suppliers, or processes. Then, define risks clearly and align on your risk tolerance.
From that point on, everything builds nicely.
QRA isn’t a crystal ball that perfectly predicts the future.
But it can help you make better, smarter decisions with the information you have. And with the right structure in place, you’re well on your way.