
Blog
How to Assess the Criticality of Supplier Logistics Facilities
By: Auras Tanase -
24 February 2026

We love our data, and now that you're here, you're one step closer to loving it too.
A wide sample of data, so you can explore what is possible with our data
Choose ->
built with procurement in mind. Focused on manufacturers, products and more
Choose ->
built with insurance in mind. Focused on classifications, business activity tags and more
Choose ->
built with sustainability in mind. Focused on sustainability commitments, and environmental and social governance insights.
Choose ->
built with strategic insights in mind. Focused on market trends, competitor analysis, and industry-specific data
Choose ->

Keep up to date with our technology, what our clients are doing and get interesting monthly market insights.

Key Takeaways:
You probably track your most critical suppliers closely.
But do you actually track all the locations they operate from?
In many supply chains, a single warehouse, distribution center, or logistics hub quietly becomes the linchpin of everything downstream, until something goes wrong.
And when it does, the impact is rarely contained to one region or one customer.
If you want to understand real supply chain risk, you need to look beyond suppliers and start assessing the criticality of their logistics facilities.
Here’s how to do it, step by step.
Start with a simple question: what does this facility actually do?
A warehouse is never “just a warehouse.”
One facility might be a peripheral storage location, supporting a single customer, contract, or region.
Another might function as a regional distribution hub, a cross-dock, or a central consolidation point that feeds inventory into multiple markets at once.
On paper, these sites can look nearly identical. They may have similar square footage, headcount, or even reported revenue.
In practice, their importance to your supply chain can be worlds apart.
That’s why the first step is mapping a facility’s function within the supplier’s broader logistics architecture.
You need to understand the basics of how a facility operates and how it connects to everything else:
Is it upstream or downstream? Does it aggregate volume from multiple suppliers? Does it distribute inventory to dozens or hundreds of customers?
Facilities that act as primary hubs or consolidation points tend to be far more critical than peripheral or single-customer sites.
So, when they fail, disruption hits the entire supply chain.
The 2018 KFC chicken shortage in the UK is a textbook example.
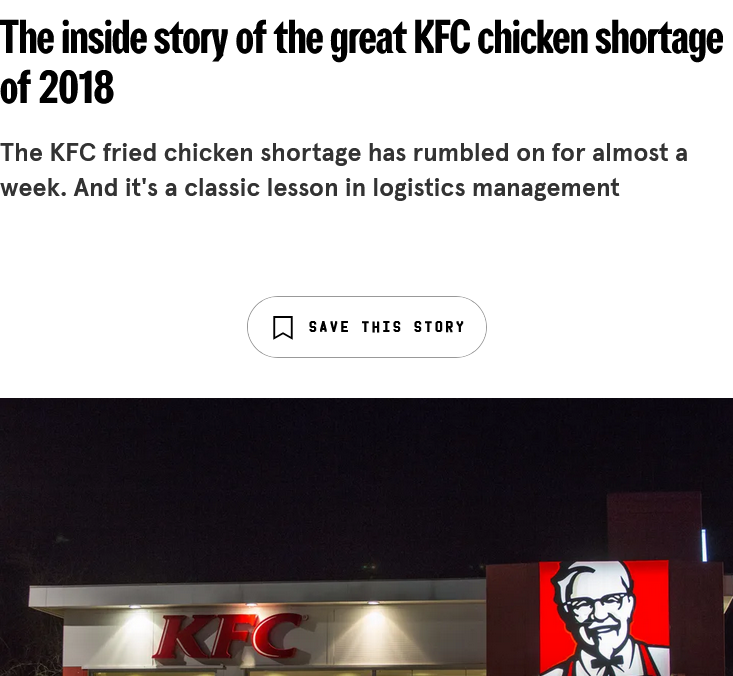
Source: Wired
In early 2018, KFC switched its UK logistics provider from Bidvest, which operated a distributed network of six regional warehouses, to DHL.
Under the new model, DHL consolidated almost the entire UK distribution operation into a single, centralized depot in Rugby.
That facility effectively became the primary hub supplying chicken to nearly all KFC restaurants across the country.
Just days after the transition, the model broke down:
With no alternative distribution nodes to absorb the disruption, deliveries stopped immediately.
Within three days, more than two-thirds of KFC’s UK restaurants were forced to close.
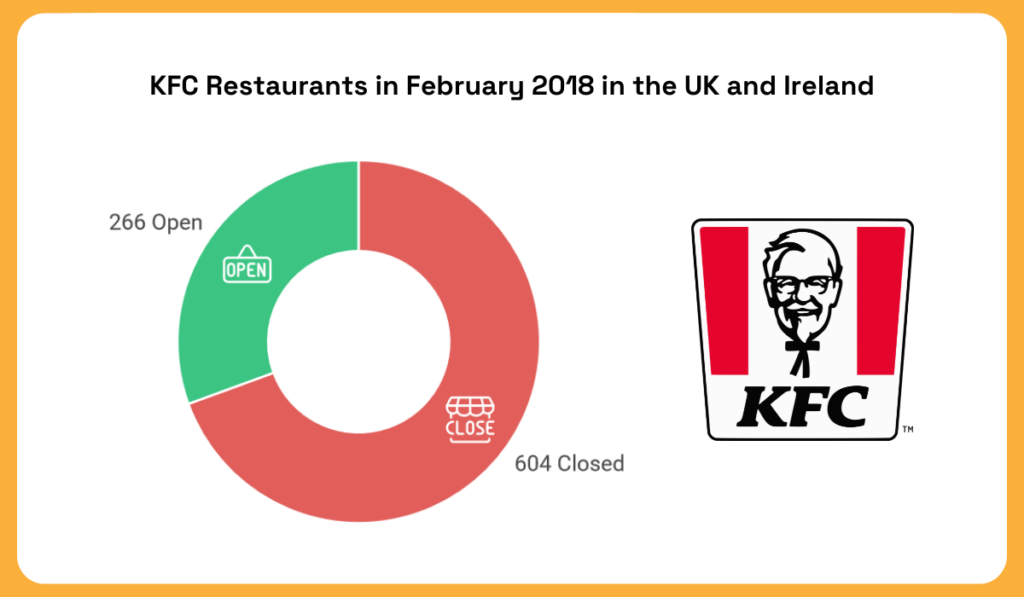
Illustration: Veridion / Data: Wired
Truckloads of chicken spoiled, inventory visibility collapsed, and a problem that began at a single site cascaded across the entire national network.
KFC ultimately had to bring parts of the operation back to its former provider to stabilize supply.
The failure wasn’t the chicken supply. It was a misunderstanding of the facility’s role.
A single depot had quietly become mission-critical to the entire UK operation, but it was treated like a standard logistics site rather than a single point of failure.
Without the risk controls, redundancy, and readiness such a role demands, a localized disruption escalated into a national crisis.
Once you understand what a facility is, the next question you have to answer is: how much actually flows through it?
Throughput tells you how much business, value, and operational pressure is concentrated in a single location over time.
It’s one of the clearest indicators of how quickly a disruption will spread once a facility is impaired.
Again, two warehouses can look identical on paper.
But if one processes ten times the shipment volume, turns inventory twice as fast, or operates continuously near capacity, it is far more critical to your operations than the other.
This is why you need to assess the following data:
Not just averages, but how hard the facility is working day to day, and how much buffer exists when something goes wrong.
A site that runs comfortably below capacity can absorb shocks. A site that is constantly operating at the limit cannot.
A real-world illustration of this can be seen in MEKO, one of the leading automotive spare-parts chains in Northern Europe, and its central distribution facility in Strängnäs, Sweden.
Source: TGW Logistics on YouTube
As part of a network optimization effort, two distribution centers were consolidated into a single, 30,000-square-meter warehouse.
The site now receives roughly 300 inbound pallets per day, serves around 260 customers daily, and supplies the entire Scandinavian market.
Approximately 70% of outbound volume flows through automated systems designed for high-speed, high-volume operation.
From an efficiency standpoint, the consolidation delivered clear benefits.
From a risk perspective, however, it also concentrated throughput.
What was once spread across two facilities is now routed through a single logistics node.
That means any disruption, whether an automation failure, WMS outage, labor issue, or external incident, would immediately affect hundreds of customers across multiple countries.
The facility’s criticality is not defined by its size or technology, but by the sheer volume of daily flows passing through it.
The same principle explains why events like the 2021 Suez Canal blockage were so disruptive.
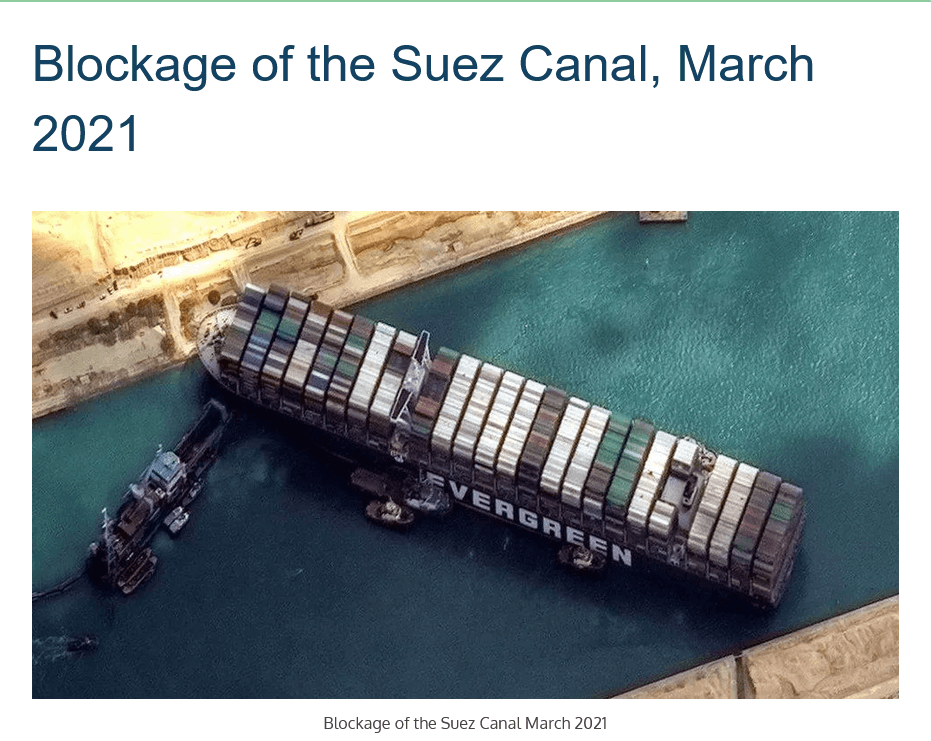
Source: Port Economics, Management and Policy
The canal wasn’t critical because it was complex or unique; it was critical because an enormous share of global trade flowed through it every day.
When throughput stopped, the impact cascaded across regions and industries almost instantly.
At the supplier level, the logic is identical.
A high-throughput logistics facility becomes a force multiplier for both efficiency and risk.
When it operates smoothly, it enables scale. When it fails, the speed and breadth of disruption reveal just how much it depended on that single site.
In short, if you don’t quantify how much is moving through a logistics facility, you will consistently underestimate how much damage even a short disruption can cause.
An equally important factor in determining a facility’s criticality is knowing who depends on that site.
Customer dependency can make a facility critical even if it isn’t the biggest or busiest site.
A moderately sized warehouse that handles a few high-revenue clients or time-sensitive products can be far more important than a larger facility serving many lower-revenue customers.
Why does this matter?
Because a disruption doesn’t affect all customers equally.
If a warehouse serving dozens of small accounts goes offline, the impact is limited.
But if a single facility supports a few key clients, any hiccup can ripple quickly: delays, missed deliveries, and potentially serious financial or operational consequences.
Look at GXO Logistics, for example.
They’re a global leader in supply chain solutions, and roughly 30% of Fortune 100 companies rely on them for critical logistics services.
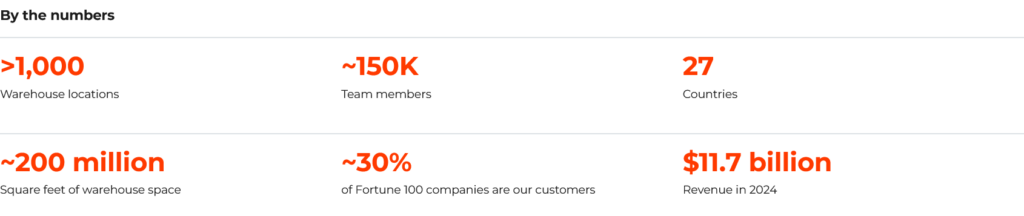
Source: GXO
Any high-throughput facility in GXO’s network that handles multiple top-tier clients would be extremely critical.
A disruption there, even short-lived, could affect dozens of major customers at the same time.
To really assess customer dependency, you need clear data on:
When you combine this with what the facility does and how much it handles, you get a fuller picture of its criticality.
A warehouse that looks routine on paper can actually be a linchpin in the supply chain, all because of who relies on it.
Can the facility be replaced, bypassed, or scaled up quickly if something goes wrong?
This is what we mean by substitutability.
A site may look like “just another warehouse,” but if there’s no practical alternative, it becomes a single point of failure.
Why does that matter?
Well, when alternatives are limited, even short disruptions can have an enormous impact.
In 2025, a cyberattack on United Natural Foods—a major food distributor supplying retailers like Whole Foods—took internal systems offline, leaving warehouses unable to process orders and leading to empty supermarket shelves in multiple regions.
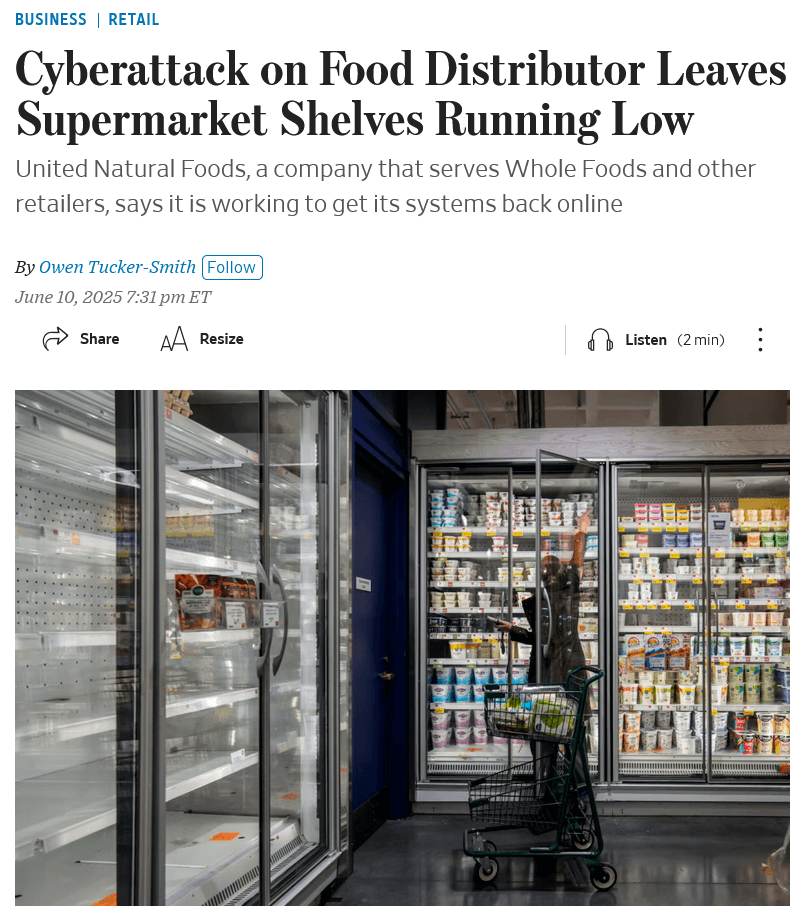
Source: WSJ
Because there weren’t any readily available alternatives within the distributor’s network to pick up the slack, the effects rippled quickly from one facility into the broader retail ecosystem.
Similarly, the 2024 collapse of the Francis Scott Key Bridge in Baltimore blocked access to most of the Port of Baltimore’s terminals, forcing shippers and automakers to divert cargo to other ports that couldn’t handle the same volume or facilities.
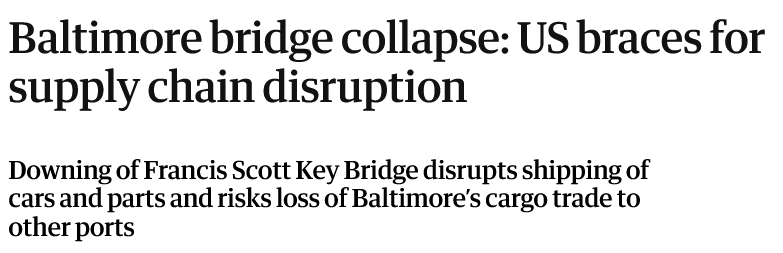
Source: The Guardian
The lack of immediate, equivalent alternatives showed how limited substitutability at a critical logistics hub translates into costly rerouting and logistical complexity.
Evaluating substitutability means mapping out backup facilities, available capacity, rerouting times, and constraints well before a disruption hits.
So, to assess substitutability, look at information like the following:
Overall, the harder a facility is to substitute, the more critical it is, and the more carefully you need to manage that risk.
Not all warehouses or distribution centers are created equal.
Two facilities may be similar in size and throughput, but one can be far more critical if it handles specialized operations.
Understanding this is key to assessing supplier logistics facilities.
Specialization can take many forms:
Facilities with these capabilities are harder to replace, slower to reroute, and riskier if disrupted, and even a short outage can have consequences.
One example of operational specialization is the Pfizer COVID-19 vaccine distribution.
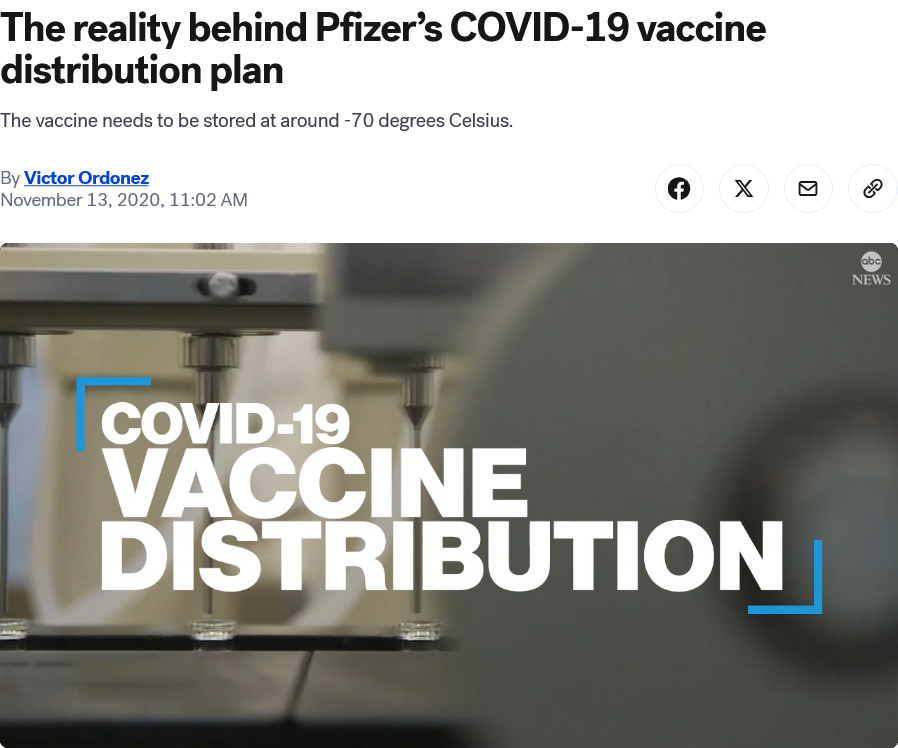
Source: ABC News
The vaccine had to be stored at -70 °C, far colder than standard vaccines, and existing refrigeration networks simply couldn’t substitute.
Every step required specialized equipment, trained personnel, and careful monitoring to prevent spoilage.
As one report noted:
“The distribution and storage of the Pfizer vaccine will be technically challenging and require new equipment and protocols on an unprecedented scale.”
The takeaway is simple: the more specialized a facility, the higher its criticality.
When evaluating supplier logistics facilities, ask:
Understanding these constraints will help you anticipate where disruptions have the most severe consequences, and inform contingency planning, supplier selection, and risk mitigation.
Even the best-run, highly specialized facility can become a major risk if it’s located in a hazard-prone area.
That’s why environmental exposure is the final piece when assessing a supplier logistics facility’s criticality.
Ask yourself:
Brian Gumbel, President and COO at Dataminr, points out how important the latter is:
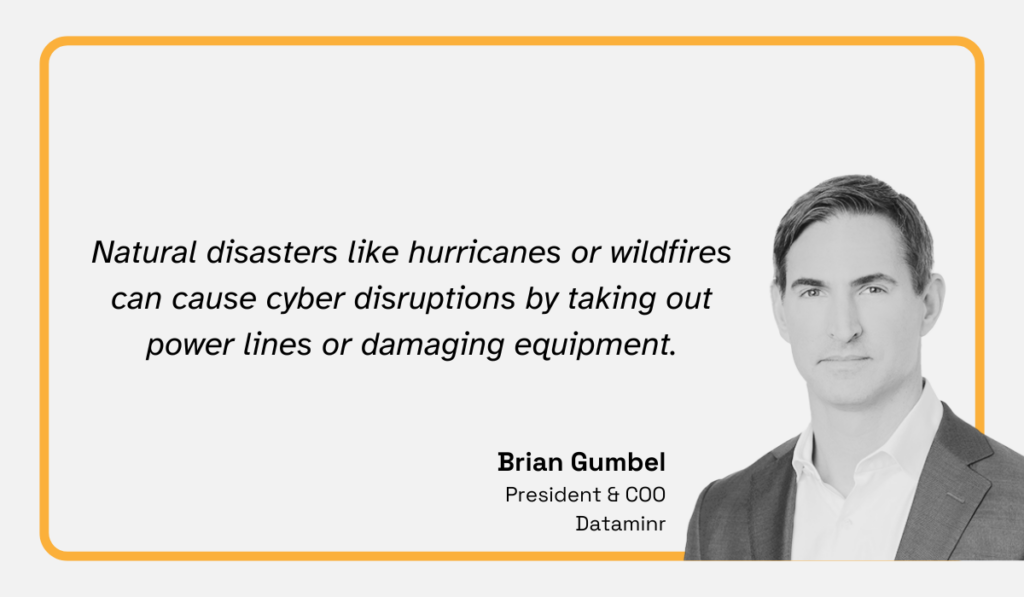
Illustration: Veridion / Quote: Big Think
A well-known example of environmental risk exposure is the 2011 Fukushima earthquake and tsunami in Japan.
The disaster damaged ports, warehouses, and transport infrastructure in the northeast, severely disrupting logistics.
Even companies with diversified suppliers struggled, not because they lacked options, but because logistics capacity was concentrated in high-risk regions.
Recovery depended as much on roads and ports as on factories themselves.
The key takeaway here is that a facility becomes more critical when high dependency and environmental risk overlap.
A single hub in a hazard-prone area can be a systemic vulnerability, even in otherwise diversified supply chains.
This is why you need up-to-date, verified supplier location intelligence to understand where your critical facilities are, how dependent you are on them, and what environmental risks could turn them into single points of failure.
And that’s precisely how Veridion can help you.
By now, it’s clear that assessing supplier logistics criticality requires a holistic view of a facility.
Source: Veridion
To do that at scale, you need verified, current, location-level intelligence, combined with operational and financial insights.
That’s exactly what Veridion, our big data platform, delivers.
Veridion covers millions of companies across 190+ countries, giving procurement and supply chain teams a real-world picture of how supplier facilities operate and how critical they truly are.
Here are Veridion’s capabilities that make this possible:
| Location intelligence | Every facility is mapped with precise addresses, geo-coordinates, and type (warehouse, distribution hub, factory, fulfillment center) |
| Operational intelligence | Veridion shows whether a site is active, its role in the supplier network, connections to other facilities, and throughput levels |
| Financial insights | Revenue estimates, workforce size, and key customers tied to a location help you assess dependency and financial exposure |
| Substitutability analysis | Veridion identifies alternative facilities, nearby backups, and network redundancies |
| AI and ML‑driven verification | Proprietary models extract, normalize, and validate data from company filings, websites, news, and other sources |
For example, on paper, General Motors’ Canadian parts distribution hub looked like a standard warehouse with moderate revenue.
But Veridion’s rich facility profile revealed it was actually a 22,000 m² primary hub feeding GM’s entire Canadian network, with 22.5 million in revenue and 120 employees.
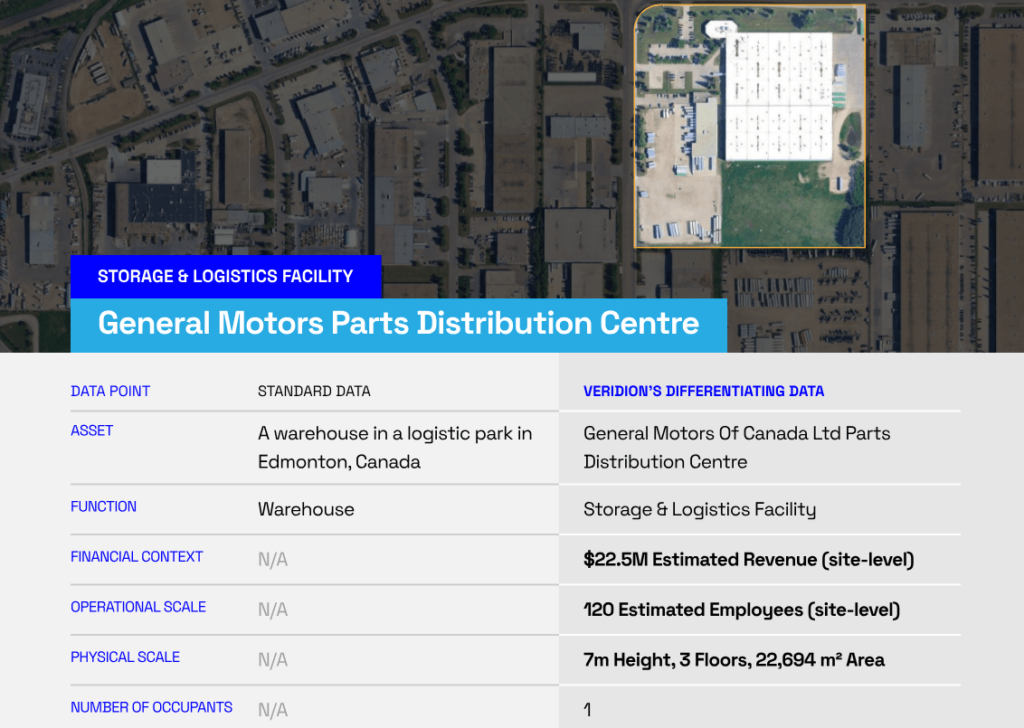
Source: Veridion
Even a 48-hour outage could have triggered cascading backlogs nationwide.
Another example shows how Veridion’s AI-powered analysis overlayed climate hazard maps with tens of thousands of supply chain sites.
In the UK, for example, it found that nearly 5% of essential infrastructure is exposed to intensifying weather risks, including 604 logistics hubs (4%).
In the Cardiff corridor, for instance, 10% of regional consumer goods storage sits in areas vulnerable to climate hazards.
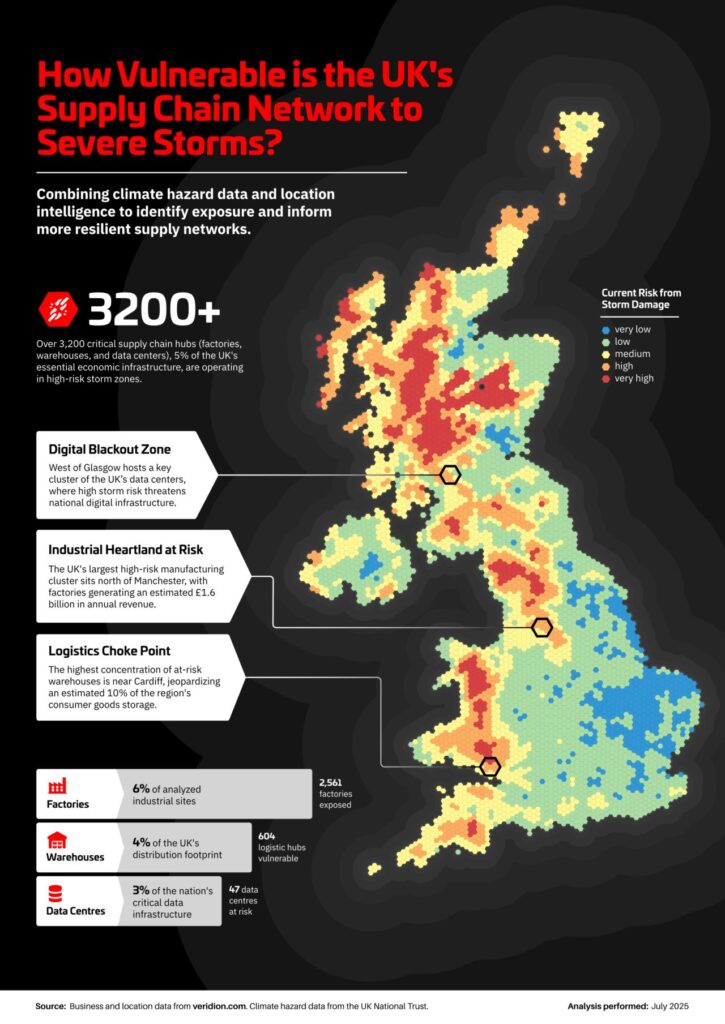
Source: Veridion on LinkedIn
With Veridion’s rich and updated company profiles, you can understand every supplier logistics facility’s role, risk, and operational criticality.
That lets you spot hidden vulnerabilities, anticipate disruptions, and make confident, strategic decisions across your supply chain network.
You can prevent risk only if you understand where it hides.
To do that, you need to assess the criticality of supplier logistics facilities.
By assessing the facility’s role, throughput, customer dependency, substitutability, specialization, and environmental risk, and combining these insights with verified location intelligence, you can do that successfully.
Use the best data you can get!