
Blog
Key Metrics to Track During Supplier Onboarding
By: Auras Tanase -
13 May 2025


We love our data, and now that you're here, you're one step closer to loving it too.
A wide sample of data, so you can explore what is possible with our data
Choose ->
built with procurement in mind. Focused on manufacturers, products and more
Choose ->
built with insurance in mind. Focused on classifications, business activity tags and more
Choose ->
built with sustainability in mind. Focused on sustainability commitments, and environmental and social governance insights.
Choose ->
built with strategic insights in mind. Focused on market trends, competitor analysis, and industry-specific data
Choose ->

Keep up to date with our technology, what our clients are doing and get interesting monthly market insights.

Key Takeaways:
Bringing new suppliers on board is more than just paperwork and system setup.
It’s a complex process that directly impacts the success of your entire procurement strategy.
And like any process, what you don’t measure, you can’t improve.
That’s why tracking the right onboarding metrics matters.
In this guide, we’ll walk you through the most important metrics to help you identify inefficiencies, enhance collaboration, and set your suppliers up for long-term success.
Onboarding cycle time is the umbrella metric that tracks how long it takes your organization to fully onboard a new supplier, from initial identification to final system integration.
Naturally, not all onboarding journeys are the same.
Timelines can vary significantly depending on procurement complexity, industry regulations, supplier criticality, risk level, and more.
To get meaningful insights, you need to consider this variability.
That’s why it’s helpful to break this metric down into key stages.
This way, you can pinpoint delays, set realistic benchmarks, and focus on areas that need improvement.
This metric tracks how long it takes your team to find suitable suppliers—from the moment a procurement need is flagged to the point where eligible candidates receive RFPs or RFQs.
In some cases, long timelines are unavoidable due to market complexity or regulatory demands.
But more often, delays are caused by outdated supplier discovery methods, like manual research, limited databases, and a lack of automation.
These barriers are evident in the average time it takes to complete a supplier search, as estimated by McKinsey.
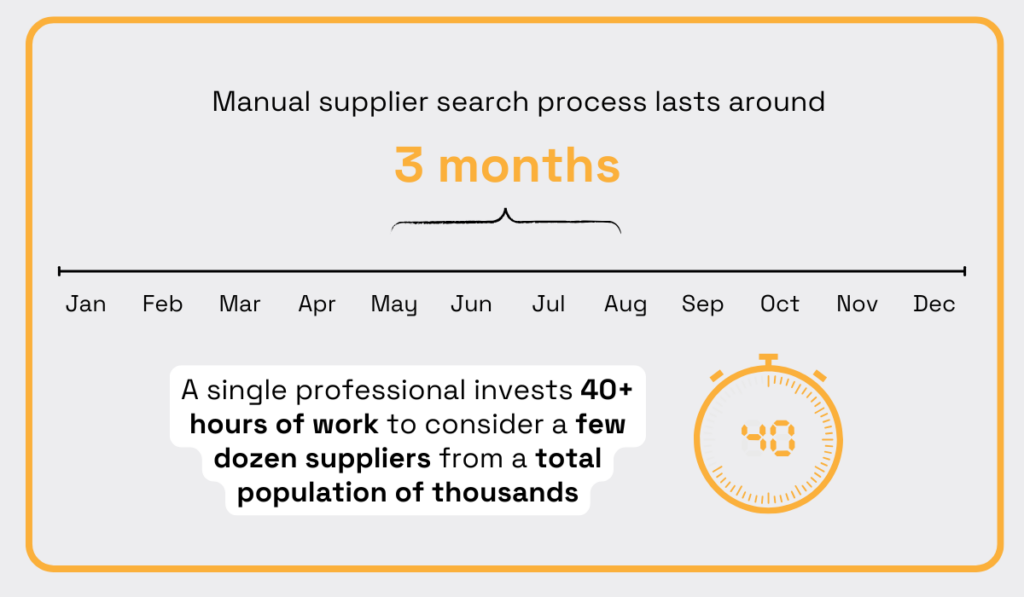
Illustration: Veridion / Data: McKinsey
Manual research is slow, resource-intensive, and typically surfaces only a narrow slice of the supplier landscape.
This metric is relatively easy to track, but make sure to factor in legitimate causes for delays, like complex procurement needs or limited supplier availability.
Now, how can you speed up supplier identification time?
With AI-powered supplier discovery tools that use advanced algorithms to scan global markets in real time.
According to McKinsey, they can reduce identification time by more than 90%.
Veridion is one such platform, offering unmatched global coverage, AI-driven data collection, and natural language search to help you surface the right suppliers in minutes.
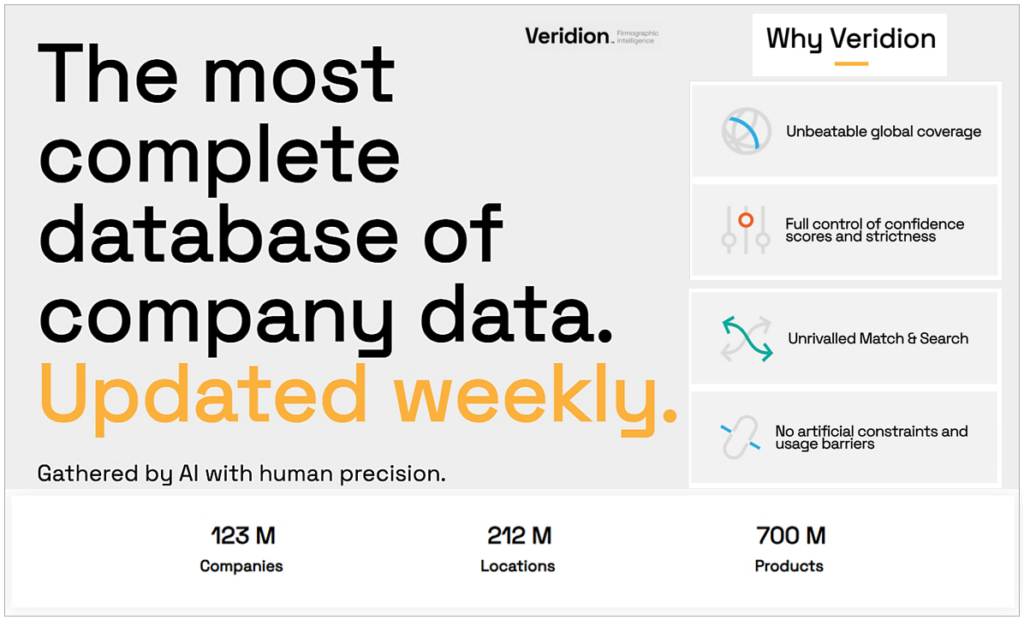
Source: Veridion
So, if long supplier discovery times are slowing down your onboarding process, there’s a clear path forward.
As we’ll see, services like Veridion and other technologies, including internal systems, often play a key role in tracking and optimizing the rest of your onboarding metrics.
Supplier evaluation time is the total duration it takes to assess and qualify potential suppliers, from initial shortlisting to final approval.
This metric encompasses activities such as:
The image below outlines the typical supplier evaluation steps and suggested metrics to track performance at each stage.
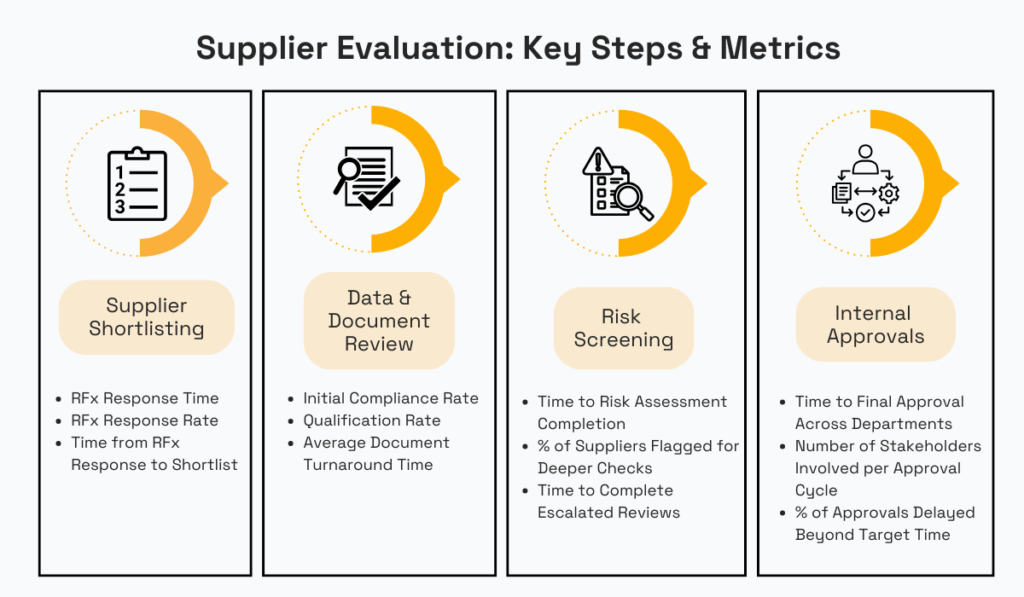
Source: Veridion
For example, RFx Response Rate shows what percentage of invited suppliers actually respond to your RFP or RFQ, indicating how well-targeted your request is.
Similarly, the Initial Compliance Rate reveals how many candidates meet your basic onboarding criteria from the start.
Meanwhile, Time to Risk Assessment Completion tracks how long it takes to finalize due diligence.
And while speed matters, rushing this step can backfire.
A Gartner study found that 83% of legal and compliance leaders identified vendor risks only after due diligence.
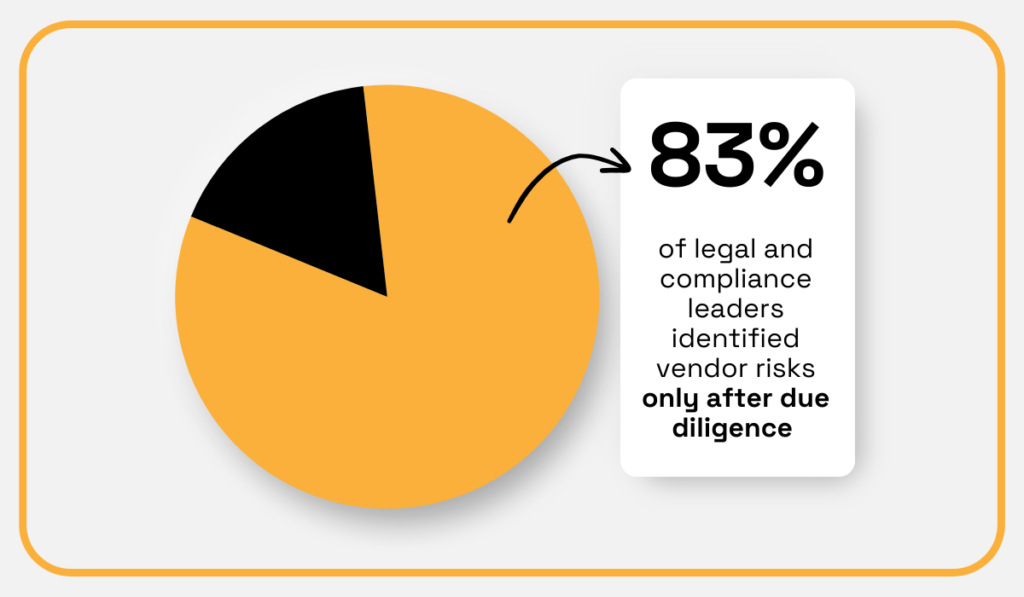
Illustration: Veridion / Data: Gartner
This highlights the importance of setting realistic timelines for risk assessments within your overall supplier evaluation time.
Slow evaluation processes often stem from siloed information, manual risk checks, or unclear decision-making protocols.
Onboarding bottlenecks are also common at this stage due to the involvement of multiple departments, often with different priorities and approaches.
Given all the above, tracking this metric helps pinpoint exactly where evaluations stall.
To improve the evaluation time, organizations should embrace technology, especially tools that centralize supplier data, automate compliance checks, and streamline risk assessments.
This metric tracks how long it takes to move from supplier selection to a signed contract.
Supplier contracting time includes negotiation, legal review, and alignment on commercial terms.
It often requires input from a different set of internal stakeholders than those involved in evaluation.
Of course, delays in this phase can stall onboarding or disrupt urgent timelines.
By tracking this metric, you can pinpoint exactly where slowdowns occur, whether in legal workflows, negotiation rounds, or approval bottlenecks.
The image below outlines several useful sub-metrics to measure and monitor supplier contracting performance:
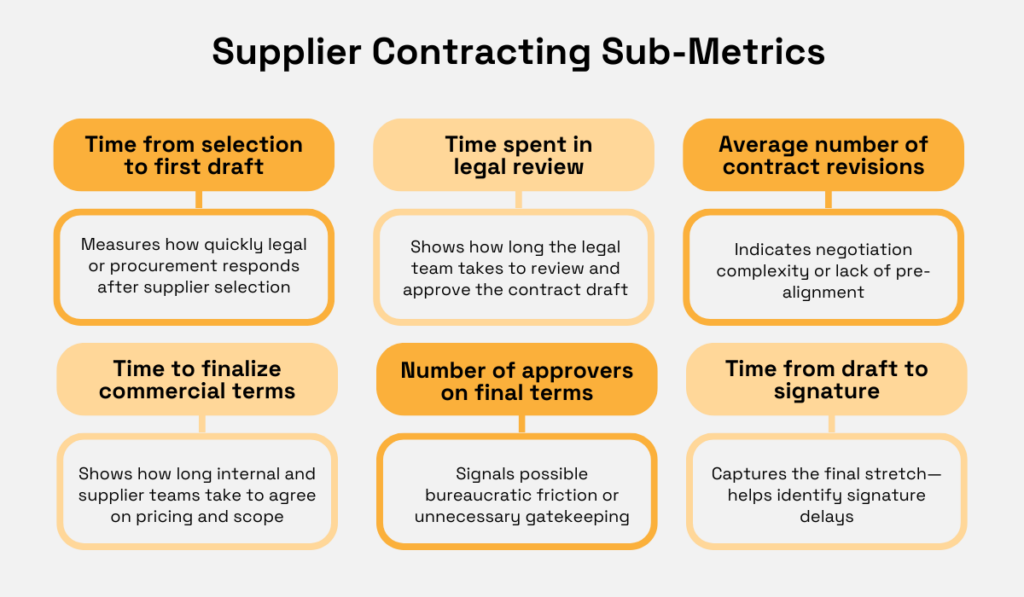
Source: Veridion
Again, it’s important to benchmark carefully and distinguish between simple and complex contracts and negotiations to ensure objective, comparable results.
Both the overall contracting time and its sub-metrics are easiest to track—and improve—using procurement and contract management tools.
Ultimately, monitoring this metric helps procurement teams pinpoint where delays occur and apply the right tools or process changes to streamline contracting.
System integration time tracks how long it takes to set up a new supplier in internal systems, such as ERP, procurement, finance, and inventory platforms, after the contract is signed.
This stage is often considered the actual onboarding phase
The time required for a supplier to become fully transactable and ready for the first delivery can vary widely between organizations, depending on factors like:
As the Reddit comment below shows, this process can take anywhere from minutes to months.
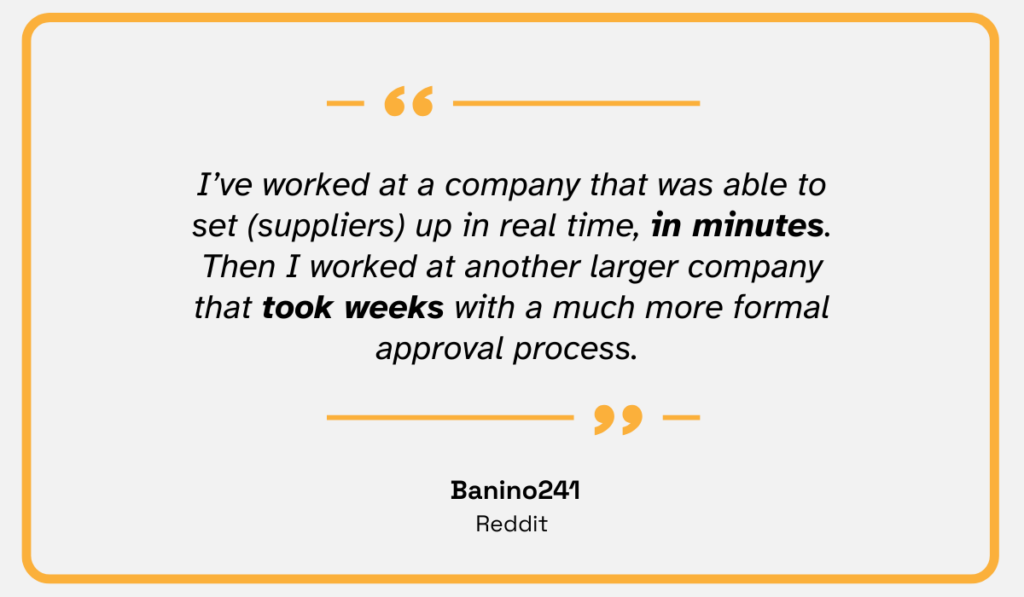
Illustration: Veridion / Quote: Reddit
With this variability in mind, it’s useful to understand what system integration typically involves.
Common tasks—and related sub-metrics worth tracking—include:
Tools that automate data entry, centralize onboarding workflows, or support supplier self-registration can both track and reduce system integration time to a minimum.
By monitoring this metric, your team can benchmark realistic timelines and uncover internal process inefficiencies.
Now that we’ve broken down the key sub-metrics of the onboarding cycle time, let’s turn to other critical onboarding metrics.
Supplier data accuracy rate measures how accurate supplier-provided information is when compared to verified third-party sources or official records.
The goal is to determine what percentage of self-reported data is correct.
Why does this matter?
First, inaccurate data during the evaluation and selection phases can compromise decision-making.
Supplier information that seems legitimate at first may turn out to be false, incomplete, or even fabricated.
That opens the door to serious operational, reputational, and legal risks.
And those risks escalate when companies are under pressure to pivot quickly in response to disruptions like new tariffs, as Myriam Duguay from KPMG Canada warns:
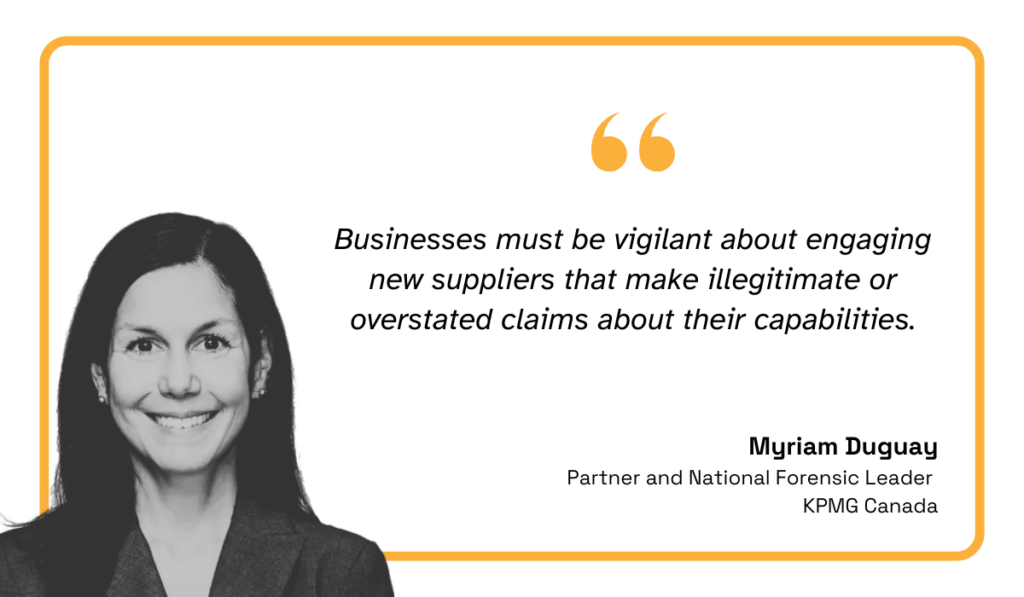
Illustration: Veridion / Quote: KPMG
There are countless cases of companies onboarding suppliers without thoroughly verifying their claims—often at significant cost.
And the damage doesn’t stop at evaluation.
If inaccurate data makes it into your systems during integration, it can cause failed transactions, invoice mismatches, or duplicate records.
This, in turn, slows down operations and drives up costs.
To track the data accuracy rate, procurement teams typically compare supplier-submitted data against:
Ultimately, this metric reflects the strength of your onboarding forms, validation steps, and verification workflows.
The onboarding compliance rate tracks the percentage of suppliers who meet all onboarding-related compliance requirements, such as signed contracts, certifications, codes of conduct, or NDAs, within a set period.
This ensures that procurement and legal standards are met before any transactions begin.
The simplest way to monitor and improve this rate is by using an onboarding platform that automatically tracks documentation status in real time.
HICX is a good example.
With a dashboard like this, you can instantly see which compliance items are still pending—and who’s responsible for the holdup.
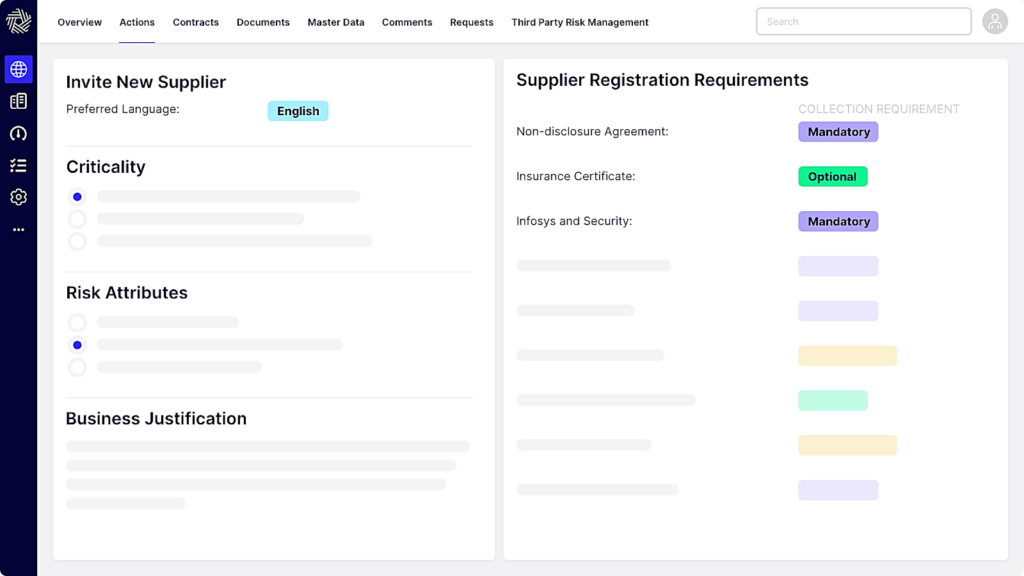
Source: HICX
This visibility helps you identify bottlenecks early, whether they’re caused by supplier delays or internal review slowdowns.
Teams can then send timely reminders, escalate issues when needed, and keep the onboarding process moving.
These tools also make it easy to track compliance rates and timelines across multiple projects, helping teams spot patterns and make data-driven improvements.
The total cost to onboard a supplier is a critical metric, especially for organizations onboarding hundreds or thousands of vendors each year.
It includes direct expenses like:
Manual workflows, such as duplicate data entry, email chains, or collecting documents via spreadsheets, can significantly inflate these costs.
Epiq, for example, used a $90/hour labor rate to estimate how automation affects onboarding costs.
As shown, efficient process design can cut onboarding spend by more than 90%.
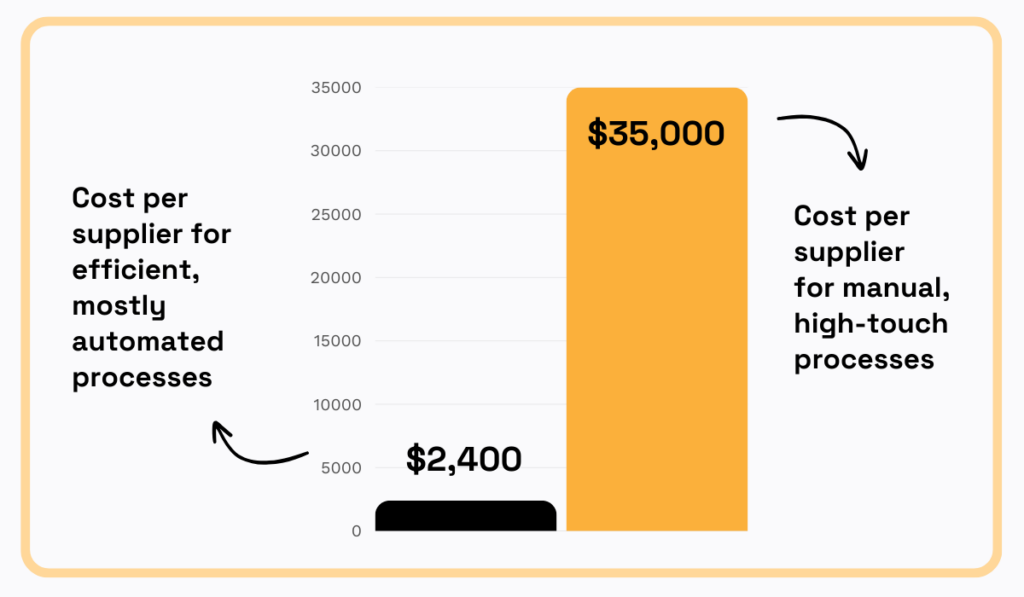
Illustration: Veridion / Data: Epiq
For certain suppliers, particularly strategic or international ones, onboarding costs may also include travel expenses for site visits, audits, or compliance checks.
Senturi reports that U.S. companies can spend around $12,000 onboarding domestic suppliers, and up to $50,000 for APAC-based vendors.
Beyond these direct expenses, hidden costs—like suppliers dropping out due to overly complex onboarding or missed revenue from delayed enablement—also need to be considered.
Overall, tracking this metric helps procurement teams evaluate onboarding efficiency and uncover cost-saving opportunities.
While often seen as qualitative, stakeholder satisfaction is a critical onboarding metric.
It reflects how both internal teams and suppliers experience the process, not just how fast or cheap it is.
Let’s look at how you can assess satisfaction on both sides of the onboarding experience.
This metric measures how internal teams, such as procurement, legal, finance, operations, and IT, perceive the supplier onboarding process.
Feedback is typically collected through surveys sent shortly after onboarding concludes, while feedback is still fresh.
The goal is to assess:
Below are some sample survey questions and suggested response types, starting with those focused on internal process satisfaction:
| Question | Response Type |
|---|---|
| How easy was it to complete your role in the onboarding process? | Scale: Very easy – Very hard |
| How responsive were other internal teams during onboarding? | Scale: Very responsive – Not responsive |
| How well did coordination across teams work? | Scale: Excellent – Dysfunctional |
| Were the onboarding systems/tools easy to use? | Yes/No + Rating: 1–10 |
| Were there unnecessary delays during onboarding? | Yes/No + If yes, please specify |
| What improvements would you suggest for future onboarding efforts? | Please specify |
These responses help pinpoint strengths and bottlenecks, especially around cross-functional alignment and tool effectiveness.
The next set of questions focuses on how internal stakeholders viewed the supplier’s performance during onboarding:
| Question | Response Type |
|---|---|
| How easy was it to work with the supplier during onboarding? | Scale: Very easy – Very hard + Optional comment |
| How responsive was the supplier to information and documentation requests?? | Scale: Very responsive – Not responsive |
| How professional were the supplier’s representatives? | Rating: 1–10 |
| Were there any delays caused by the supplier? | Yes/No + If yes, please specify |
| How satisfied were you with the communication between your team and the supplier during onboarding? | Scale: Very satisfied – Very unsatisfied |
| How well did the supplier meet compliance and documentation requirements? | Rating: 1–10 |
Not all internal team members will have interacted with the supplier directly, so tailor the distribution of surveys accordingly.
These surveys can be shared via Google Forms, Slack, or embedded directly into internal platforms.
By consistently tracking internal stakeholder satisfaction—and converting responses into measurable scores—you can uncover blind spots, improve coordination, and drive more efficient, user-friendly onboarding processes.
This metric is critical because a smooth onboarding experience sets the tone for a strong supplier relationship and shapes your reputation as a buyer.
Imagine starting a new job where no one tells you what to do, where to go, or how anything works.
That’s exactly how suppliers feel when onboarding is disorganized or unclear.
To build trust early, you need to evaluate how the process felt from the supplier’s perspective—how clear, responsive, and efficient it was.
Below are some potential survey questions and response types:
| Question | Response Type |
|---|---|
| How clear were the onboarding instructions you received? | Scale: Very clear – Very unclear + Optional comment |
| How easy was it to complete the onboarding requirements? | Scale: Very easy – Very difficult + Optional comment |
| How satisfied were you with the responsiveness of our onboarding team? | Scale: Very satisfied – Very unsatisfied + Optional comment |
| Were the onboarding tools or portals provided intuitive and easy to use? | Yes/No + If no, please specify |
| Did you experience any delays from our side during onboarding? | Yes/No + If yes, please specify |
| How likely are you to recommend working with our company to other suppliers? | Rating: 1 (Not at all likely) – 10 (Extremely likely) + Optional comment |
These questions help identify key issues, such as confusing instructions, repeated document requests, or approval delays, that may frustrate suppliers and slow down onboarding.
However, new suppliers may hesitate to share honest feedback.
Many worry that criticism could jeopardize their new business relationship.
To encourage openness:
Regularly tracking this metric allows your team to evaluate how supplier-friendly your process really is.
Use that feedback to reduce friction, encourage better supplier engagement from day one, and strengthen your standing as a preferred customer.
Tracking the right supplier onboarding metrics can help you reveal delays, reduce costs, ensure compliance, and strengthen collaboration, both across internal teams and with suppliers.
But metrics alone aren’t enough.
The real value comes from turning insights into action.
By using these indicators to improve clarity, efficiency, and responsiveness, you can build a smoother, more supplier-friendly onboarding experience that drives engagement and sets the tone for long-term success.
So, don’t just measure—optimize.
With the right tools and approach, onboarding becomes a strategic advantage, not a bottleneck.