
Blog
What Are the Challenges of Supply Chain Mapping?
By: Auras Tanase -
13 March 2026

We love our data, and now that you're here, you're one step closer to loving it too.
A wide sample of data, so you can explore what is possible with our data
Choose ->
built with procurement in mind. Focused on manufacturers, products and more
Choose ->
built with insurance in mind. Focused on classifications, business activity tags and more
Choose ->
built with sustainability in mind. Focused on sustainability commitments, and environmental and social governance insights.
Choose ->
built with strategic insights in mind. Focused on market trends, competitor analysis, and industry-specific data
Choose ->

Keep up to date with our technology, what our clients are doing and get interesting monthly market insights.

Key Takeaways:
For procurement executives, a supply chain map is more than a diagram.
It is a strategic blueprint for resilience, cost control, and compliance.
Yet creating and maintaining an accurate map is a monumental challenge.
Challenges stem from the inherent complexity of global commerce and traditional, reactive procurement approaches.
This article examines these core challenges and provides a path forward for leaders tasked with building transparent, resilient networks.
Modern supply chains are global ecosystems.
A single product may involve components from dozens of countries, processed in multiple factories, and transported across continents.
This complexity makes visualization feel like mapping the entire internet.
Each additional tier adds exponential complexity, and the central issue is visibility fragmentation.
You need deeper-tier mapping to understand, for instance, your full environmental impact.
Raw materials and early-stage processing often carry the highest carbon and social risk.
Yet, most organizations have strong oversight of their Tier 1 suppliers, and access to other tiers drops fast as they move upstream.
This makes reliable data harder to obtain and validate.
A McKinsey survey confirms this, revealing that, while 60% of companies have full visibility into Tier 1, only 30% can effectively access data from deeper tiers.
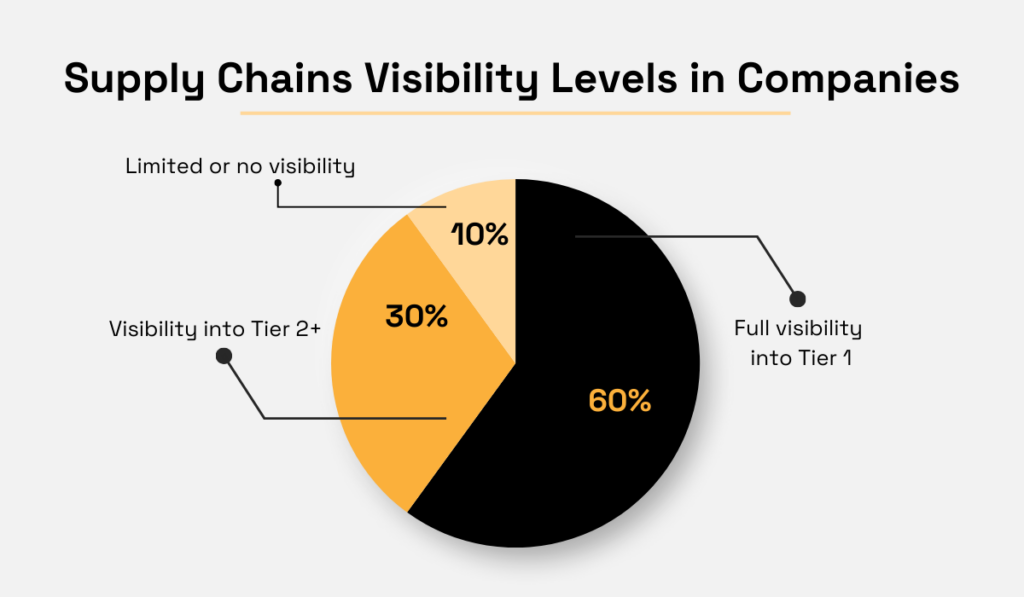
Illustration: Veridion / Data: McKinsey
The remaining 10% has limited or no visibility, leaving 70% exposed to hidden risks in the very tiers where problems most often begin.
This highlights the need for advanced mapping tools that bridge these gaps and enhance visibility into lower tiers.
Building strong relationships and cooperation with deeper tiers can help uncover risks and opportunities, making your supply chain more resilient.
So why do so many organizations stop mapping at Tier 1?
It’s often because gathering complete Tier 2 (and lower) data can take months or even years, and many companies never finish mapping these deeper levels.
This workload drives up costs and delays.
Even worse, hidden interdependencies make isolating risks hard. A disruption at one supplier can ripple unpredictably through multiple tiers.
As Alex Bowles, Director of Global Client Services at Transparency-One, a supplier management software provider, warns:
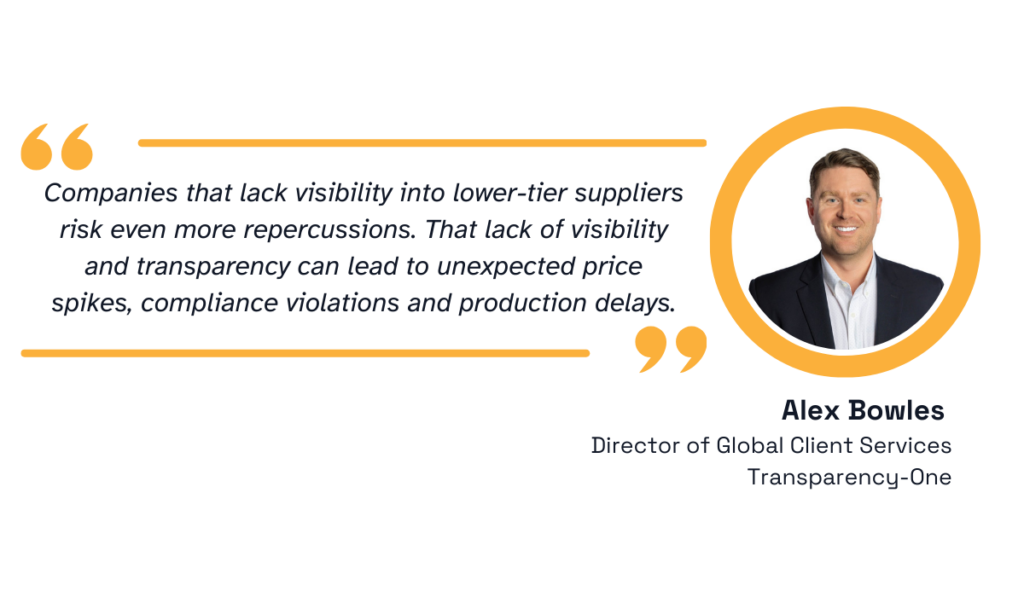
Illustration: Veridion / Quote: ISM
In short, complex multi-tier networks are time-consuming and expensive to map, and any blind spot can undermine your resilience.
To overcome it, start by mapping your most critical products, focusing on the components with the highest value or single-source dependencies.
Many companies still rely on surveys, spreadsheets, and manual follow-ups to build their maps, which can be frustrating and resource-draining.
While versatile, spreadsheets are ill-suited for modeling dynamic, multi-tier networks.
Manual data entry leads to inconsistencies, and static files cannot provide real-time alerts or model ripple effects from a disruption.
All of this ultimately limits how frequently maps can be updated.
It’s no surprise, then, that 70% of companies name poor visibility as the top supply chain issue, 65% cite missing or inconsistent data, and 50% mention organizational silos.
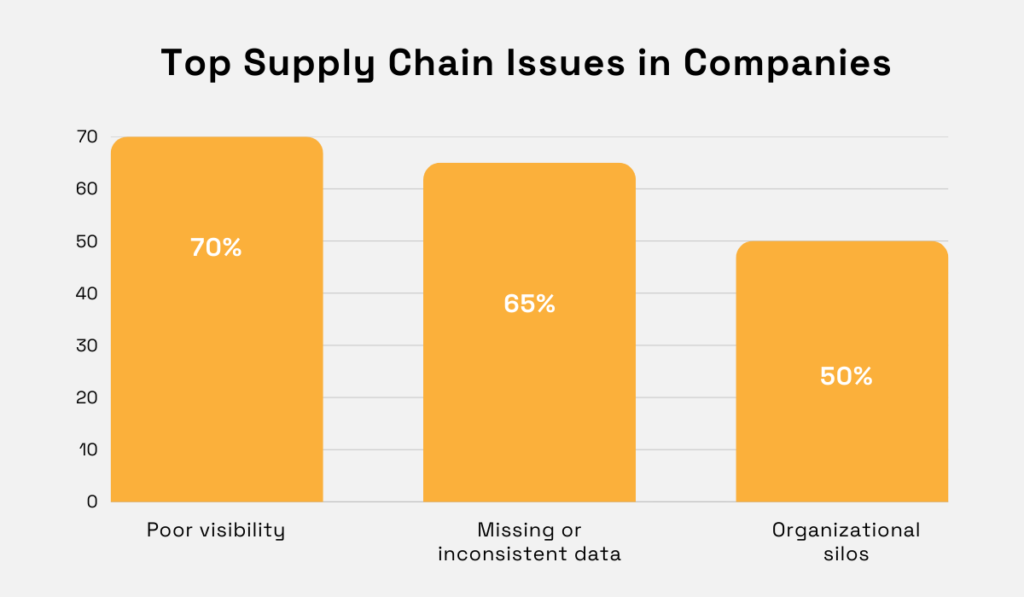
Illustration: Veridion / Data: Log-Hub
Tracking hundreds of suppliers in Excel simply doesn’t scale.
Once you have 1,000–5,000 partners, manual methods break down, and this complexity exceeds human capacity.
This ultimately dramatically increases risk, research shows.
According to the Data Security and Compliance Risk 2025 Annual Survey Report by Kiteworks, firms with 1,001–5,000 third-party relationships reported a 46% increase in supply chain risk compared with their smaller peers.
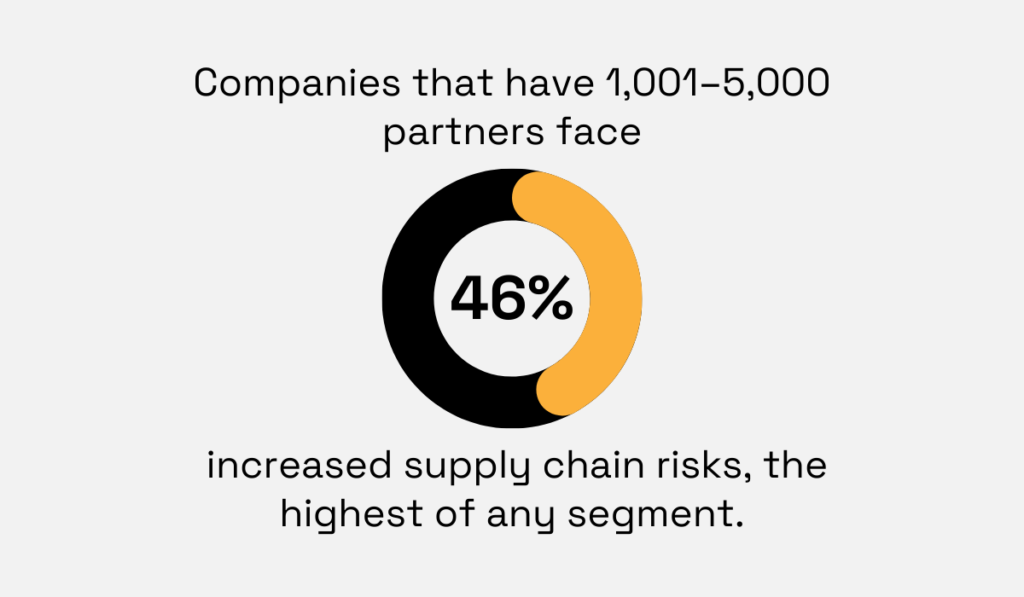
Illustration: Veridion / Data: Kiteworks
On top of that, compliance reporting can consume thousands of hours if done by hand.
The same report notes that teams spend 1,000–1,500 hours per year on manual compliance tasks alone.
That’s time wasted, since updates often lag.
Practically, few organizations can update their maps more than once in a blue moon.
Manual processes mean errors creep in, and maps go stale.
Therefore, consider auditing your current mapping process and calculate the person-hours spent on data collection, verification, and updating.
This cost analysis often builds the business case for investing in dedicated platforms that automate data aggregation and provide dynamic visualization.
Your map is only as good as the data it uses.
Mapping hinges on accurate supplier data, but the issue is, data used is often wrong or outdated.
The worst part is that these already incomplete, inaccurate, and irrelevant records are compounded by the network’s constant evolution.
New suppliers, shifting routes, and refined processes make it a moving target.
The fundamental problem?
The discrepancy between official records and operational reality.
Suppliers relocate, change names, or get acquired without notifying buyers.
Worse, corporate registries typically record a legal address (such as a headquarters) rather than each operational site.
Legal addresses tell you nothing about the location of manufacturing plants, warehouses, or subcontractors where work actually happens.
Source: Veridion
Sure, a supplier might be based in Frankfurt, but its sole production facility for your component could be in a region with high geopolitical risk.
So, if you only have the Frankfurt address, your risk assessment is fundamentally flawed.
Supplier profiles are also fragmented.
Some information sits in internal systems, other pieces in PDFs, and still others in spreadsheets.
And when data is available, it often comes in different formats and with gaps, is incomplete, or biased.
Take self-reported data, for instance:
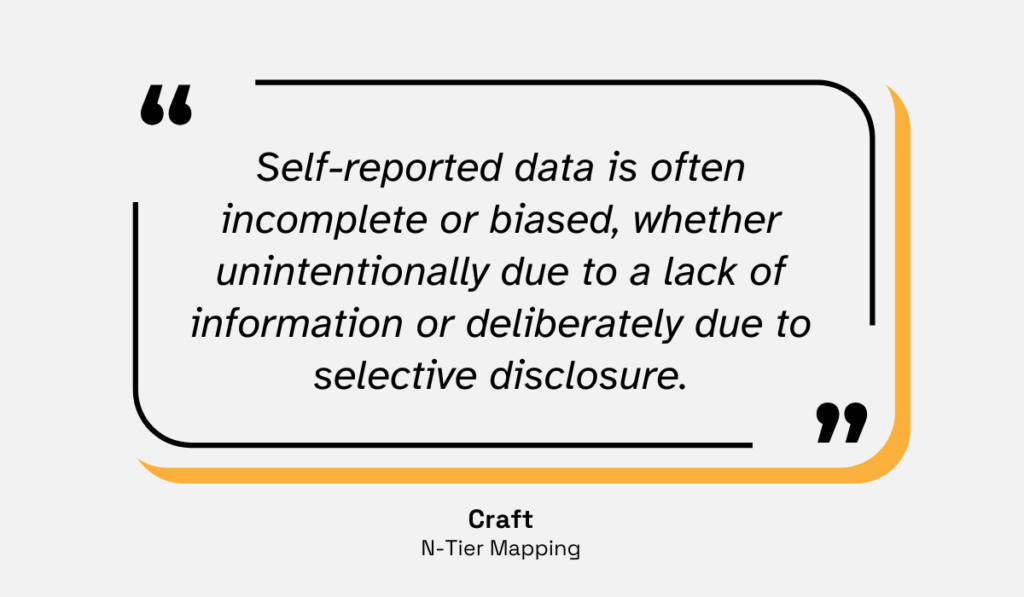
Illustration: Veridion / Quote: Craft
For an organization, this means your map might skip a factory that hasn’t been reported.
This inaccuracy directly impacts critical programs, such as ESG risk assessments.
You cannot accurately calculate carbon emissions (Scope 3) or audit labor practices if you do not know where production occurs.
Furthermore, unnormalized data—where the same address is formatted differently across systems—creates duplicates and mismatches, breaking down logistics and compliance tracking.
Bridging these gaps requires outside data sources and validation tools.
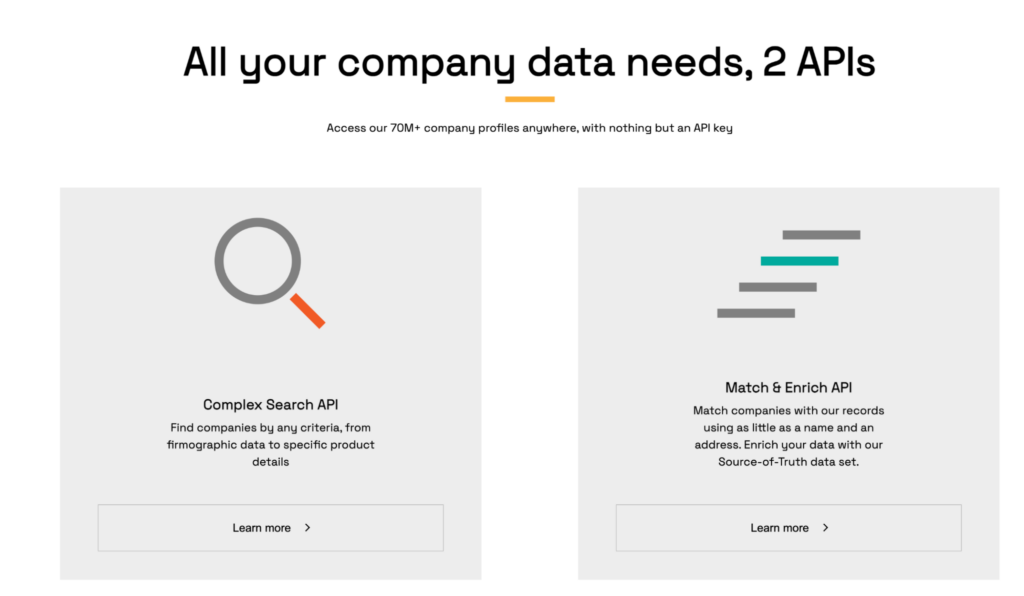
That’s where Veridion helps.
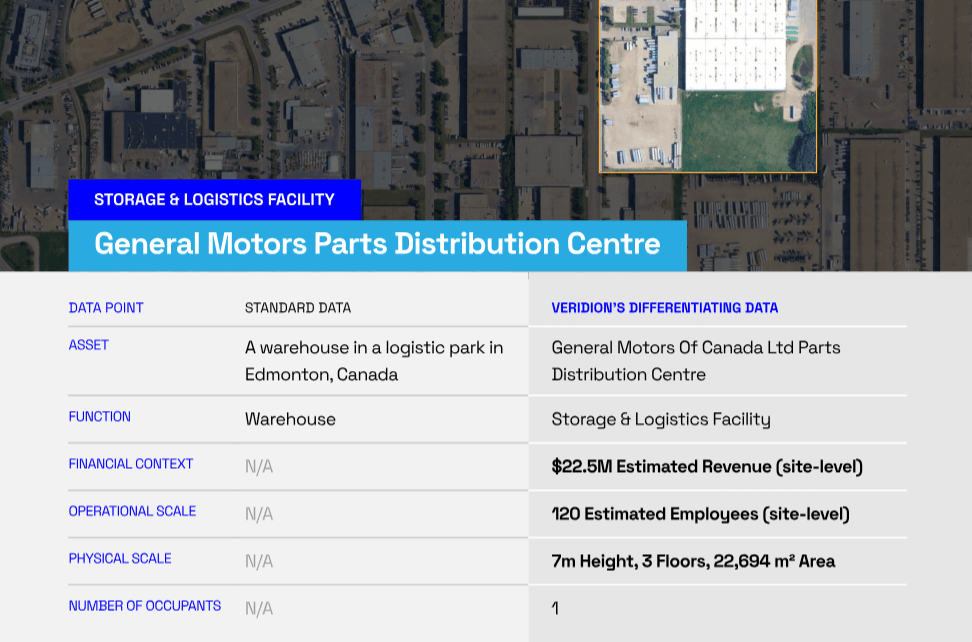
Veridion enriches supplier records with verified location and operational data, as well as real-world activity signals, via its Match & Enrich API.
Source: Veridion
This ensures your map reflects operational reality and reduces inaccuracies.
In effect, the platform cross-references official filings with actual on-the-ground information.
The result?
You discover the true production sites behind each supplier.
This prevents costly blind spots, so you won’t misjudge your risk just because an outdated registry hasn’t been updated.
So what’s your way forward?
Invest in a supply chain mapping platform that goes beyond visualization. Look for solutions that offer automated data enrichment, multi-tier relationship discovery, and real-time risk monitoring.
The right technology can help reconcile official records with actual operational footprints, and this provides a true picture of where suppliers operate.
Even with the best processes, mapping cannot succeed without supplier cooperation.
Many vendors balk at mapping exercises.
Concerns include:
Laura Magee, a senior consultant at Crimson & Co, a supply chain consultancy, explains:
Illustration: Veridion / Quote: Argon & Co
She also adds that success hinges on establishing a tone of partnership from the start, as supplier buy-in is essential for achieving transparency.
When suppliers are afraid to share information, they simply won’t divulge their full upstream network.
This reluctance cuts into visibility, especially in competitive or regulated sectors.
And sometimes, the reluctance is not just due to fear, but also to the supplier’s ignorance.
This means you must also consider that your Tier 1 providers often don’t even know their full chain.
If a Tier 1 supplier doesn’t track every subcontractor or raw-material source, they can’t pass that info along.
As a result, Tier 2 and Tier 3 sources can become invisible.
This challenge is, in fact, compounded in deeper tiers.
Tier 3 raw material suppliers may be small, family-owned operations without sophisticated tracking systems.
They may not see the value in participating in a large customer-mapping exercise and may lack the resources to comply with detailed data requests.
When suppliers are uncooperative or uninformed, mapping stalls out.
To conquer this challenge, frame mapping as a collaborative effort for mutual resilience, not an audit.
Work with strategic suppliers as partners.
Share your goals for resilience and compliance, and help them understand the value of transparency for their own business.
Offer benefits like shared risk insights, longer contract terms for high-transparency partners, or support in building their own business continuity plans.
That should help get the ball rolling.
Finally, remember that supply chains are not static.
They are dynamic, living systems, and external shocks accelerate this change.
Geopolitical tensions, new tariffs, natural disasters, and even pandemics can redraw the map overnight.
For instance, a factory closure or new tariff can force sourcing to change countries.
This means that continuous monitoring and regular data updates are essential to maintain an accurate, actionable view.
Illustration: Veridion / Quote: Climate Sustainability Directory
And there’s data to back this viewpoint up.
Professor Vidya Mani from the University of Virginia Darden School of Business states that we are seeing greater changes in global supply chains now than at any time in the past 30 years.

Illustration: Veridion / Quote: Darden School of Business
She adds that consumer and investor preferences, emerging technology, and instilling resilience are also driving shifts.
This dynamic nature means you must treat your map as a live tool, not a report to file away.
The goal is a “living map” that automatically updates as supplier status, location, ownership, or risk profile changes.
Demi Ben-Ari, Co-Founder and CSO at Panorays, a third-party cyber risk management platform, emphasizes that mapping every participant in your supply chain is a crucial first step.
Yet, a single risk assessment for each vendor is not enough:
Illustration: Veridion / Quote: Panorays
This shift is essential for stress-testing your network against potential future scenarios.
If you deploy continuous monitoring tools that provide real-time insights into the evolving risk landscape, you can stay on top of changes.
So, try to establish a quarterly review cadence for your most critical supply chains.
Integrate mapping data with your procurement software so that onboarding a new supplier automatically updates the network map.
Every change in your network should trigger a review of the map.
But if you don’t update, what was clear today can blindside you tomorrow.
Mapping your supply chain faces many hurdles: complexity, manual work, poor data, unwilling partners, and constant change.
Each can trip up your efforts.
The bottomline is this: visibility is non-negotiable for resilience.
Use technology and strategy to break down these barriers.
Start by engaging suppliers and gathering high-impact data, then invest in tools to enrich and refresh that data.
Remember: clear visibility into all tiers protects you from price shocks, compliance fines, and delays.
Now is the time to act.
With a living map in hand, you turn supply chain visibility from a headache into your strongest competitive advantage.