- Onboarding speed and thoroughness directly impact both risk exposure and operational efficiency.
- Vendors that mishandle data or fail compliance checks can turn misconduct into regulatory liability.
- Tracking metrics like time to risk mitigation and TPRM costs reveals not just problems, but opportunities to strengthen the entire supply chain.
Did you know that nearly 60% of data breaches are linked to third parties?
Today’s business world is interconnected like never before, and your partners can become both your greatest advantage and your biggest risk.
That’s why procurement executives need clear, actionable metrics to keep third-party risk management programs on track.
In this article, we’re breaking down eight essential TPRM metrics you should monitor.
Each one gives you a lens into your ecosystem’s health, and together, they build a roadmap for stronger supplier relationships.
Mean Time to Onboard (MTTO)
Onboarding is where risk management starts.
Mean Time to Onboard (MTTO) is a metric that helps you keep track of how long it takes to complete vendor onboarding, from initial due diligence through documentation and approval.
If onboarding drags on, it can stall strategic projects and frustrate business units.
But if it’s too fast, you risk skipping critical checks: verifying financial stability, sanctions lists, or ESG compliance, to name a few.
The sweet spot? An efficient process that doesn’t compromise coverage.
IBM’s research shows that onboarding new vendors can take up to 30 days, depending on the complexity of requirements.
And if we consider that manual supplier search alone can take 160+ hours—a full work month—that number could be even higher.
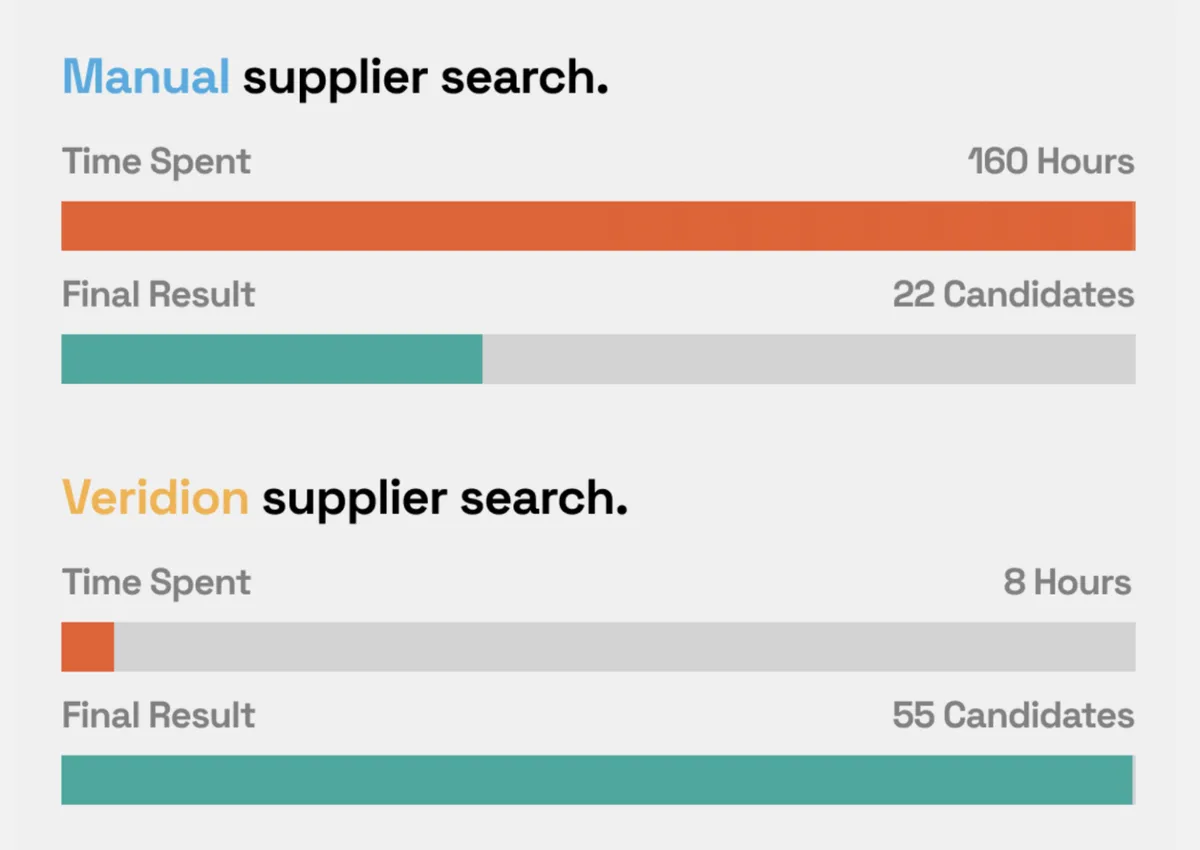
Source: Veridion
And it doesn’t stop with finding the suppliers.
The whole onboarding process is notoriously cumbersome when done manually.
Elvire Boinet-Bondon, European Advisor of Business Development at Graphite Connect, agrees.
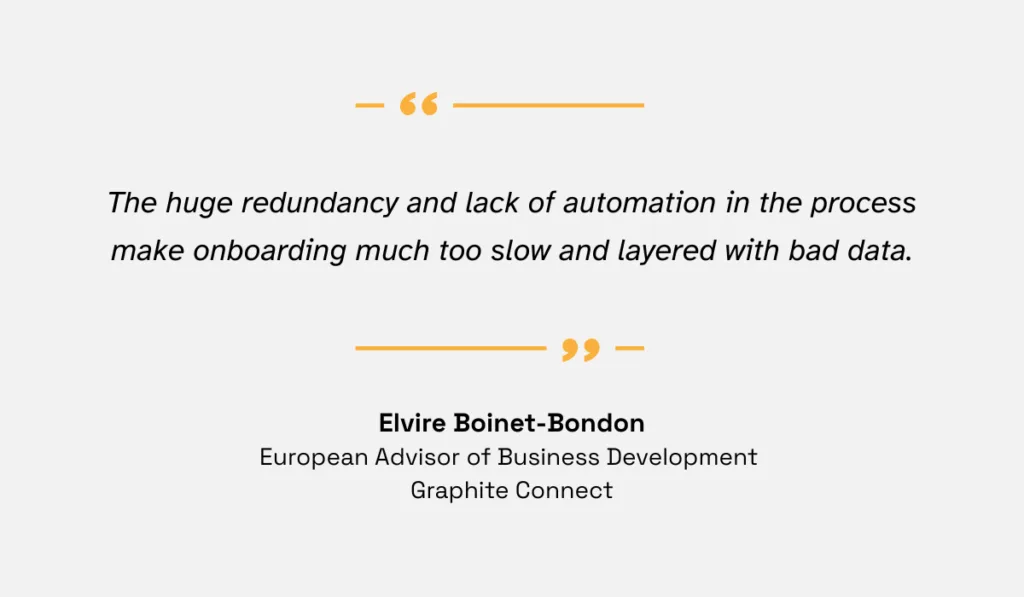
Illustration: Veridion / Quote: Supply Chain Digital
Needless to say, more and more procurement specialists are going for streamlined, automated onboarding.
That means they pre-populate vendor profiles, validate documentation instantly, and monitor changes in real time.
For example, Veridion’s AI-powered supplier discovery and enrichment tools can shrink weeks of manual work into minutes, and deliver fresh and verified profiles via API or batch files.
This directly impacts third-party risk management by ensuring risks are identified and addressed earlier in the onboarding journey, rather than after a contract is signed.
It also improves MTTO by reducing the lag between initial vendor selection and full risk clearance.
The bottom line is: by tracking MTTO, you create visibility into how well your risk controls align with business agility, making it a valuable metric to track.
Number of Third Parties in Regulatory Scope
Every industry comes with regulatory baggage: from GDPR in Europe and HIPAA in U.S. healthcare, to SOX in finance.
Your vendors may fall under strict requirements that extend to you.
That’s where the number of third parties in the regulatory score KPI comes in.
It indicates how many vendors fall under specific regulatory requirements, giving you an idea of how much of your ecosystem demands better oversight.
Why is this so crucial?
Because, if you don’t stay on top of it, you risk non-compliance and, by extension, regulatory fines.
And even when risks stem from inside an organization, regulators impose heavy fines for compliance failures.
Take JP Morgan’s $125M penalty from 2021 as an example.
Namely, JP Morgan Securities was fined by the SEC for failing to preserve required business communications, as employees—including senior supervisors—used personal devices and messaging apps to discuss securities-related matters.
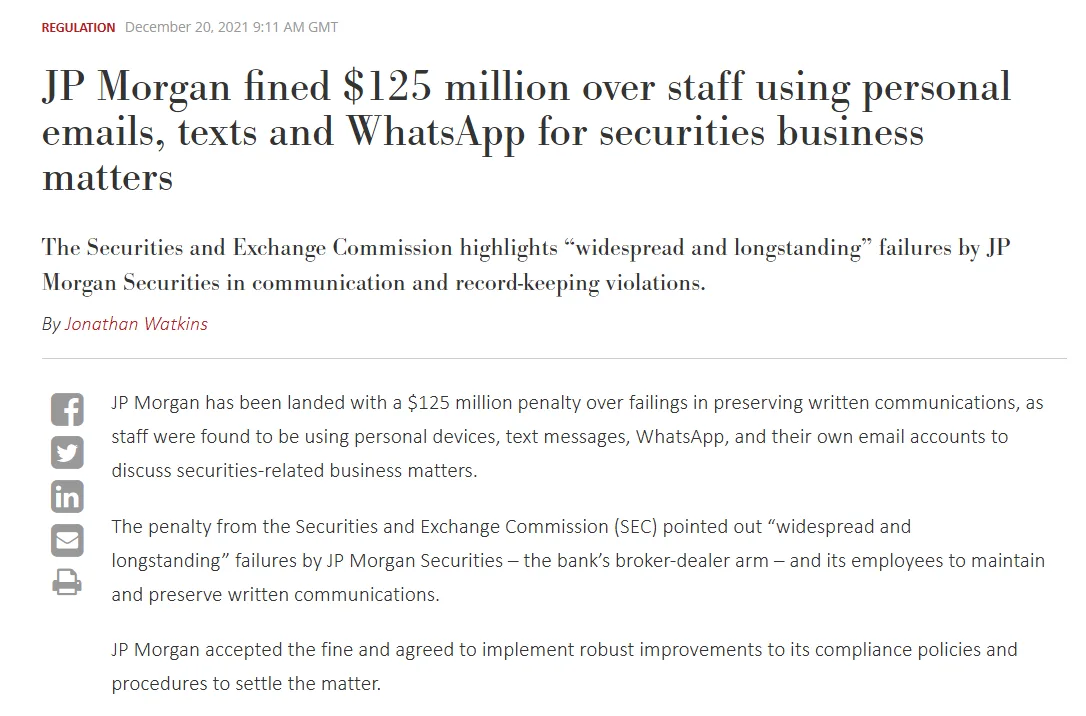
Source: The Trade News
Extend that logic to suppliers, and you will see why vendor missteps, like mishandling personal data and improper reporting, can become your problem quickly.
Our research estimates that companies lose close to a staggering $5 trillion annually to procurement fraud.
If your company fails to detect, prevent, or report fraud in your vendor relationships, it turns from a misconduct issue into a regulatory issue.
Fraud risks and regulatory obligations often overlap, since vendors that mishandle data or finances can trigger both financial losses and compliance violations.
That’s why tracking vendors under regulatory scope is the only way to avoid joining those losses.
For procurement teams, it’s also important to learn how many vendors handle sensitive personal data, financial reporting, or healthcare information.
If 60% of your vendors fall under GDPR, for example, your risk framework must reflect that reality.
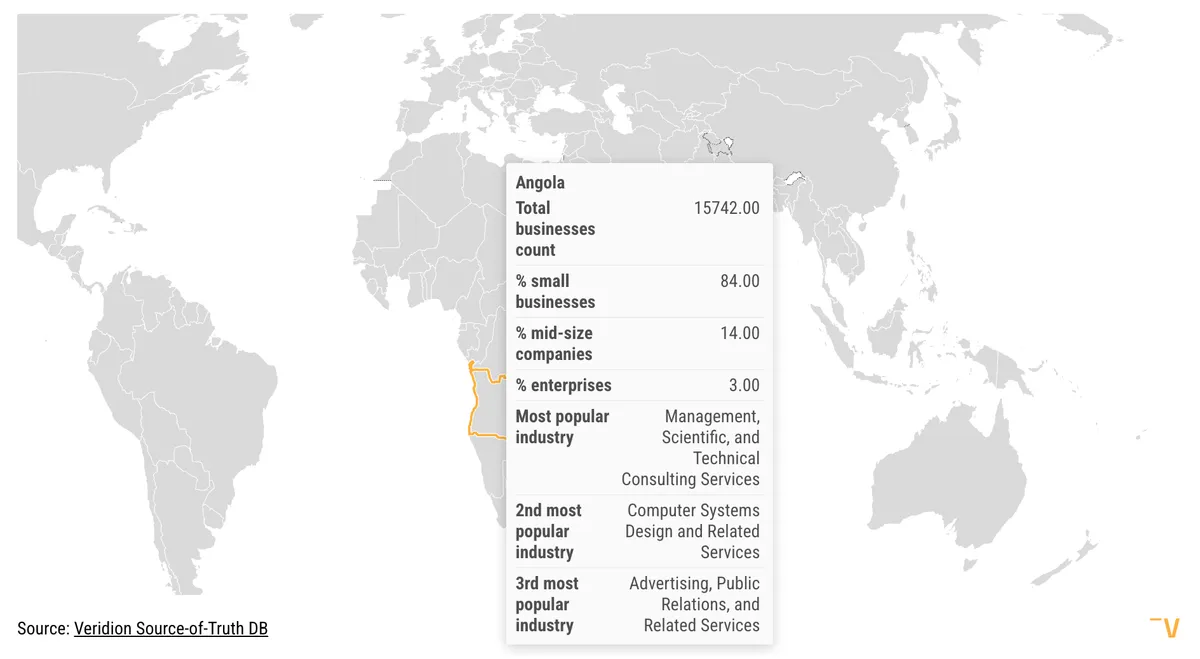
And if your third-party network extends farther than just your home country—which is likely the case— you’re bound to encounter additional regulatory obligations.
The map below shows just a few such examples:
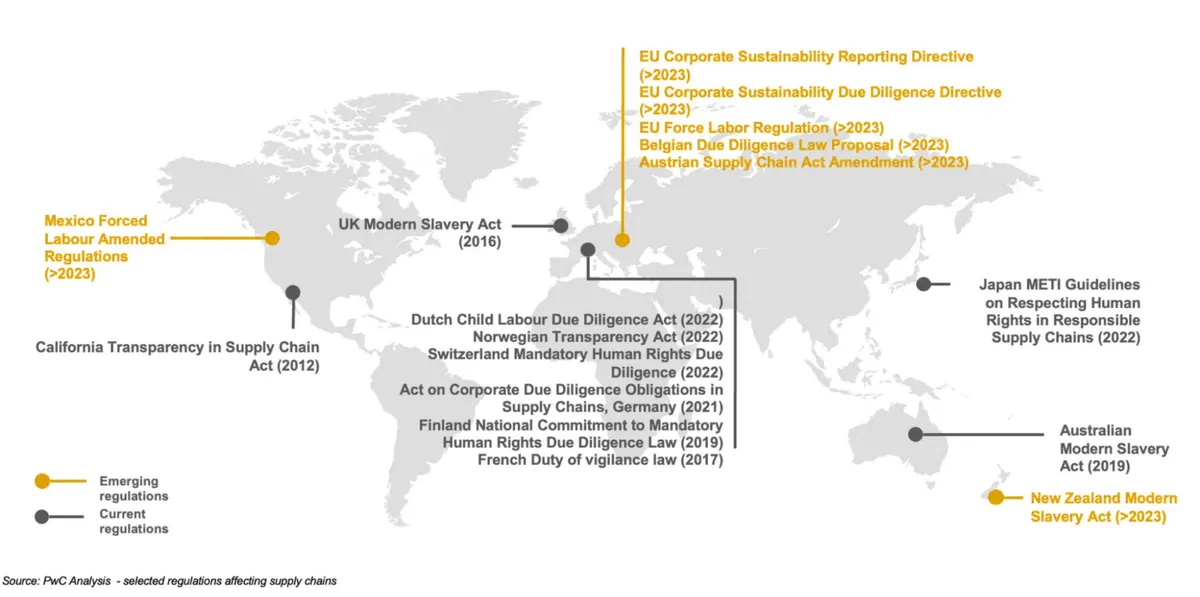
Source: Veridion
Here, a partner like Veridion helps by mapping suppliers against regulatory requirements worldwide, even in regions where reliable data is traditionally hard to access.
Source: Veridion
In fact, Veridion promises the greatest global coverage from all tools of its sort.
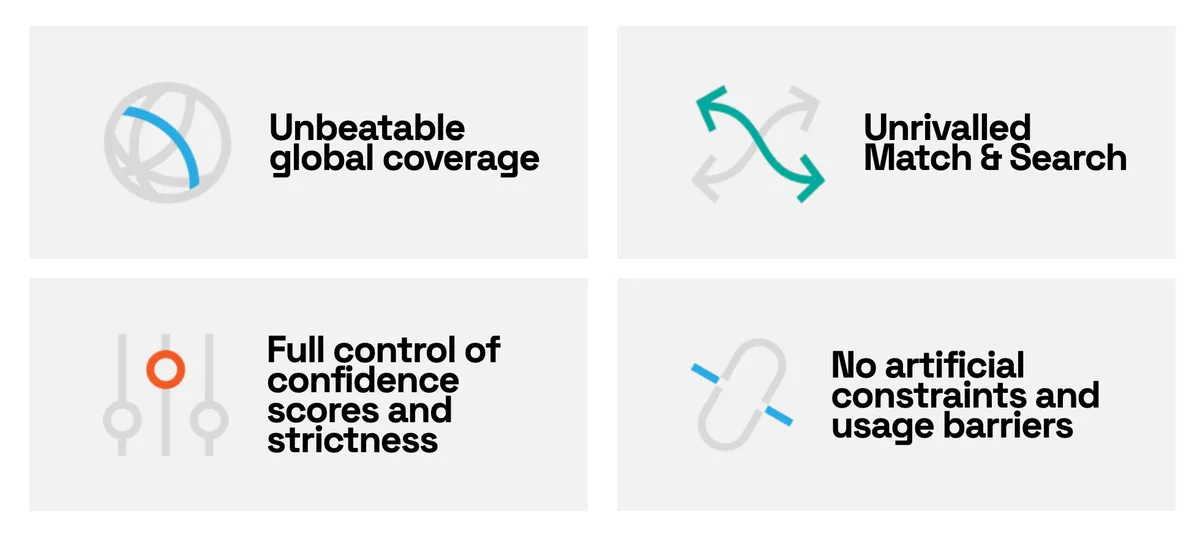
Source: Veridion
This comes in handy big time when it comes to compliance.
Percentage of Providers Who Fail Initial Risk Assessment
Not every vendor passes the initial risk assessment.
The percentage of providers who fail it measures how many suppliers fall short of your minimum criteria during onboarding.
A high failure rate could mean your standards are too strict, or that you’re sourcing from risky pools of vendors.
A low failure rate, on the other hand, might suggest you’re being too lenient, letting red flags go unchecked.
Either extreme can harm your TPRM program.
When vendors slip through due to weak controls on your end, they become easy entry points for attackers, putting your organization in the crosshairs.
According to IBM’s Cost of a Data Breach Report, a data breach in 2023 cost an average of $4.45M.
But if a breach involved a third-party vendor, the cost went up by over $13 per record.
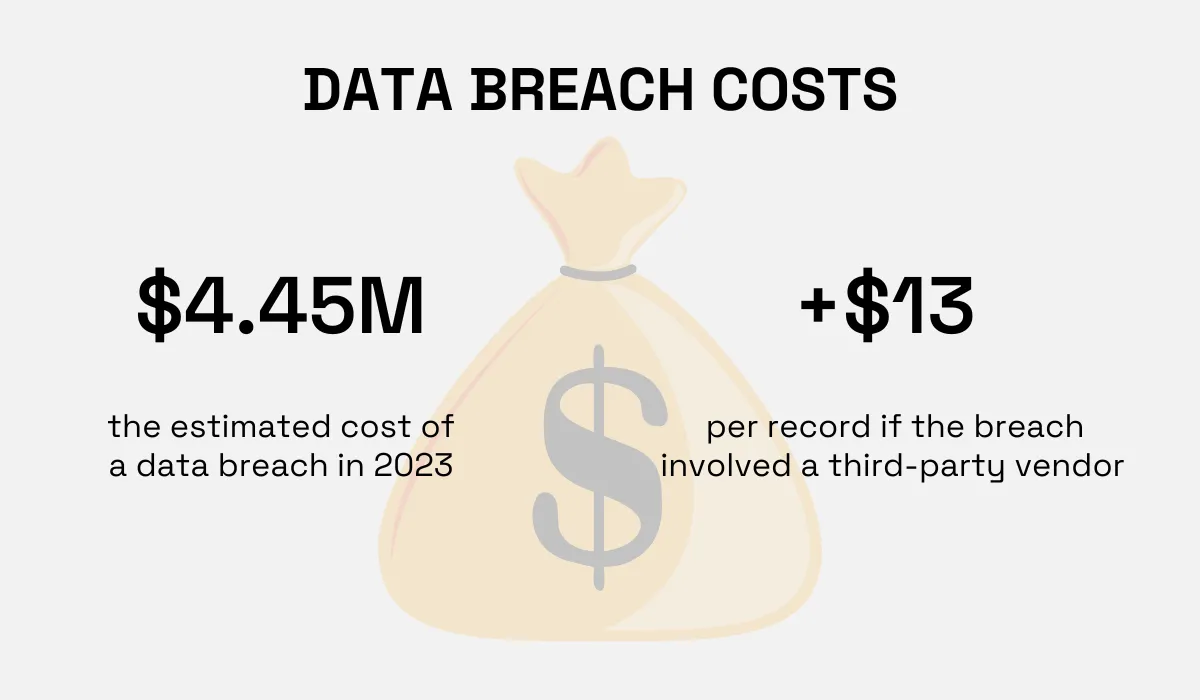
By catching weak or high-risk vendors early, you reduce the likelihood of such costly third-party breaches and regulatory exposure later in the relationship.
So, don’t underestimate the value of a robust initial risk assessment and the importance of tracking the associated metric.
Regularly tracking which vendors fail the initial risk assessment helps you see patterns in your supplier base and spot where your risk controls might need work.
It also shows which vendors need the most attention, so you can focus your resources where they matter most.
Over time, this information can guide smarter sourcing decisions and make your organization stronger against third-party risks.
ors to meet minimum security standards before renewal helps lower risk exposure and strengthen trust.
Percentage of Suppliers by Risk Tier
Not all vendors are created equal.
Some handle sensitive data or supply mission-critical services, and others provide office supplies.
The percentage of suppliers by risk tier metrics shows how your vendor base is distributed across high, medium, and low-risk categories.
This breakdown is essential for resource allocation.
For instance, if 40% of your vendors fall into the high-risk category, you’ll need to invest more effort into robust monitoring, regular audits, and targeted mitigation plans to manage potential threats.
Conversely, if most of your vendors are low-risk, you can focus on maintaining basic oversight and then reserve your most intensive resources for the smaller group that poses greater potential threats.
Even tiering your suppliers by how closely you work with them (direct suppliers, their suppliers, and their suppliers’ suppliers) can help you do this.
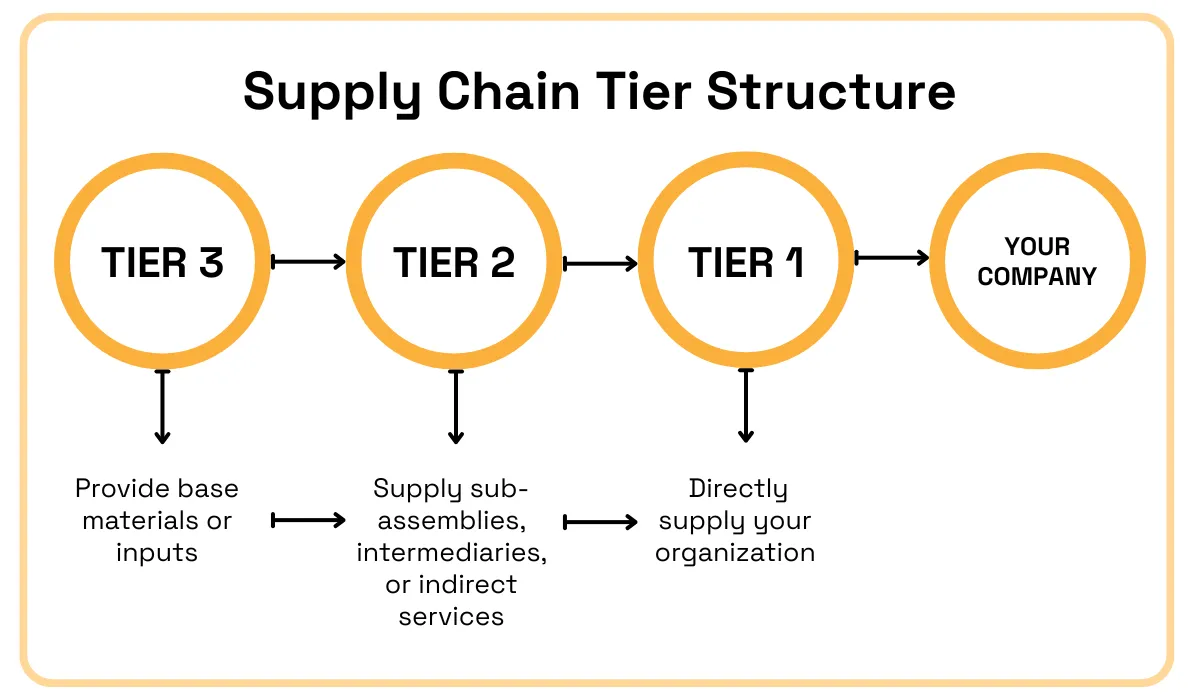
Source: Veridion
Critical Tier 1 suppliers—often the riskiest, yet the most strategically important—receive closer monitoring, while lower-tier vendors get lighter oversight.
This prevents lots of wasted effort and ensures your riskiest relationships stay under the closest watch.
Yet, a 2023 Navex report showed that 27% of companies still use a universal approach to mitigating third-party risks.
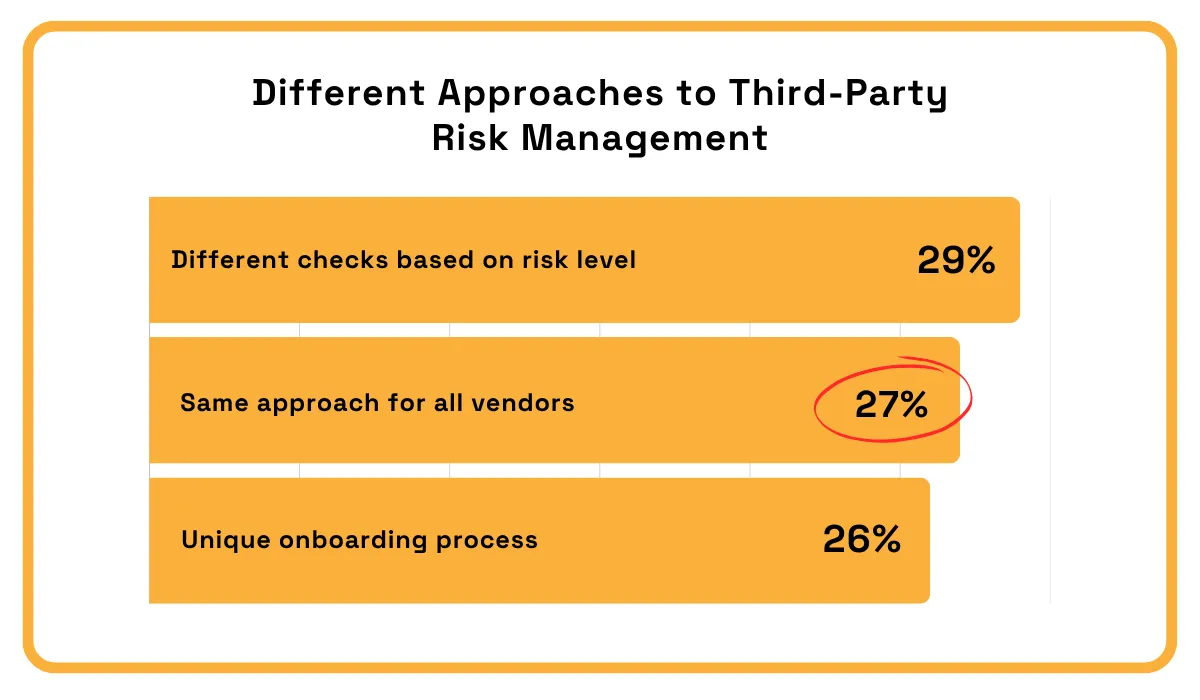
This tendency to default to a one-size-fits-all approach goes to show that a significant portion of organizations doesn’t understand the significance of risk tiering their suppliers.
As a result, they leave the door open to potential security, compliance, and operational issues.
Implementing and tracking risk tiers empowers companies to focus their efforts where they matter most, which ultimately strengthens resilience across the supply chain.
Time to Mitigation After Risk Detection
Identifying a risk that a third party might bring is only half the battle.
The other half is mitigating that risk through timely action, remediation, or controls.
This is where the time to mitigation after risk detection metric comes in: it measures how quickly your team responds once a problem is flagged.
But why does this KPI matter?
Because tracking how long it takes to address issues helps ensure your mitigation processes are effective and responsive.
If they’re not, manageable issues can quickly turn into crises. So, there’s no doubt that speed is of the essence here.
In fact, Nicolas Walden, Associate Principal of The Hackett Group, explains that speed is now one of the biggest benefits of data-driven risk management.
Without it, the resources needed to catch and resolve risks in time would be unfeasible.

Illustration: Veridion / Quote: Procurement Magazine
Therefore, procurement leaders should view this metric as a reflection of operational readiness.
If your average time to mitigation is long, you may need clearer escalation paths, stronger vendor cooperation, or better monitoring tools.
Take Veridion, for example.
Veridion can help shorten the time to mitigation by providing real-time insights and alerts on vendor risks.

Source: Veridion
With continuous monitoring, procurement teams can detect issues faster and take action immediately, improving operational readiness and reducing the window of exposure.
By integrating these capabilities into workflows, organizations can track and act on risks more efficiently.
Needless to say, the fresher the info, the earlier the alerts, which makes the lag between detection and action smaller.
Cost of Third Party Risk Management
Finally, numbers talk.
The cost of third party risk management metric tracks what you’re spending to operate your TPRM program, including staff time, monitoring tools, assessments, and remediation efforts.
Over time, this metric also reflects efficiency gains.
With that being said, a rising TPRM cost isn’t necessarily a bad sign: it may simply reflect expansion or investment in stronger controls.
But if costs stay high while incidents persist, it signals inefficiency.
On the flipside, a declining cost combined with reduced incidents indicates that your program is maturing in both effectiveness and efficiency.
Of course, it’s not just about what you spend.
In fact, failures tend to cost much more.
According to ProcessUnity, 82% of organizations experienced at least one third-party data breach in two years, with each incident costing an average of $7.5 million to remediate.

Source: Veridion / Data: ProcessUnity
Numbers like this show how quickly weak oversight turns into skyrocketing expenses.
So, how do you make sure that your TPRM program is both cost-effective and strong enough to prevent costly incidents before they happen?
The answer lies in tracking key metrics we discussed throughout this article, prioritizing high-risk vendors, and leveraging automation tools to detect, assess, and mitigate risks quickly.
With fresher data and automated monitoring, you can make the business case for smarter investments.
Conclusion
Strong third-party risk management comes down to tracking the right numbers, not drowning in them.
So, if you focus on the key metrics we presented in this article, you’re bound to have a clear insight into your ecosystem’s health.
And with a partner like Veridion, those insights turn into action.
Smarter choices, fewer surprises, and a supply chain that can keep up with whatever comes next—that’s the future you’re building.
Articles
Discuss how these trends affect your organization.
Our analysts are available for a short call. Bring a specific question and we will ground it in the data.