
Blog
How to Verify a Company’s Operational Footprint in Private Equity Due Diligence
By: Stefan Gergely -
26 January 2026


We love our data, and now that you're here, you're one step closer to loving it too.
A wide sample of data, so you can explore what is possible with our data
Choose ->
built with procurement in mind. Focused on manufacturers, products and more
Choose ->
built with insurance in mind. Focused on classifications, business activity tags and more
Choose ->
built with sustainability in mind. Focused on sustainability commitments, and environmental and social governance insights.
Choose ->
built with strategic insights in mind. Focused on market trends, competitor analysis, and industry-specific data
Choose ->

Keep up to date with our technology, what our clients are doing and get interesting monthly market insights.

Key Takeaways:
A company’s operational footprint often reveals more than its financial statements ever will.
Hidden sites, outsourced functions, and hazy third-party dependencies often distort valuation and mask risk in private equity deals.
To avoid any costly surprises, investors need a structured way to surface and validate every location and activity that keeps a business running.
With this guide, we break down that process into seven essential steps.
There’s little point in conducting a thorough PE due diligence process without first mapping a company’s full operational footprint.
A clear inventory of every facility ensures you’re assessing all relevant assets. Not just those that show up on the balance sheet.
But is this level of detail always necessary?
After all, due diligence is an extensive, multi-layered process, as highlighted by Paul Giannamore, a private equity investor and sell-side advisor at The Potomac Company.
Illustration: Veridion / Quote: POTOMAC M&A on YouTube
What makes it even more tempting to take shortcuts is multiplying this complexity across the median 80 deals a private equity firm considers before investing.
However, focusing only on the headquarters or “main” production sites is not an option.
Skipping this step creates blind spots, including unassessed risk exposure, inaccurate valuation assumptions, and weak contingency planning.
Every comprehensive, connected operational map should include:
Since operational disruptions no longer stop at the company boundary, understanding both directly owned and third-party operated facilities is essential.
A recent cautionary tale is the Delta Air Lines fallout, which resulted from the CrowdStrike software issue.
A third-party IT failure caused a major outage across multiple companies, but Delta’s $500 million in losses, litigation costs, and ongoing court proceedings drew the most attention.
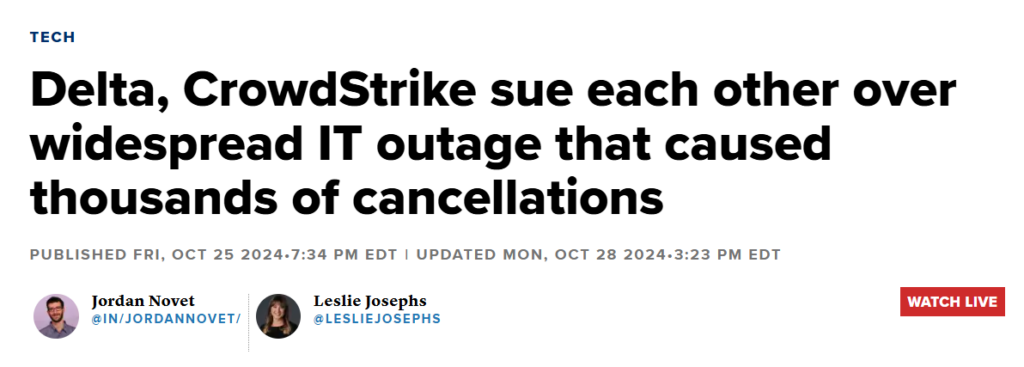
Source: CNBC
While some critical failures are unavoidable, firms that map critical third-party touchpoints gain far greater visibility, which puts them in a better position to mitigate or avoid risks.
As such, it’s important to clearly define the scope of all assets and dependencies, and once you have that, verification itself becomes far more accurate and actionable.
With the full footprint mapped, you can move to assessing where the real risks lie.
Before you can verify actual company sites, you need a complete and reliable dataset of all its operational locations.
Meaning, all company disclosures need to be checked against information pulled from multiple sources.
To build an initial master list of all known facilities, investors typically combine several sources, including internal documents, regulatory filings, public records, and geospatial data.
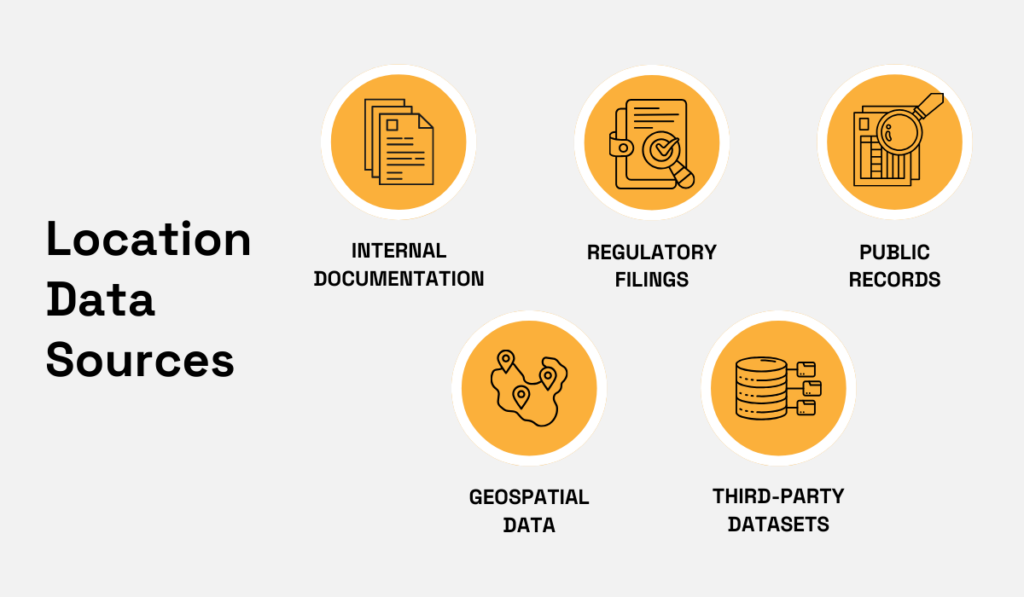
Source: Veridion
Third-party datasets are also frequently used to enrich existing information and determine whether disclosed sites are accurate, current, and actually operational.
However, assembling and organizing such a vast amount of information is rarely straightforward.
A Matillion–IDG survey found that the average organization draws from more than 400 data sources, and over 20% rely on 1,000+ sources to fuel their BI and analytics systems.
What’s worse, managing fragmented, inconsistent, or outdated inputs creates significant friction for deal teams.
As Michael Nirschl, Chief Information Officer at Morgan Stanley, notes, data that becomes more expensive to gather and maintain than the value it provides will ultimately come under scrutiny.
Illustration: Veridion / Quote: Forbes
With this in mind, it’s essential to choose intuitive, yet comprehensive solutions to ensure seamless data collection and management.
For instance, Veridion reduces manual data collection time while unearthing pertinent information and improving accuracy across the due diligence process.
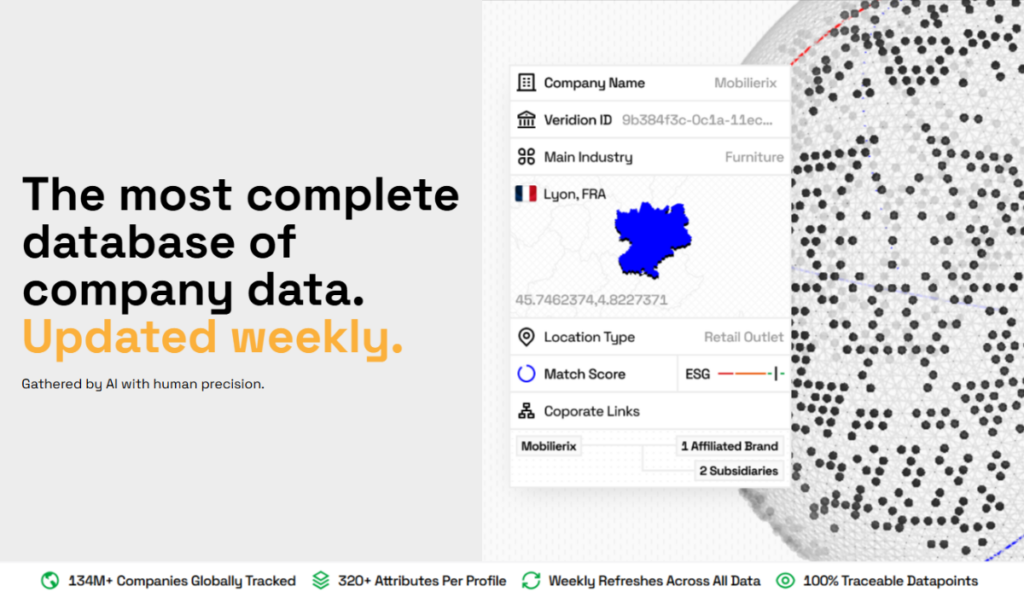
Veridion’s platform offers AI-powered intelligence across 130+ million global companies, including private firms and SMBs, ensuring a steady flow of fresh, verified data.
Source: Veridion
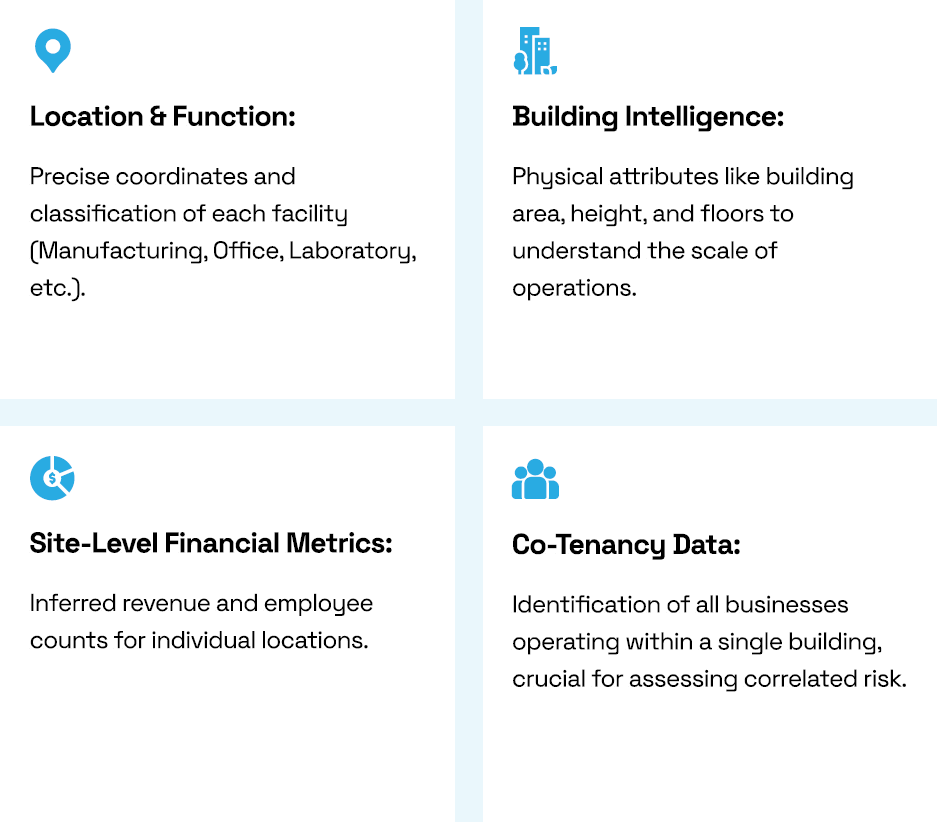
With weekly updates and 320+ attributes available per profile, Veridion delivers both depth and accuracy, helping you identify and map all operational locations linked to a business, regardless of its legal entity structure.
You get a full address and geo-coordinates, key operating metrics, and business activity tags, as well as location-specific industry classifications.
Moreover, Veridion easily distinguishes HQs from secondary sites, enabling you to classify over 100 facility types, from offices and warehouses to factories and unmanned sites.
Source: Veridion
The data itself can be accessed via Batch, API, or integrated platforms, thereby enabling faster verification and more complete location mapping across the due diligence process.
With reliable, multi-source location data in place, investors can move to evaluating whether each site is active and what role it truly plays in the business.
Another critical step in private equity due diligence is confirming whether each location is actually operational.
While taking a company’s claims at face value was never really an option, today, investors need assurance that every site, facility, and operational node is performing as described.
EY’s Senior Analyst and compliance expert, Jason Spencer, notes that due diligence processes have long evolved beyond checklists into strategic investigations that combine multiple data sources.
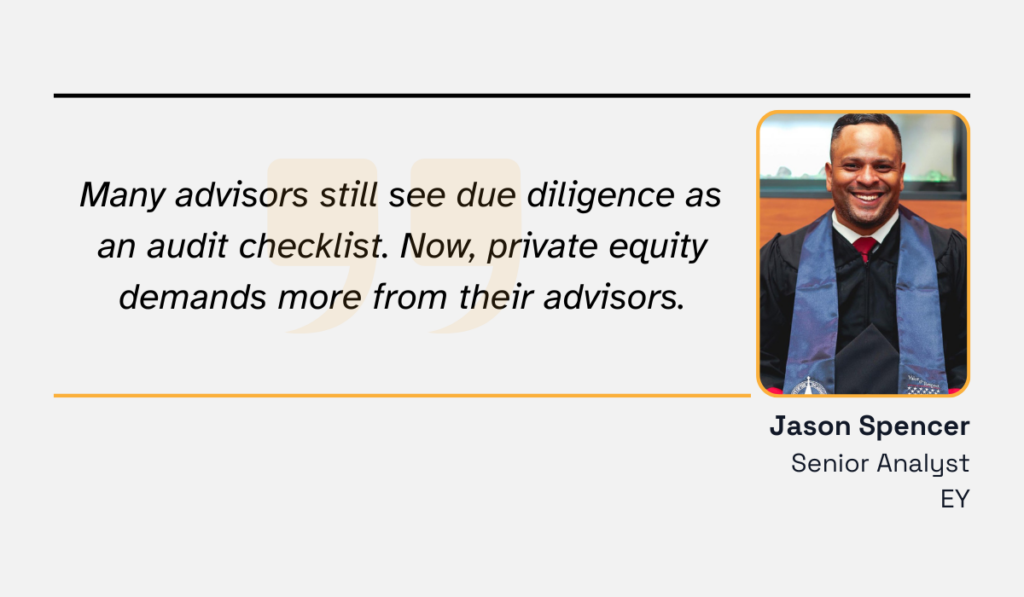
Illustration: Veridion / Quote: EY
Private equity firms frequently uncover locations a company neglected to report on, or, in some cases, deliberately omitted.
In extreme situations, verification can reveal full-scale operational misrepresentation.
One striking example is Builder.ai, a company that once claimed to operate an advanced AI platform capable of building applications autonomously.
The “AI-powered no-code app builder” attracted $700 million from major investors, including SoftBank, Microsoft, and Qatar Investment Authority, but closer investigation revealed that the AI “Natasha” did not exist.
Instead, all the work was performed by 700 human developers in India.

Source: Information Age
While Pseudo-AI carries hidden costs, those are nowhere near the financial exposure caused by a fraud of this scale.
Now, could this have been prevented?
Techniques such as satellite imagery, local business registration checks, utility or permit data, and employee density analysis could have highlighted inconsistencies before these investments were made.
Here’s how they compare at a glance:
| Verification Technique | Best Used For |
|---|---|
| Satellite imagery | Physical site presence/activity at factories, warehouses, R&D centers |
| Employee density analysis | Comparing actual staffing levels with shared claims |
| Utility & permit data | Assessing operational intensity, compliance at production plants, and labs |
| Local business registrations | Validating registered locations such as branches, warehouses, and offices |
Any of these methods, when applied systematically, improves confidence in operational verification and reduces risk exposure.
By confirming actual activity, investors move from assumption to evidence, ensuring that both directly owned and third-party sites are genuine contributors to value, rather than hidden sources of financial and reputational risk.
Next up, it’s time to ascertain key supply chain dependencies.
Having a view of a company’s full operational footprint and activity, powered by location data, may seem like enough.
But you still need a better insight into what keeps these sites running.
After all, a company’s performance depends not only on its own facilities but on the critical suppliers, logistics partners, and service providers that feed into them.
However, those dependencies aren’t always obvious, which is why tracking the extended network becomes so important.
According to Gartner, organizations that closely monitor changes in their third-party landscape are 29% more likely to remediate risks before they become material.
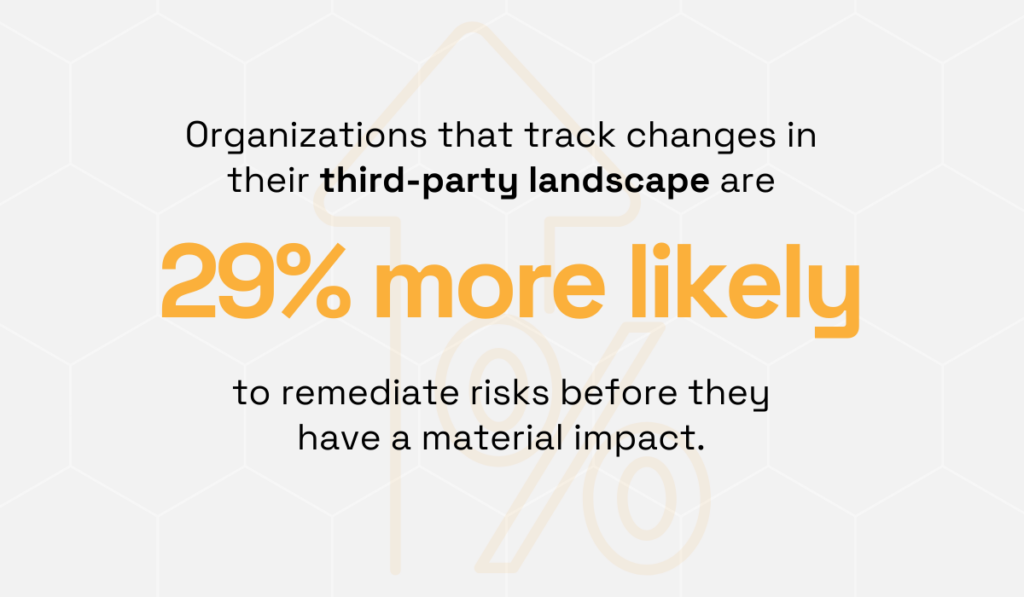
Illustration: Veridion / Data: Gartner
On the other hand, when these dependencies fail, the impact on your earnings can be quick and devastating.
Imagine a production plant that relies on a single specialized component supplier.
If that supplier were to suffer a shutdown, due to a flood, bankruptcy, cyber incident, or something else, the plant’s output collapses.
And that drop in output quickly flows into EBITDA, reducing operating profit and directly impacting valuation.
Real-world failures can be even more severe. In South Korea, a fire at a major data center destroyed 858 TB of government data, with no backups in place.
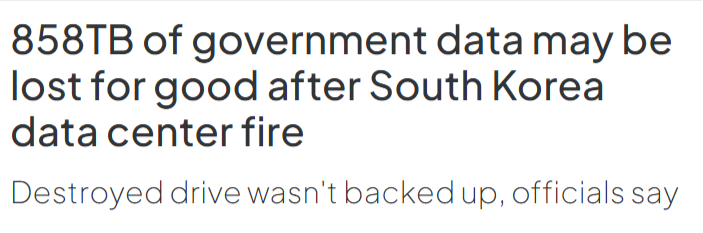
Source: Data Center Dynamics
This recent episode is a clear example of a single point of failure that creates a ripple effect across dozens of other sites.
The best thing you can do to assess these nodes is to map supplier locations and their geographic clusters, and chart how many operational sites rely on each one.
GIS-powered visualizations are especially effective here, because you can easily:
If multiple desire lines converge on a single supplier, as illustrated below, you’ve found a major point of vulnerability.
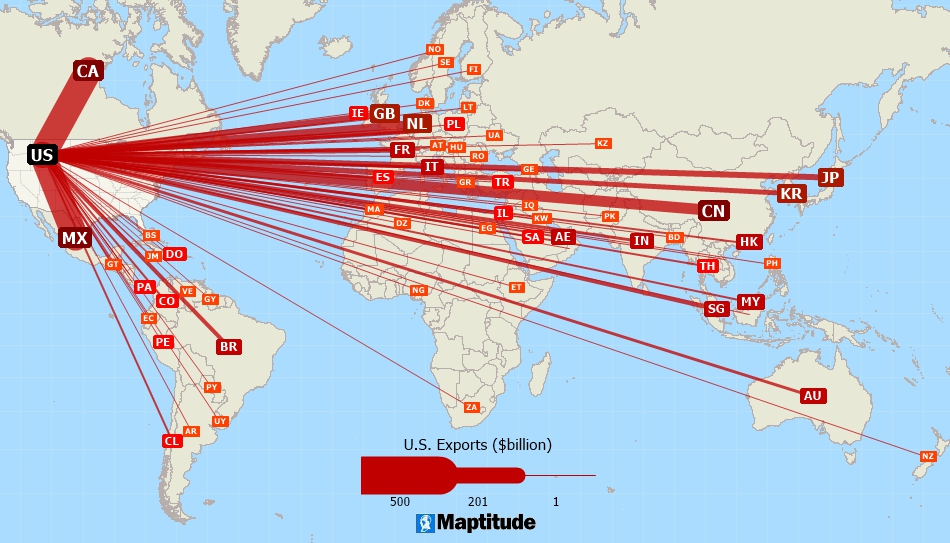
Source: Caliper
These visualizations can be complemented by heat maps to further highlight cluster density or regional exposure.
A clear dependency map transforms supply chain risk from an abstract concern into something visible and actionable before it impacts deal value.
Even with the dependencies charted, you need to ask how well these locations actually hold up under stress.
Operational resilience depends on far more than day-to-day performance, which means that investors need to account for and evaluate exposure to:
The impact is easier to picture when we develop a few practical scenarios, such as a key manufacturing region experiencing sustained drought and water-use restrictions or political unrest occurring near a critical logistics hub.
No matter the exact context, each potential crisis affects the cost, capacity, and/or operational continuity, which, in turn, impacts deal valuation.
This is where stress-testing provides clarity.
Norges Bank Investment Management (NBIM) recently modelled how three macro scenarios could strain operational and financial resilience.
The biggest equity drawdown (48%) was noted in relation to the rising global debt, followed closely by market fragmentation caused by geopolitical tensions.
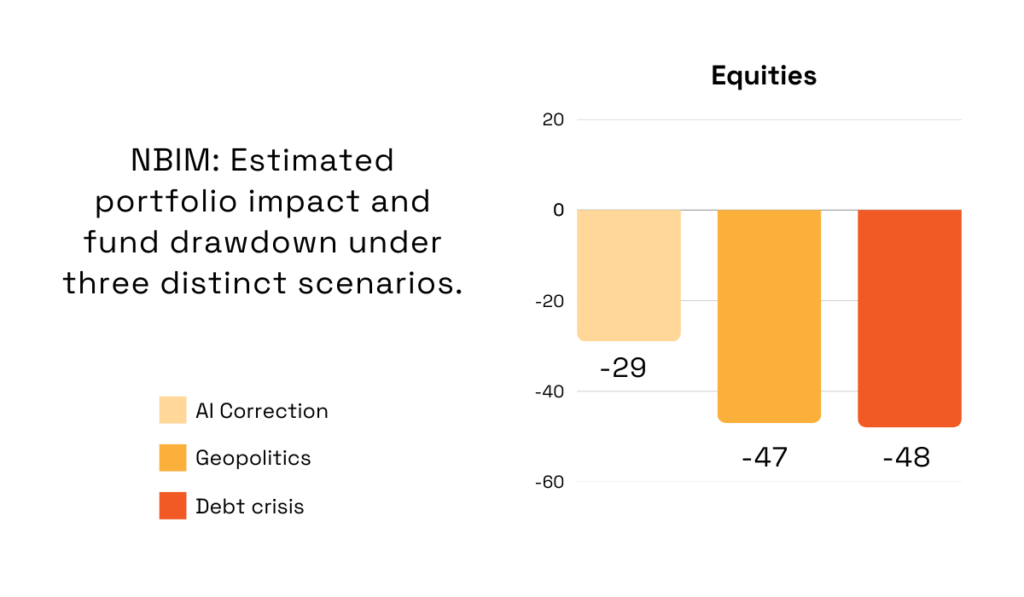
Illustration: Veridion / Data: NBIM
Although modeled independently, NBIM notes these shocks could occur simultaneously, creating compounding effects that exceed any individual scenario.
But what are some practical steps toward evaluation?
For starters, you can rely on risk scores that incorporate climate exposure, political stability indices, supply chain fragility, and infrastructure reliability.
They help quantify downside potential and highlight where deeper diligence is required.
Still, even strong sites with high resilience scores require documented fallback strategies.
One 2020 study showed that 46% of North American PE firms had contingency plans covering less than a quarter of their portfolio companies.
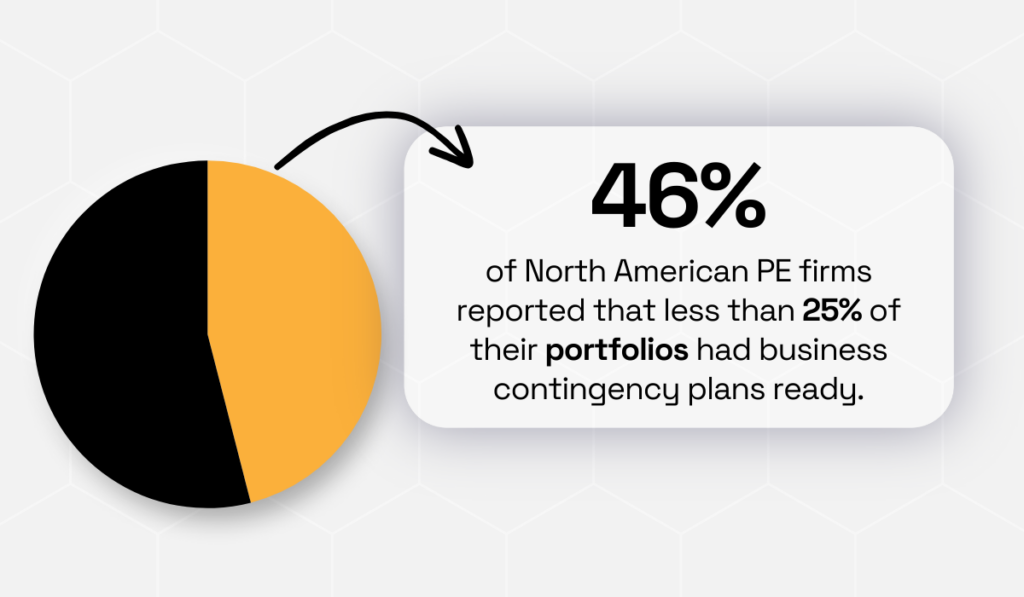
Illustration: Veridion / Data: Globalization Partners
Fortunately, the post-pandemic expectations have shifted, transforming robust contingency planning into a baseline requirement rather than an optional safeguard.
Evaluating operational resilience ultimately gives investors a realistic view of downside risk, enabling sharper valuation decisions and earlier intervention before disruptions escalate.
Besides location and resilience, PE teams need to understand how each facility affects the deal’s financial profile.
Verifying a company’s operational footprint acts as a bridge between ground reality and valuation.
For example, an underperforming site is a likely candidate for divestiture, while a high-margin or strategically positioned facility may justify accelerated post-acquisition investment.
As AuditBoard’s Alan Gouveia explains, clearer inputs mean clearer probabilities and financial costs.
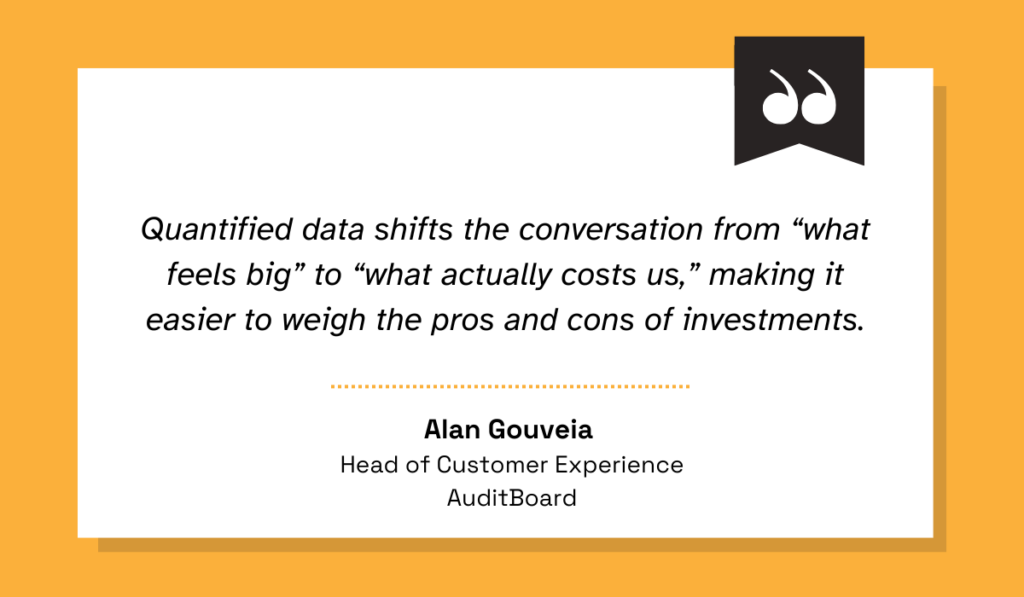
Illustration: Veridion / Quote: AuditBoard
To put it simply, quantification turns risk into palpable, negotiable figures.
When cost contribution is expressed in numbers, it becomes far easier to defend pricing, insurance requirements, and integration priorities.
What this step really aims to uncover is which operational levers meaningfully influence the deal thesis.
So, what falls under cost contribution?
At the surface level: physical scale, revenue generation, and operational throughput.
Different intelligence tools are especially adept at quickly surfacing insights and outlining the components that inflate or suppress contribution, as illustrated with this overview of a General Motors facility.
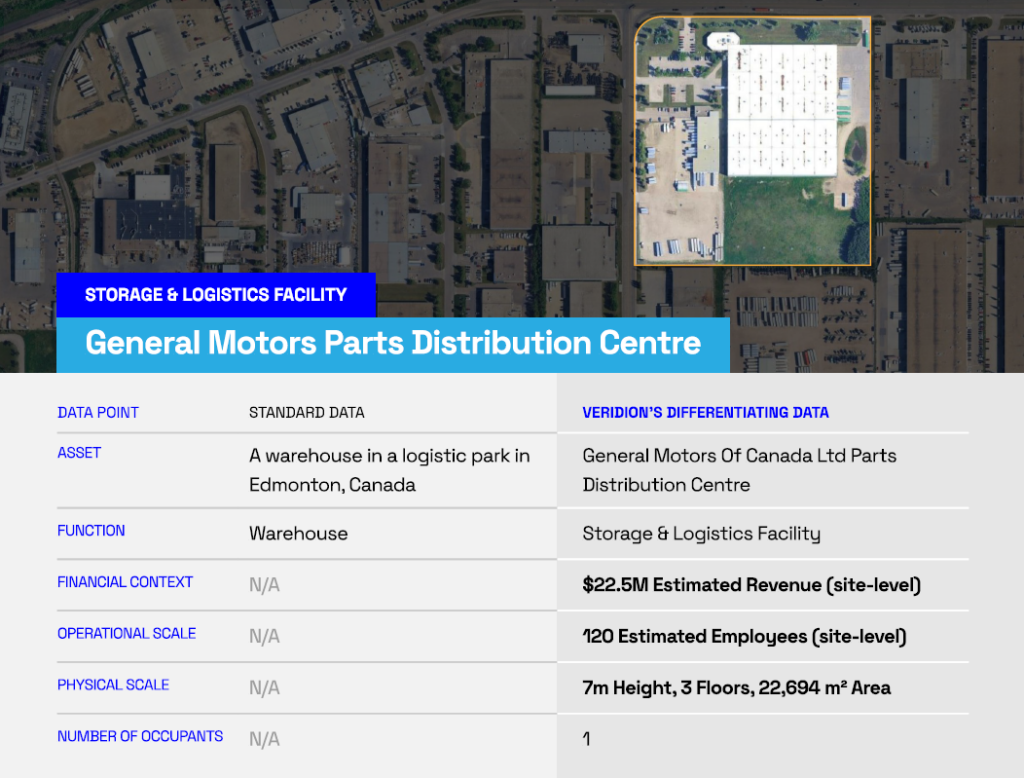
Source: Veridion
When you figure in additional data points, such as production intensity or historical downtime patterns, a cost profile can turn out to be far higher than initially modeled.
For instance, a midsize distribution hub is likely to be modeled as a low-risk, low-value site, but once its true role in last-mile delivery is accounted for, the financial contribution shifts significantly.
What looked “small” on paper becomes a revenue-critical node once you’ve mapped its high dispatch volume, time-sensitive goods, or contractual service-level penalties.
The takeaway is simple: when contribution is quantified at the site level, you avoid mispricing facilities while at the same time gaining a more realistic picture of where value is truly created.
By the time all locations, dependencies, and risks have been verified, investors have all the ingredients they need to make a data-driven assessment.
However, operational diligence is just one part of the connective tissue that makes up a broader due diligence process.
The operational footprint can be considered the foundation that clarifies how the business truly works, but it still needs to be integrated with other relevant insights.
Neil McFerran, EY partner and expert in due diligence and post-merger execution, emphasizes why this integration matters:
“Employing an integrated approach that takes a holistic view of a target’s strategy, operations, financial, tax and other circumstances is essential to identifying and understanding the extant opportunities for value creation.”
In other words, robust diligence practices enable a holistic review of cash, operations, commercial, and digital.
For this to happen, operational verification needs to tie into other diligence streams, namely, with financial, commercial, and ESG assessments.
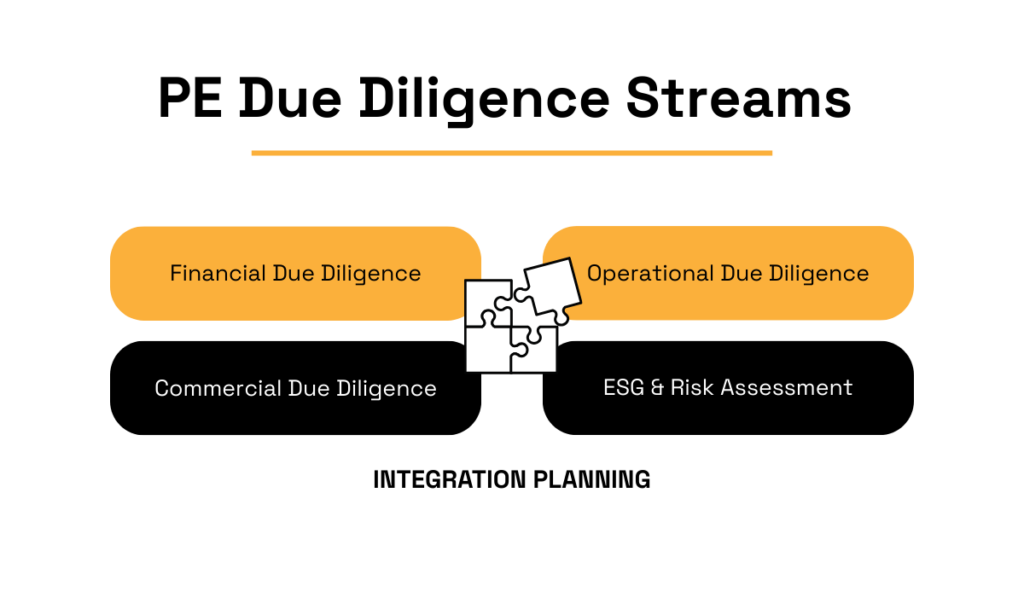
Source: Veridion
Together, these key components contribute to sharper scenario modeling, based on real operational capabilities, improved post-close planning, and greater overall synergy.
When all findings roll up into one integrated view, investors gain a far more realistic picture of deal value and can move forward with confidence backed by evidence, not assumptions.
Conducting private equity due diligence means taking the time to map, validate, and interrogate every operational node before advancing to valuation.
Beyond mapping specific locations, due diligence teams uncover operational discipline, data transparency, and structural resilience behind them.
A company with gaps, inconsistencies, or concealed dependencies sends a clear signal that it would be best to steer clear.
Meanwhile, a thoroughly verified footprint signals stronger governance and fewer surprises.
The firms that succeed in differentiating between the two are those that treat operational verification as a strategic capability, rather than a checklist.