
Blog
Data Collection Methods for E-Commerce Market Intelligence
By: Stefan Gergely -
12 June 2026


We love our data, and now that you're here, you're one step closer to loving it too.
A wide sample of data, so you can explore what is possible with our data
Choose ->
built with procurement in mind. Focused on manufacturers, products and more
Choose ->
built with insurance in mind. Focused on classifications, business activity tags and more
Choose ->
built with sustainability in mind. Focused on sustainability commitments, and environmental and social governance insights.
Choose ->
built with strategic insights in mind. Focused on market trends, competitor analysis, and industry-specific data
Choose ->

Keep up to date with our technology, what our clients are doing and get interesting monthly market insights.

Key Takeaways:
What if more than half of your customers never even saw your website before deciding what to buy?
Today, 56% of US shoppers start their product searches on Amazon, not on Google, and not on your storefront.
In a market where buyers form preferences before they ever land on your page, the companies that win in e-commerce are rarely the ones with the best instincts.
They’re the ones with the best data.
This guide covers six proven methods for gathering e-commerce market intelligence, what each one does well, and where it breaks down.
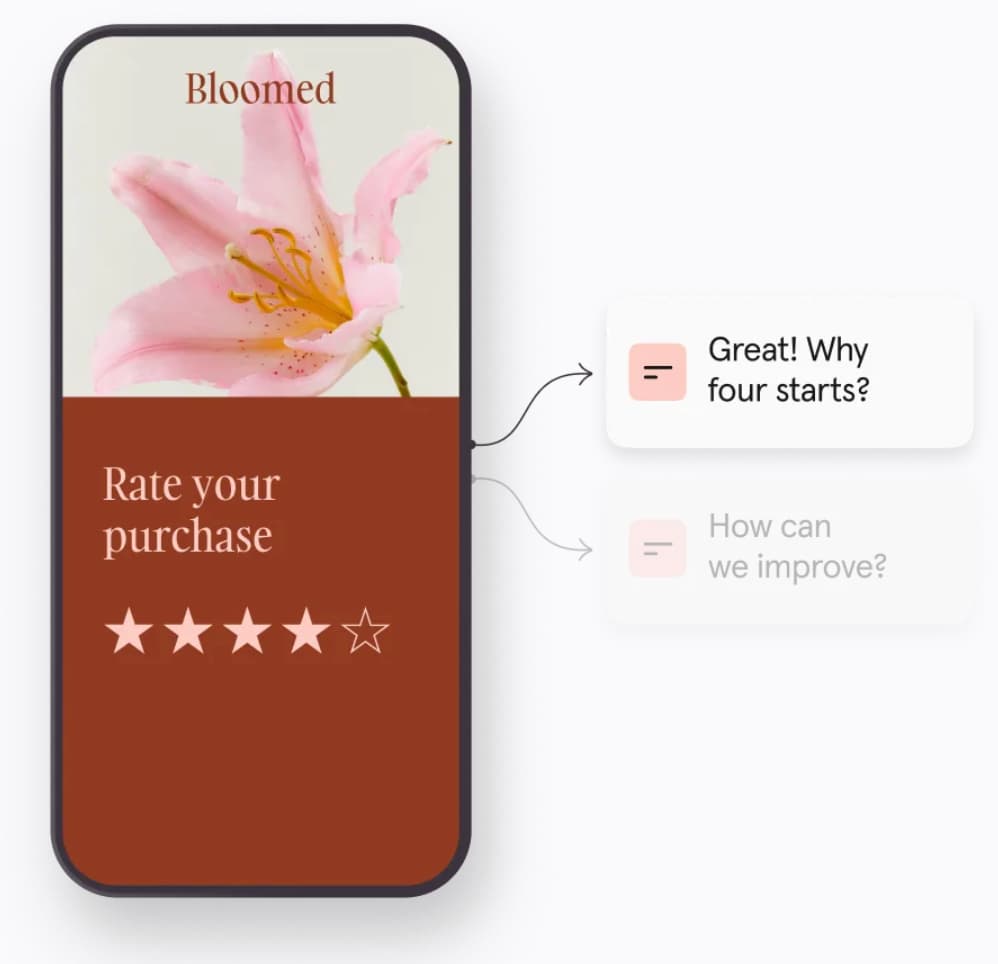
Surveys are the bluntest instrument you have and often one of the most useful. They let you skip the guesswork and ask customers outright.
A structured questionnaire sent through email, a website pop-up, or a post-purchase flow can surface motivations, satisfaction levels, price sensitivity, and unmet needs that behavioral data alone never explains.
The appeal is obvious. Data comes straight from the source, surveys are cheap and quick to launch, and you can slice the responses by whatever audience cut you care about.
There are now tools like SurveyMonkey and Typeform (shown below) that handle the mechanics, so you don’t have to worry about too much repetitive work.
Source: Typeform
But even though digital tools handle the boring and labor-intensive part, it’s still up to you to design your surveys well.
Here are a couple of things to keep in mind.
| Ask at the right moment | Pre-purchase surveys, served on product pages or as exit-intent prompts, catch buying intent and the reasons people walk away |
| Mix question types | Ensure there are both open- and closed-ended questions |
| Keep the form short | People won’t bother if the survey is too long |
| Use a small incentive carefully | It can pull in replies organic outreach misses, but it also attracts people answering for the reward rather than the topic |
| Segment responses | Segment by new versus returning buyers to compare how each group reads your pricing, shipping, and product range |
The reason getting the design right is so important is that, despite their many perks, surveys generally have lower response rates.
In fact, according to research from SurveyMonkey, response rates between 10–30% are considered solid for online surveys.
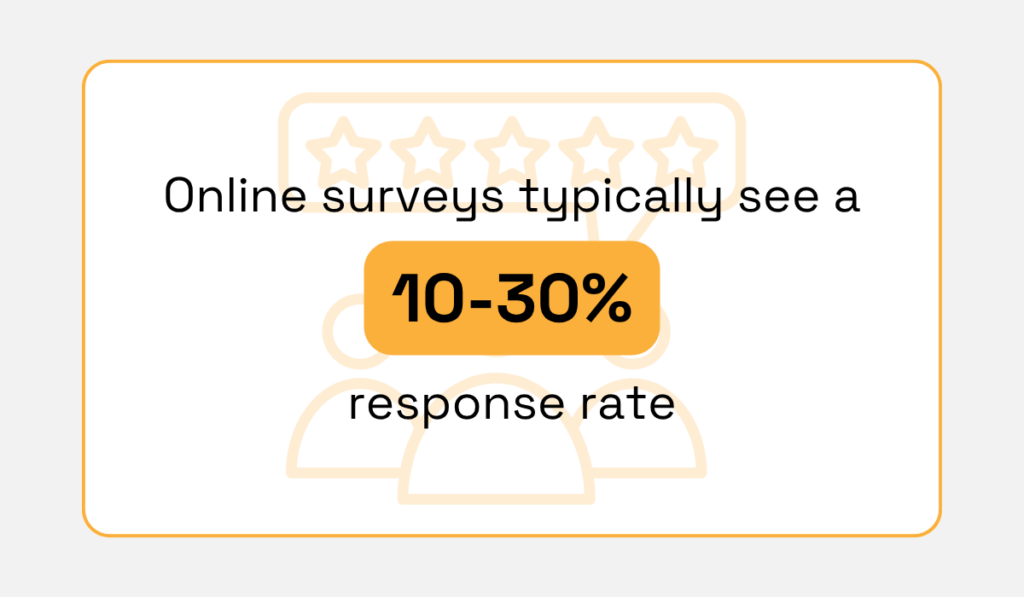
Illustration: Veridion / Data: SurveyMonkey
Therefore, if designed poorly, your surveys won’t get that many responses.
Moreover, surveys capture what people say, not always what they do. Self-reported answers carry recall and social desirability biases, and survey fatigue keeps sample sizes thin.
A survey can tell you where customers land, but not how they got there. To understand the reasoning behind their answers, you need to hear them think out loud.
This method works with smaller groups than surveys, but what you learn goes deeper.
A moderated discussion among a small group of customers draws out perceptions, attitudes, and reactions that a checkbox can never capture.
You see hesitation, watch opinions shift mid-conversation, and pick up the language people actually use to describe your product. That kind of deep insight is hard to get any other way.
When it comes to focus groups, where you hold the session shapes both cost and reach, which is why the format has shifted sharply online in recent years.
| In-person | reads body language better, but costs more and limits geographic reach |
| Online | widens your reach and cuts costs, though it loses some of the physical cues |
In fact, research from Greenbook found that in-person focus groups and interviews fell from 93% usage among research buyers to just 35% during the pandemic.
At the same time, online qualitative research climbed from 68% to 85%.
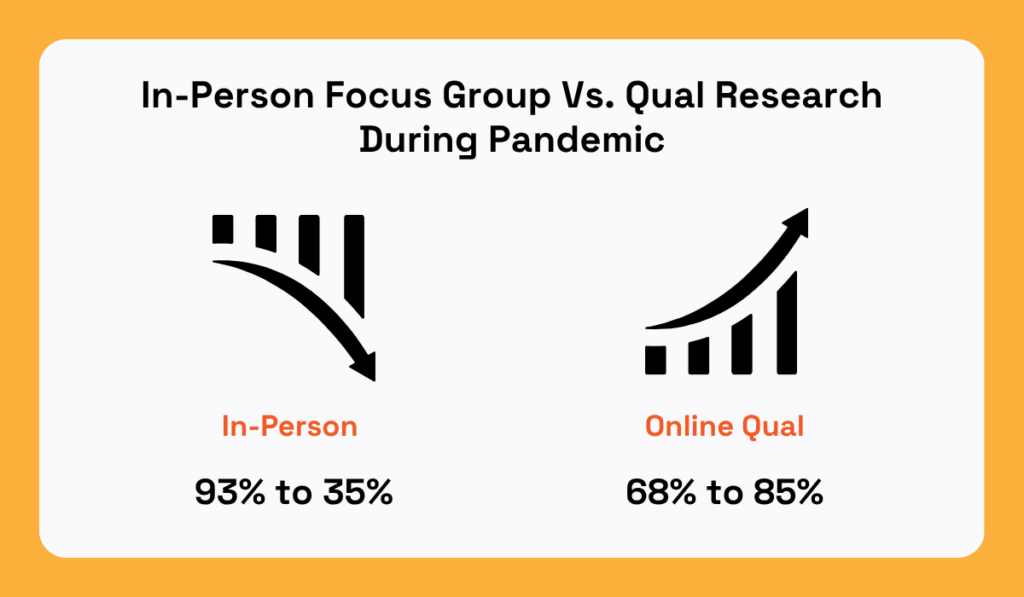
Illustration: Veridion / Data: Greenbook
E-commerce teams reach for focus groups when data alone cannot answer the ‘why’ behind the customer behavior.
In other words, this method is typically applied for:
A brand weighing a new label often learns more from watching five shoppers hesitate over it than from a thousand who rate it online.
The discussion gives you the vocabulary, objections, and emotional cues that sharpen everything from product copy to ad creative.
However, it’s worth noting that the method is slow and costly, and it carries a subtle risk.
A moderator can steer a room toward a preferred answer, and one confident voice can drown out the rest.
A skilled facilitator counters that by keeping questions neutral and drawing out the quieter voices before the room settles on one view.
But in the end, both surveys and focus groups share a blind spot.
Both rely on what customers are willing to tell you, and what people say they do rarely matches what they actually do.
That’s why it’s sometimes better to stop asking and start watching.
Web analytics show you what customers actually do and not what they say they do, by recording visitors’ actions on your site, click by click.
Platforms like Google Analytics and Adobe Analytics track where visitors come from, which pages hold attention, where shoppers stall, and which paths end in a purchase.
And that kind of information can be vital for solving one of the biggest challenges in e-commerce: cart abandonment.
Baymard Institute, aggregating 50 separate studies, puts the average cart abandonment rate at 70.22%, and estimates that better checkout design alone can lift conversions by as much as 35%.
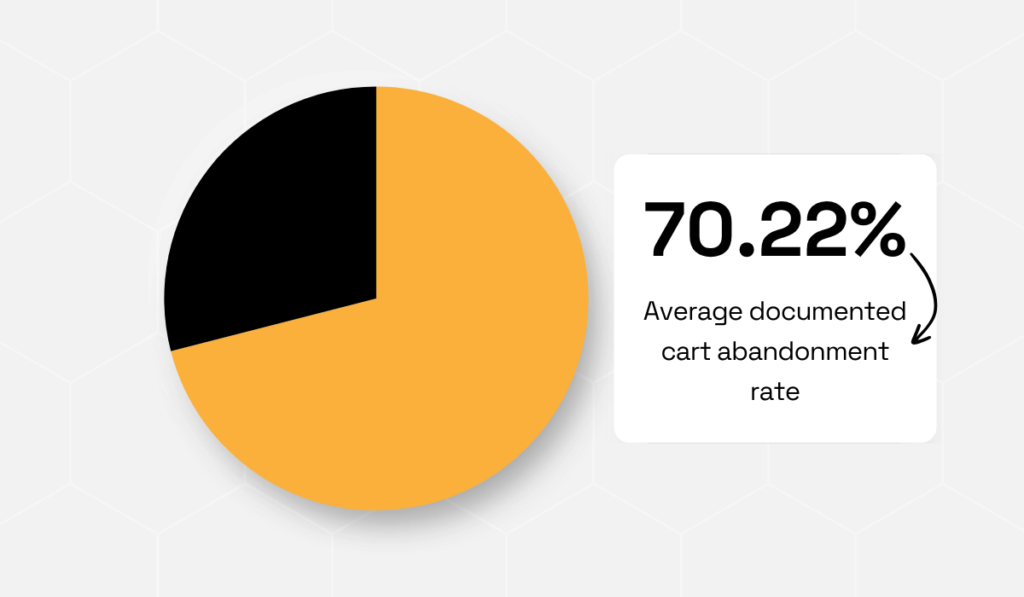
Illustration: Veridion / Data: Baymard Institute
By collecting that valuable website data, you can spot areas for improvement and minimize this huge problem.
For instance, using the funnel analysis, you could map each step from landing page to checkout, see exactly where buyers drop off, and then test fixes against that drop-off with A/B experiments.
That way, you create a kind of loop of improvement: the funnel flags the leak, the A/B test confirms the fix, and the next report tells you whether it held.
Funnel data tells you which part of that leak is yours to fix.
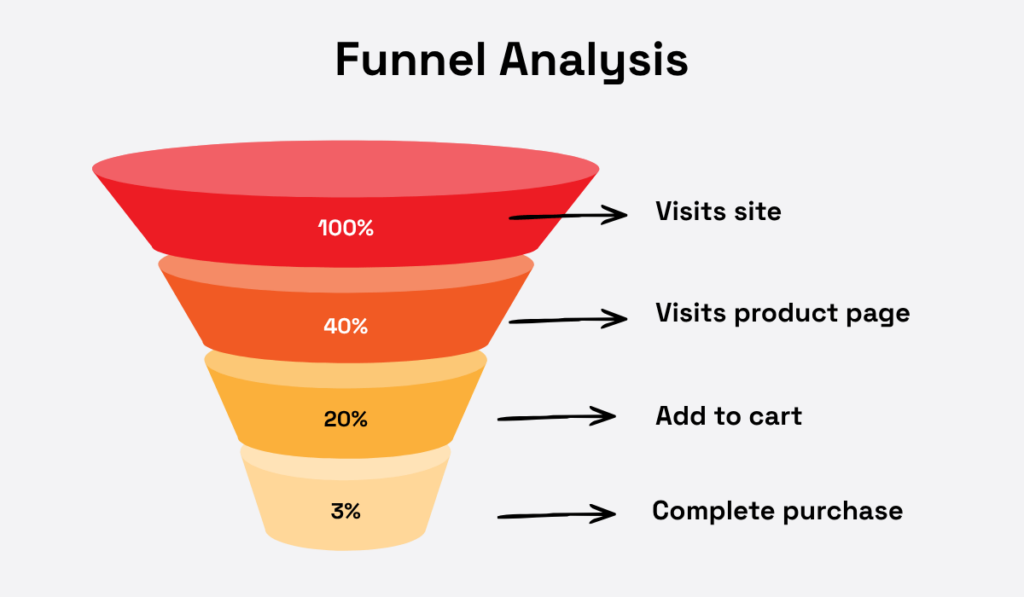
Source: Veridion
Of course, there are limits to this method as well, and they are rather obvious.
Analytics only sees your own site. It tells you what happened, rarely why, and nothing about the conversation happening elsewhere.
It’s undeniably useful, but it needs to be supplemented with additional insights.
Social media listening turns public chatter into structured insight.
Using tools like Hootsuite or Sprout Social, you monitor brand mentions, keywords, hashtags, and emerging trends across platforms.
Then AI and natural language processing help read those sentiments at scale.
Sentiment analysis is the workhorse here.
As shown in the example below, it reads each mention and tags it as positive, negative, or neutral, with more advanced models drilling into specific emotions like frustration, excitement, or confusion.
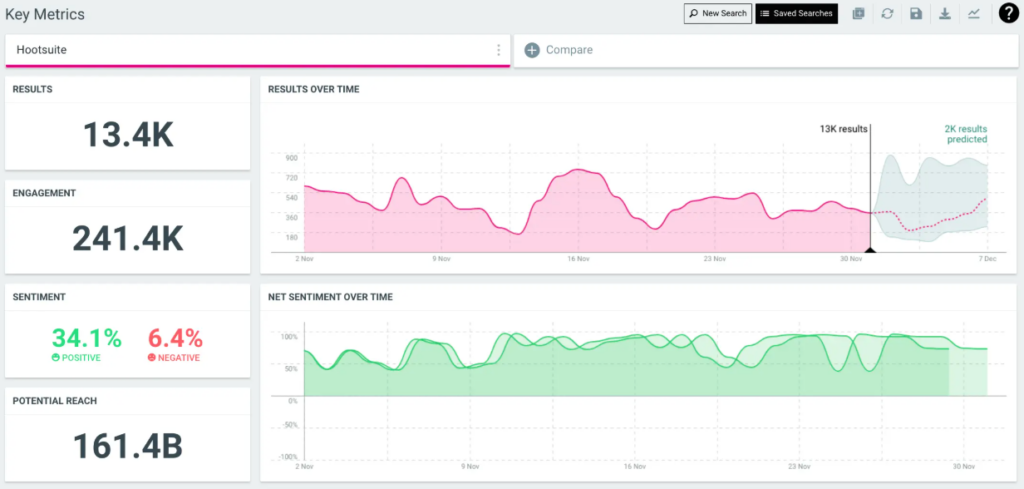
Source: Hootsuite
Many tools also cluster mentions by topic, separating shipping complaints from product complaints automatically.
The volume of social chatter makes this kind of automation non-negotiable.
A mid-sized brand can pull in tens of thousands of mentions a week, well beyond what any team could read by hand.
The AI does the reading, so you can spend time acting on what gets flagged rather than sifting through it.
Done well, it catches a complaint, a competitor stumble, or a rising product trend before it shows up in your sales figures.
That early signal matters more each year because social is now where buying decisions are formed.
Research from Sprout Social found that 76% of users say social content influenced a purchase in the past six months, a figure that climbs to 90% among Gen Z.
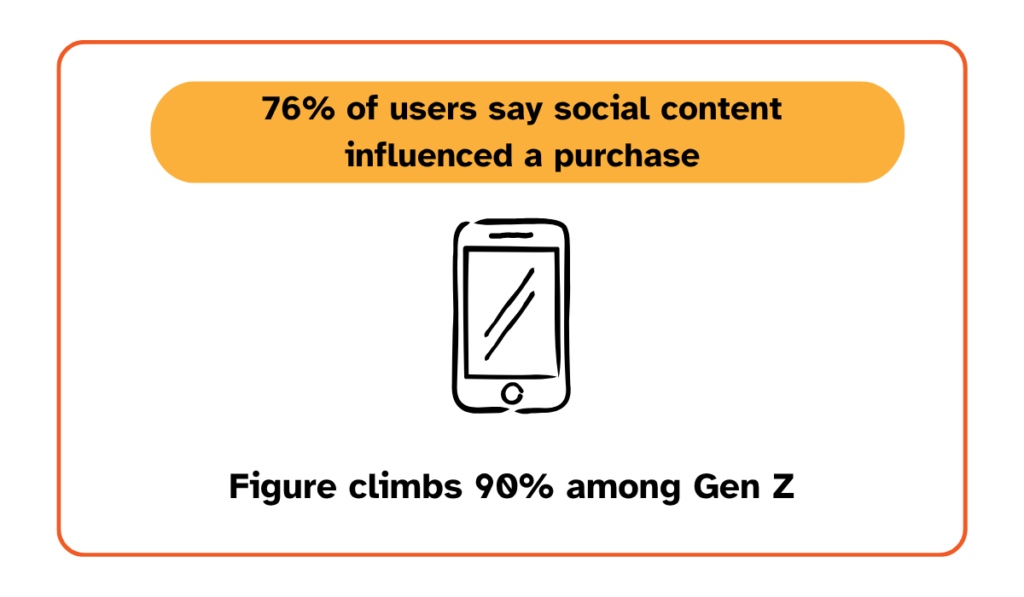
Illustration: Veridion / Data: Sprout Social
That’s why paying attention to social media matters so much for e-commerce sellers.
It allows them to track which products people praise, which they return, and which trend is about to spike, so they can act accordingly and stay ahead of demand rather than behind it.
For example:
| Defect detection | A spike in negative mentions usually signals a product problem before the returns arrive |
| Trend detection | A rising hashtag or search term surfaces while there is still time to stock for it; the seller who restocks a suddenly viral product in days captures the demand that slower rivals forfeit |
| Competitive tracking | Monitoring the share of voice against named competitors shows whether your audience is drifting toward a rival before that shift reaches your revenue |
Now, social media listening tells you how people feel and what is gaining momentum, but it is weaker on hard numbers.
A viral post does not always convert to sales, and slang or sarcasm can fool even good sentiment models.
Listening is a leading indicator, not a sales report. When you need proof of what genuinely sells, you follow the buyers to where the money actually changes hands.
For a broader view of reading the competitive field, see our guide to competitive intelligence.
Marketplaces are the largest open record of buying behavior in e-commerce.
Analyzing data from platforms like Amazon and eBay surfaces best-selling products, live pricing trends, competitor assortments, and demand signals you cannot see from your own storefront.
Unlike a survey, it records what people actually bought, not what they claimed they would.
Here are some examples of what kind of data can be found on such platforms and how it can be used:
| Review mining | Pulls recurring themes, complaints, and feature requests from customer reviews. A cluster of one-star reviews citing the same flaw is a competitor weakness you can design around |
| Dynamic pricing analysis | Tracks how competitors move their prices over time, so you can position yours with evidence rather than instinct. |
| Best-seller rankings and assortment data | Shows where demand is heading and which gaps in a competitor’s catalog are worth filling |
| Seasonality patterns | Shows the weeks a product actually moves, so you can plan inventory around real demand rather than gut feel |
Each marketplace fences in its own data; access through official channels can be limited, and the raw feed is noisy.
Notice the thread running through all five methods so far. Every one of them puts the work of gathering and cleaning the data squarely on you.
The last approach turns that on its head, handing you intelligence that has already been collected and made ready, which is also how the best teams gather market intelligence across the wider market.
Third-party data providers hand you the finished product, so the gathering is already done before you start.
Instead of building pipelines and scraping platforms, you buy clean, structured datasets ready to plug into your analysis.
Some providers cover market trends and size. Others track consumer behavior. The rest focus on the businesses you compete with or buy from, the raw material of solid B2B market intelligence.
So why buy instead of build?
Because these platforms offer speed, coverage, consistency, and freshness that no other method can compete with.
Research shows that the state of business data is already poor as is. Not just in e-commerce, but everywhere.
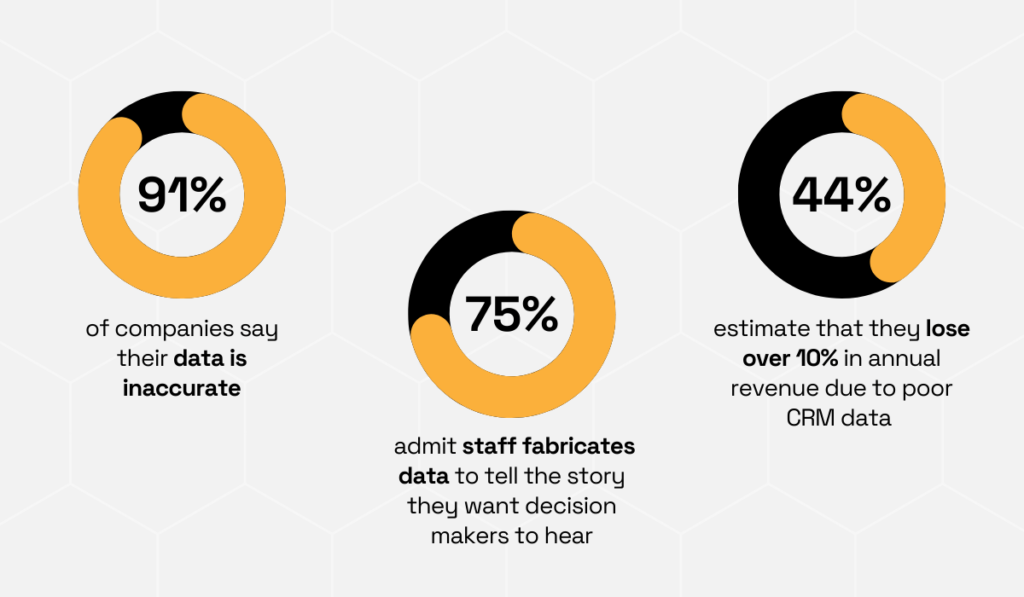
Illustration: Veridion / Data: Validity
So why risk it even further and neglect your data quality? Especially when there are now tools that do all the heavy lifting for you.
Matching the provider to your question is what matters: market-level data sizes an opportunity, consumer-level data explains demand, and company-level data tells you who you are up against and who can supply you.
For most e-commerce teams, the last of those is the hardest to build in-house. That’s where platforms like Veridion come in.
Veridion is an AI platform that delivers B2B firmographic and company intelligence on more than 134 million companies across 250+ countries, refreshed weekly, with details down to the product level.
Source: Veridion
For an e-commerce seller, Veridion helps with two big tasks at once:
And with over 300 company attributes, Veridion provides truly deep, actionable business profiles that power strategic decision-making.
Some of the data points you’ll find in these profiles are:
You can explore the full picture in its data dictionary and its data for market intelligence.
The result turns weeks of manual research into a single structured query.
No single method gives you the whole market.
Surveys and focus groups explain the why, web analytics and marketplace data reveal the what, social listening catches the shift before it trends, and third-party providers cover what you can’t collect yourself.
The strongest e-commerce teams layer them together rather than betting on one.
So start with the question you most need answered, choose the method that fits it, and build out from there.
Your next smart decision will only ever be as good as the data sitting behind it.