
Blog
How Businesses Turn Raw Data Into Meaningful, Actionable Insights
By: Stefan Gergely -
20 June 2026


We love our data, and now that you're here, you're one step closer to loving it too.
A wide sample of data, so you can explore what is possible with our data
Choose ->
built with procurement in mind. Focused on manufacturers, products and more
Choose ->
built with insurance in mind. Focused on classifications, business activity tags and more
Choose ->
built with sustainability in mind. Focused on sustainability commitments, and environmental and social governance insights.
Choose ->
built with strategic insights in mind. Focused on market trends, competitor analysis, and industry-specific data
Choose ->

Keep up to date with our technology, what our clients are doing and get interesting monthly market insights.

Key Takeaways:
Millions of raw data points are generated today.
But can you boldly say yours is impacting your business decisions, or is it sitting idly in the dashboard?
Too many businesses are drowning in unnecessary data without knowing what to do with it.
But that ends today because this guide gives you all the steps you need to make the best use of your raw data.
The more specific your questions are, the better your chances of getting useful insights.
So, before your data analysis, you need to know exactly what business decisions and areas you’re trying to improve.
Research shows that 84% of business leaders already consider data-driven decision-making the most critical skill for their teams.
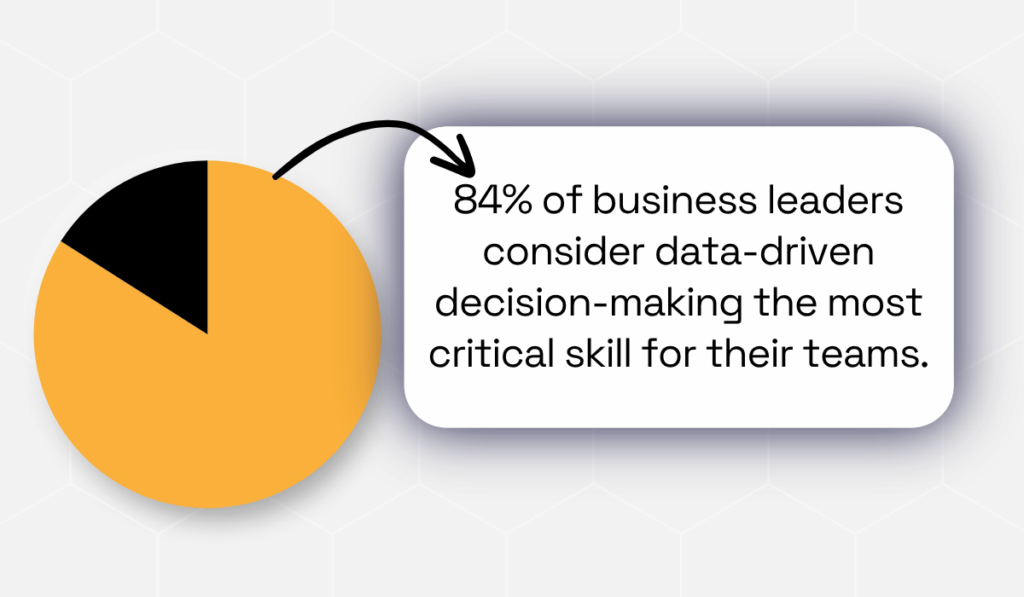
Illustration: Veridion / Data: Datacamp
So, the correlation between data and accurate decision-making is clear to most.
Yet, many companies still launch analysis initiatives without clearly defining what decisions those initiatives are meant to support.
Without that clarity, you end up analyzing everything and acting on nothing.
The question you’re starting with determines what data you collect, interpret, and ultimately make decisions on.
But before even touching your data, you need to bring in stakeholders from sales, marketing, and product.
They have the knowledge of what’s happening within different departments that no dashboard will show you.
This means that their questions are also a lot more detailed and specific, so information doesn’t die in silos.
Apart from being detailed, having interdepartmental collaboration helps you move past this stage a lot faster while having all teams on the same page.
With everyone being on the same page, each team can share its expertise with one another and avoid things like duplicated work or time-wasting situations.
Their suggestions are what will give you a full understanding of your business goals.
Every bad insight starts with bad data.
To prevent that, you follow the right steps to ensure data reliability:
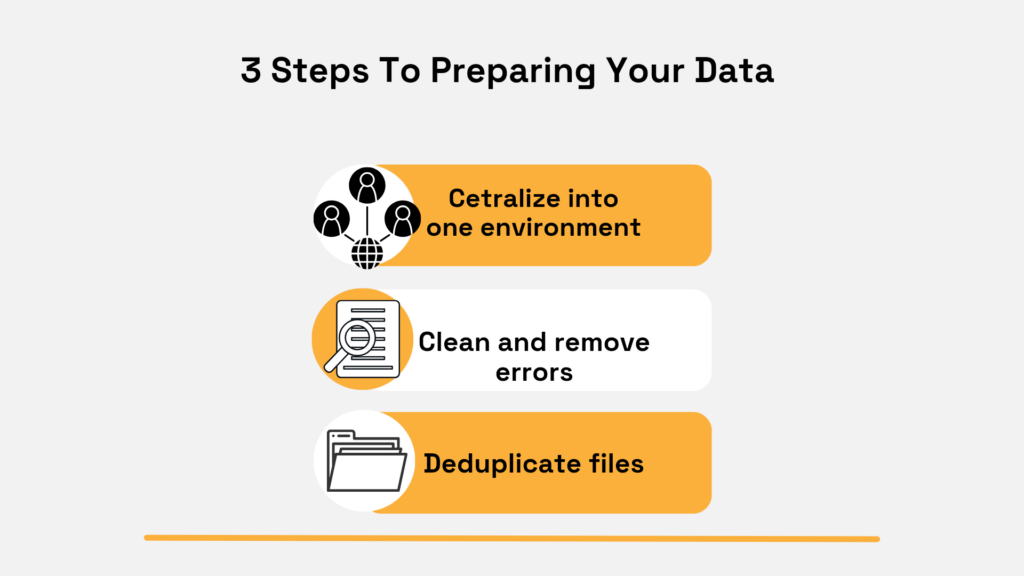
Source: Veridion
Centralizing data entails pulling data from every system it’s currently in, including your CRM, ERP, procurement platforms, customer support systems, and so on, into one unified environment.
When all your data sources are centralized, it’s much easier to act on the relevant information.
Right after, you move to cleaning it.
Here, you remove errors and fill gaps where possible.
You’re looking for things like a contact record with a missing industry field, a transaction logged in two currencies, and so on.
Lastly, with deduplicating, you’re making sure the same entity doesn’t appear twice under different names or IDs.
Skipping any of these means you risk losing an average of $12 million dollars per year due to poor data management.
At least that’s what research suggests:
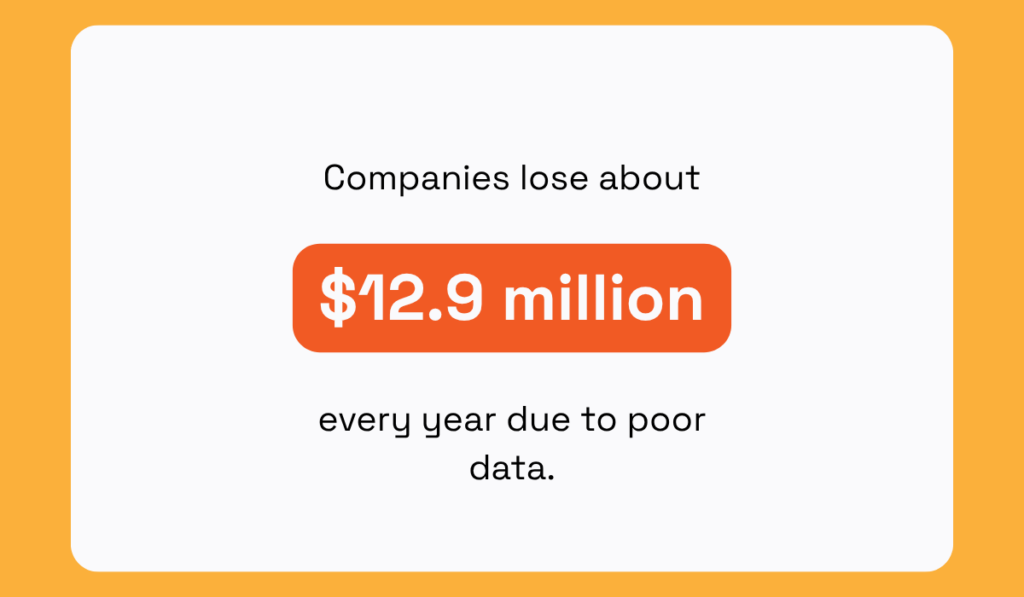
Illustration: Veridion / Data: Gartner
JPMorgan Chase is a perfect example of how important these steps are.
Between 2014 and 2023, trading and order data across their Corporate and Investment Bank were never fed into their trade surveillance platforms.
The gaps were undetected across at least 30 global trading venues for nearly a decade.
When found, in March 2024, the Federal Reserve and the Office of the Comptroller of the Currency fined the bank $348.2 million.

Source: Investment News
They always had the data, but they never centralized, monitored, or prepared correctly.
Your internal data tells you what happened inside your company. It doesn’t tell you what’s happening outside it.
Take your CRM, for example, it holds transaction history, contact records, past interactions, and maybe some behavioural patterns.
But, it’s mostly a starting point because it can’t tell you:
To get the complete picture, you’ll need to enrich it with verified external data.
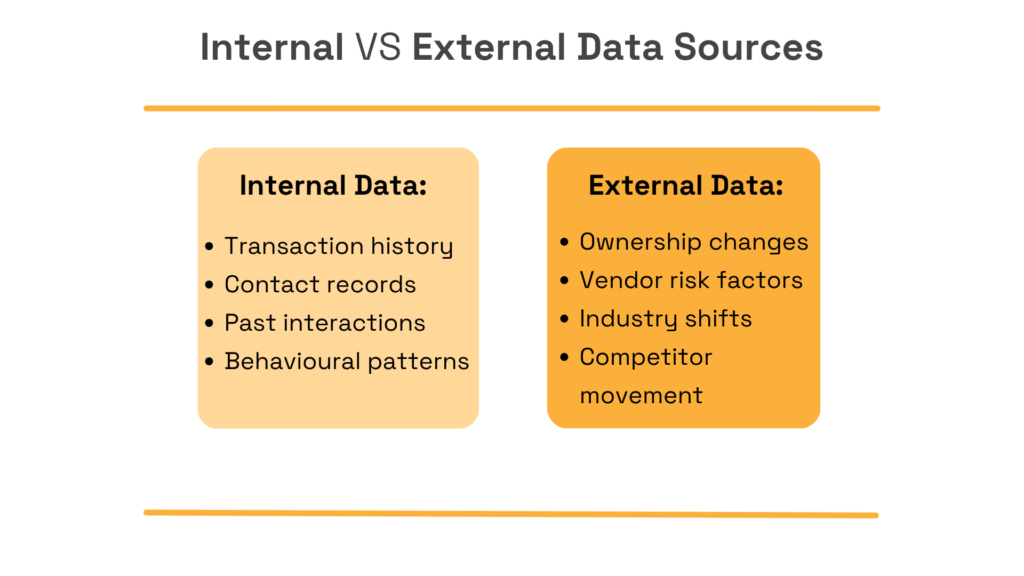
Source: Veridion
Did you know that, according to a Precisely report, data enrichment is becoming one of the fastest-growing initiatives among companies, increasing from 23% in 2023 to 28% in 2024?
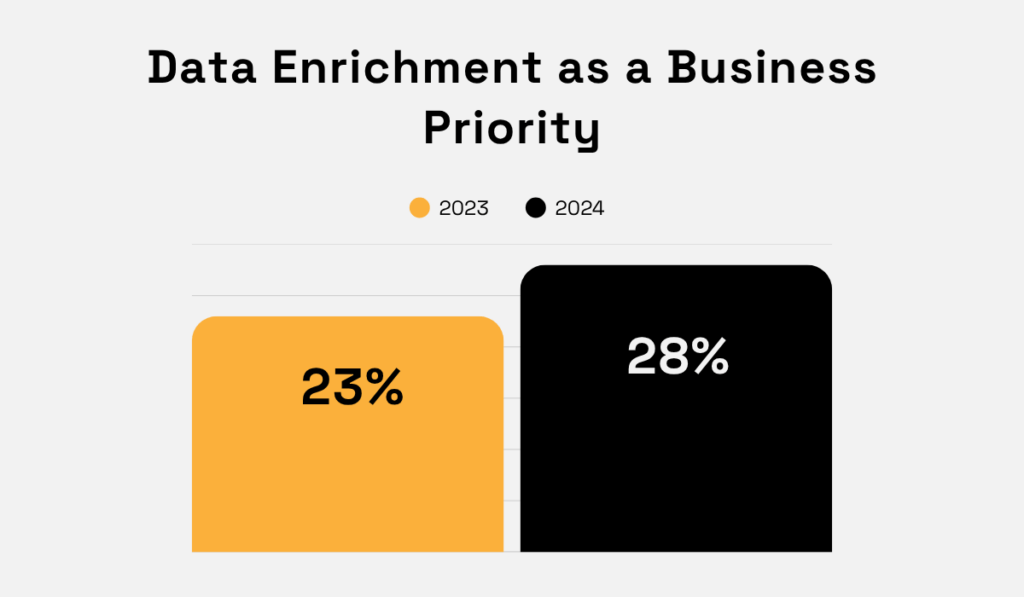
Illustration: Verdion / Data: Precisely
The reason for this is very straightforward: enriched data gives analysts the external context their internal records are missing.
For enterprise teams working with supplier, vendor, or market data, that’s where a data enrichment platform like Veridion comes in.
Veridion is a business data intelligence platform purpose-built for enterprises that need verified, continuously updated information on companies across the globe.
Its Match & Enrich API continuously scans over 130 million companies across 250 geographies to bring verified external attributes directly to your existing records.
It covers:
Unlike legacy enrichment tools that rely on static datasets updated annually,
Veridion’s data refreshes continuously, so the external context your teams are working from reflects the world as it is today, not as it was 12 months ago.
You can learn more about how it all works in the video below:
Source: Veridion on YouTube
Data enrichment is absolutely vital for modern businesses. But it doesn’t have to be tedious, complex, or time-consuming.
The next step is choosing the analytical method that matches what you’re actually trying to find out.
If you’re asking, “How has customer retention changed over the last 12 months?” That’s a trend analysis question.
Whereas, if you’re asking “which marketing channel actually drove our Q3 pipeline growth?”, that’s an attribution modelling question.
Research by SoftServe shows that 58% of business leaders say key business decisions are based on inaccurate or inconsistent data.
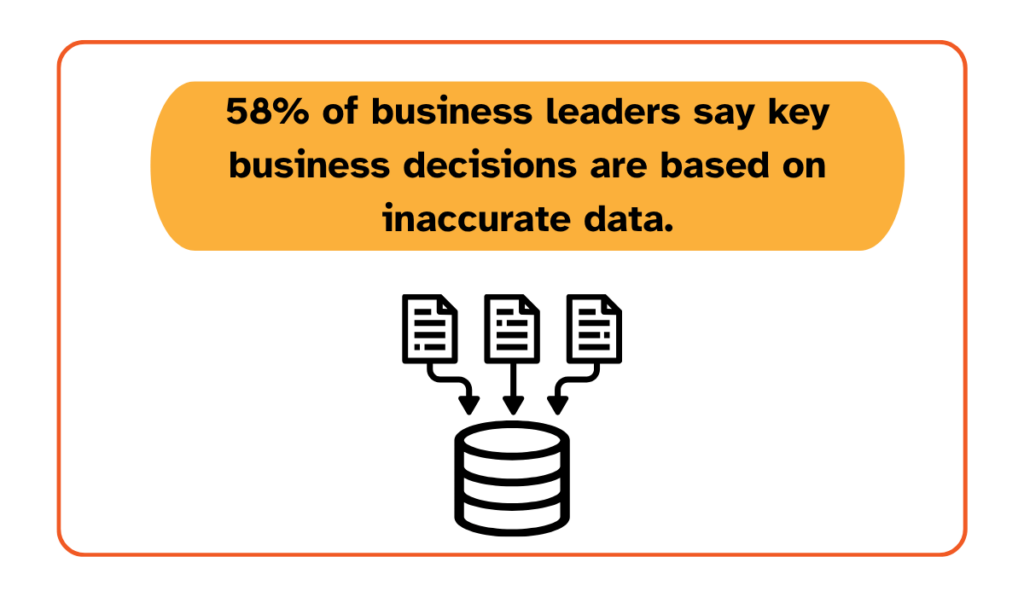
Illustration: Veridion / Data: SoftServe
Often, poor technique selection can be a significant part of that problem.
However, it can easily be solved by understanding the four analytical methods most relevant to enterprise decision-making.
One of them is trend analysis, which maps patterns over time.
With it, you collect data points over a defined period and look for a directional movement, which could be upward, downward, or flat.
Another is cohort analysis.
It allows you to group users or customers by a shared characteristic, such as when they signed up, the product they bought, and the region they’re in, and tracks how each group behaves over time.
Another, more recent, technique is predictive analytics, which uses historical patterns to forecast future outcomes.
It is not just “what happened?” but “what is likely to happen next?”
Starbucks built an entire expansion strategy around it.
Before committing to any new store location, the company runs location-based predictive analysis using Atlas, a mapping and business intelligence tool developed by Esri.
It evaluates population density, income levels, traffic patterns, and competitor proximity, then uses that data to forecast revenue and profitability for that specific location before a single dollar is spent.
Finally, attribution modelling answers a different question from the rest.
Instead of asking “what happened?”, it focuses on “what caused it?”
So, if your Q3 pipeline grew 40%, attribution modelling tells you which channels, campaigns, or touchpoints actually drove that growth.
All of these techniques should be used based on the business questions you defined in step one.
From there, the right method becomes obvious.
A spreadsheet full of numbers tells you something happened.
A well-built visualization tells you what it means and what to do about it.
As British data journalist and information designer David McCandless puts it:
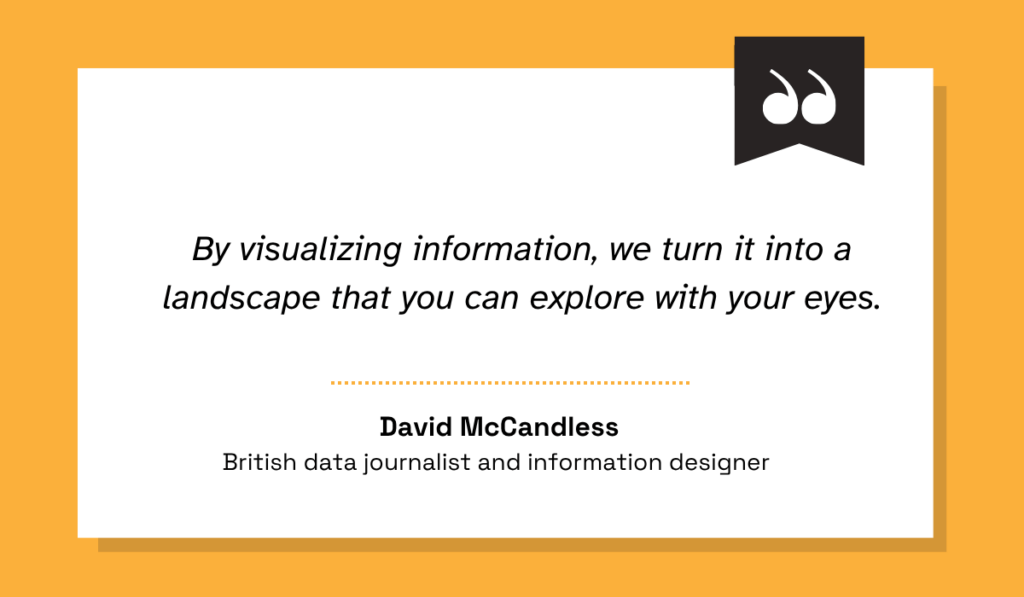
Illustration: Veridion / Quote: David McCandless
With 65% of people retaining information better when content is paired with a relevant image, David definitely isn’t wrong in his statement.
For every visualization, the goal is to make your data impossible to misread.
There are plenty of methods to choose from, each built for a different purpose.
Here’s the breakdown:
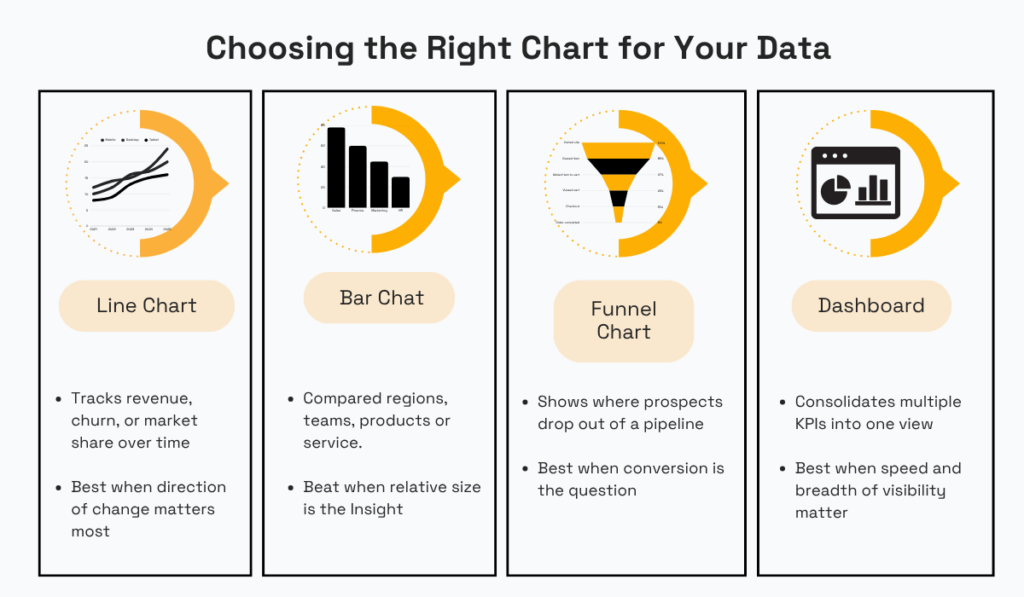
Source: Veridion
This advice might seem simple enough, but don’t underestimate its power.
The right data visualization method can reveal hidden patterns, accelerate data comprehension, and even help non-technical stakeholders quickly grasp insights to drive informed decisions.
A number on a dashboard means nothing until you understand what it’s being compared against, what was happening in the business when it was generated, and what external forces might have shaped it.
Coca-Cola learned the cost of this early on.
In 1985, the company ran 200,000 blind taste tests before launching New Coke.
The data showed that consumers preferred the sweeter formula. So they pulled the Classic Coke from shelves entirely.
This, of course, ended up becoming a major failure, leading to hundreds of millions of dollars lost.
Why?
Because they had the right data for this, but didn’t interpret it well.
They asked which formula tasted better, when the best question should have been how consumers would feel about losing a taste they’ve had for over 70 years.
Donald Keough, the longtime president of the Coca-Cola Company in 1985, commented:
“The simple fact is that all of the time and money and skill poured into consumer research on a new Coca-Cola could not measure or reveal the depth and abiding emotional attachment to the original Coca-Cola felt by so many people.”
That kind of failure happens at every stage and scale.
And the reason it keeps happening is that many are still treating the data as self-explanatory.
When a number moves on the chart, the first instinct is to explain it, forgetting that numbers barely tell the full story.
For example, if your metrics show that revenue is up 20% that year, this seems like a good win, looking at it by itself.
But you could dig deeper and find out that your industry grew by over 40% that same year, which means your company is moving at a slower pace compared to the industry.
That’s how context gives you details to work with.
This is why, before drawing any conclusion from your data, you need to ask what was happening around it.
These questions help you understand how data reflects the world it was measured in.
Your entire process of defining questions, preparing data, enriching records, analyzing, visualizing, and interpreting only pays off at this final step.
In fact, research shows that 87% of companies report successful delivery of measurable business value from their data investments.
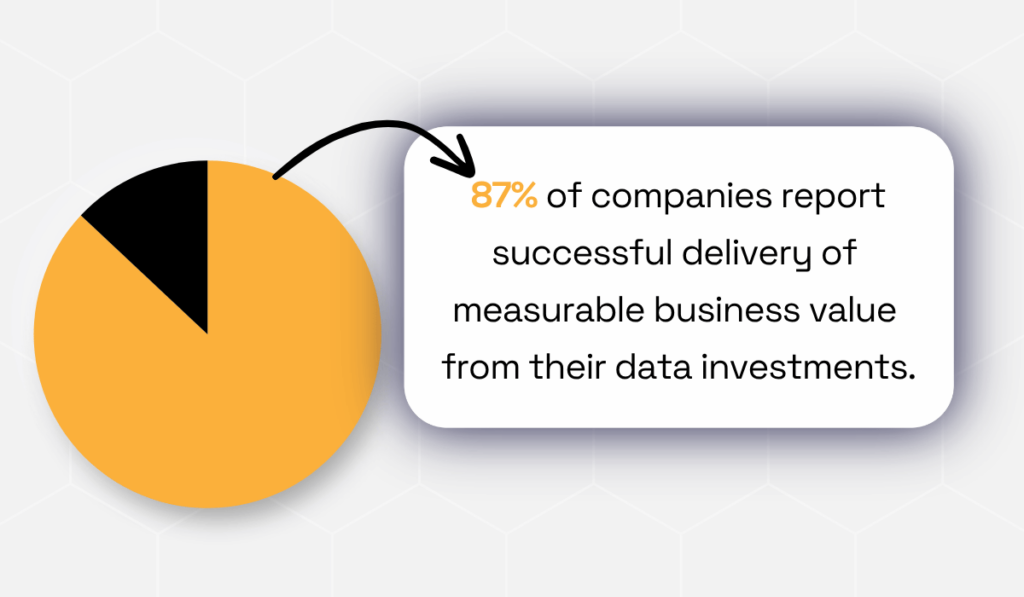
Illustration: Veridion / Data: Wavestone
Indeed, a popular job posting site is one of them.
The job matching platform built a “time to hire index” that tracks every milestone in an employer’s hiring journey from job posting to final hire.
With the insights gained from it, they prioritized a list of product improvements targeting the specific points where hiring slowed down.
All of this was because they took action based on the data they had.
Like Sowmya Parthan, their former Director of Data and Analytics said:
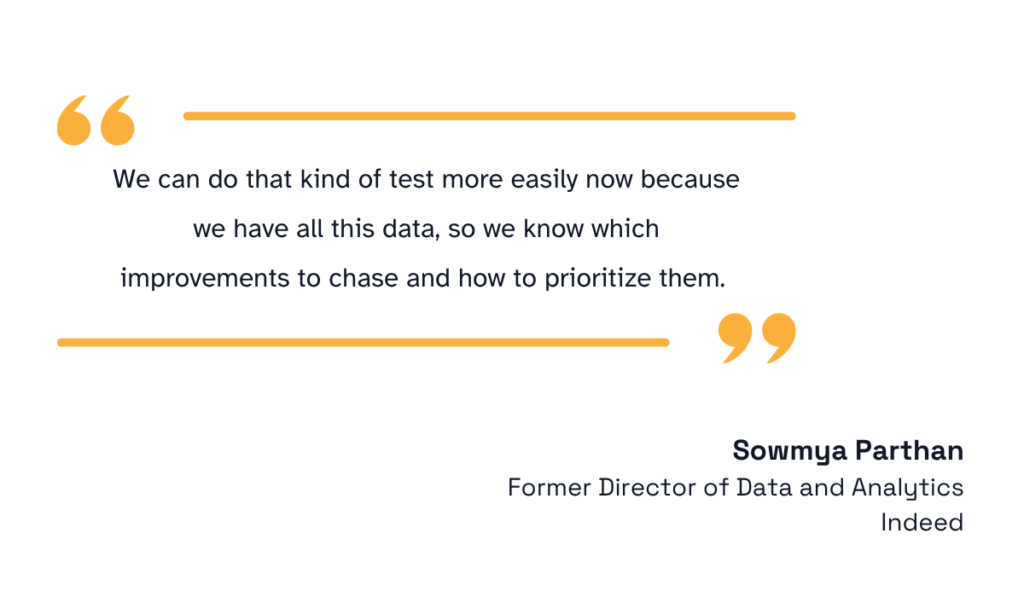
Illustration: Veridion / Quote: Sowmya Parthan
The difference between Indeed and the companies still stuck on the wrong side of that stat is how they treat insights after they surface.
When presenting data, the best approach is to provide a recommendation on what to do with it.
Without a recommendation, you put the burden on leadership to figure out the next steps, and more often than not, it rarely gets done.
Your recommendation should clearly outline the specific action to take, along with instructions on how to do it.
If your analysis shows that customers acquired through referrals have a 40% lower churn rate than those from paid channels, don’t just present the number.
Instead, recommend reallocating a portion of your paid acquisition budget into a formal referral program and set a 90-day target to measure the impact.
But that itself is not enough because if the goals are unattainable, it doesn’t matter how specific they are.
Because not all recommendations are equally important, some need to be put in place immediately, while others can be done after certain limits or milestones have been hit.
So, you want to filter them out based on what needs to be done as the first step and what takes more time based on progress.
Rather than recommending actions that can’t be easily met, be realistic and filter them based on
And to achieve this, you should have measurable KPIs in place to determine if you’re making any progress at all or not.
And with KPIs, less is best. You should teach them in moderation to avoid diluting your focus along the way.
Tracking KPIs should also be done in moderation; you don’t want to have too many things to check that dilute your focus along the way.
Focusing on 2-3 high-impact metrics that directly impact your goals and give you the biggest clarity is better than having a dozen boxes to check that take you nowhere.
Lastly, don’t try to solve it all with one big step. Start small, measure progress along the way, and make changes where possible.
Raw data has never been the problem, but not having direction on what to do with it is what leads you nowhere.
The seven steps in this guide, from defining the right questions to acting on what the analysis reveals, are what help you close the gap between what your data shows and what your business actually does with it.
Every step builds on the last. Skipping one step means the decisions you make at the end are only as reliable as the step you rushed past.
The data you already have is enough; all it takes is the decision to start with step one.