
Blog
How to Model the Financial Impact of Supplier Facility Disruptions
By: Auras Tanase -
06 March 2026


We love our data, and now that you're here, you're one step closer to loving it too.
A wide sample of data, so you can explore what is possible with our data
Choose ->
built with procurement in mind. Focused on manufacturers, products and more
Choose ->
built with insurance in mind. Focused on classifications, business activity tags and more
Choose ->
built with sustainability in mind. Focused on sustainability commitments, and environmental and social governance insights.
Choose ->
built with strategic insights in mind. Focused on market trends, competitor analysis, and industry-specific data
Choose ->

Keep up to date with our technology, what our clients are doing and get interesting monthly market insights.

Key Takeaways:
Supplier disruption is finally getting the attention it deserves.
Businesses are increasingly realizing that their partners’ failures quickly become their own, often resulting in revenue leakage, margin erosion, and operational instability.
The challenge now is to understand exactly how much those disruptions can cost you.
Is it possible to reliably model their financial impact and manage the risk before it materializes?
Absolutely.
In this article, we break down six steps for modeling the financial impact of supplier facility disruption, complete with expert insights, industry research, and real-world examples.
Let’s begin.
First, determine which suppliers are vital to your business continuity and financial performance.
After all, not all suppliers carry the same level of risk, nor do they impact your operations in the same way.
Focusing on a smaller set of critical suppliers ensures your modelling effort is concentrated where it matters most and prevents wasted time and resources on low-impact partners.
So, start by segmenting suppliers by spend as a baseline, creating a shortlist that represents roughly 80% of total spend.
However, avoid relying on spend alone. It’s not a reliable indicator of supplier criticality.
Instead, incorporate extra dimensions such as:
| Revenue or margin exposure | Which suppliers provide products or services that contribute most to revenue or profitability? |
| Criticality of supplied goods | Are the goods unique components, specialized services, or items with long lead times? |
| Substitutability | Can the supplier be replaced quickly, or is requalification required? |
| Time-to-recovery risk | How long would it take to source an alternative supplier or ramp up production elsewhere? |
| Strategic importance | Does the supplier support high-growth products, key customer contracts, or mission-critical processes? |
Assign weights or point values to each criterion based on what’s most important to your business.
For example, if supplied goods cannot be sourced elsewhere, the criticality of those goods should receive a higher weight.
Score each supplier against each criterion, multiply scores by their respective weights, and calculate a total score.
You can then use these scores to classify suppliers into tiers (e.g., high, medium, and low criticality).
According to this discussion on Third Party ThinkTank, an online community for third-party risk experts, this weighted scoring and tiering approach is commonly used across many organizations.
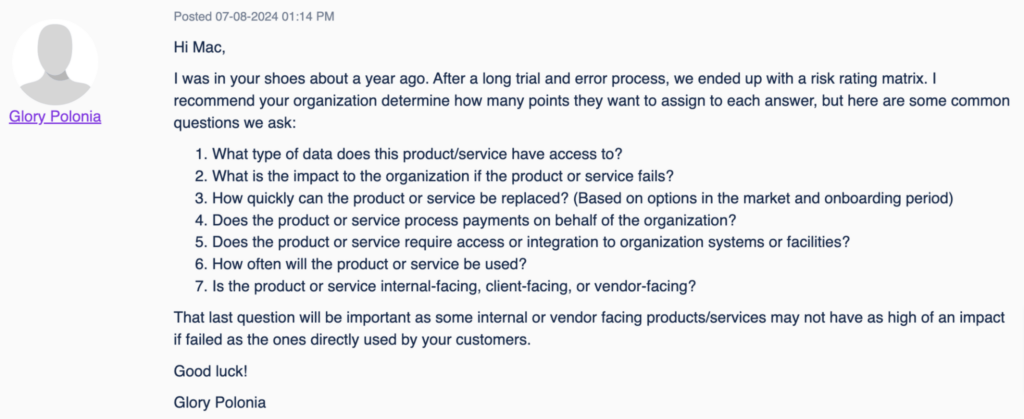
Source: Third Party ThinkTank
It’s fairly straightforward and simple to implement, yet it yields reliable results.
Once you have identified your key partners, you can move on to a deeper analysis of their relationship to your business.
Next, you’ll focus on understanding how your business depends on suppliers at a more granular level, mapping the structure of your supply chain and the interconnections through which risk can spread.
This step is vital because most supply chain risk is embedded in the network itself, not just in individual suppliers.
The 2025 cyber attack that compromised Jaguar Land Rover’s (JLR) internal systems perfectly illustrates how extensive and financially damaging supply chain disruptions can be.
This one incident halted production for five weeks and disrupted more than 5,000 firms across logistics, manufacturing, and service provision worldwide.
Ciaran Martin, Chair of CyberCX, an independent provider of cyber security services, commented:
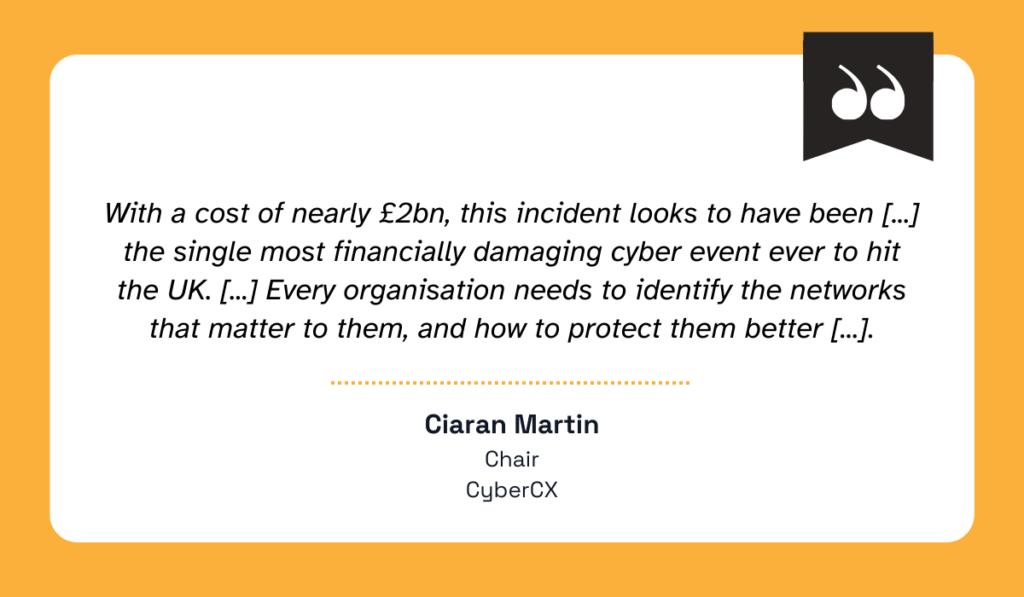
Illustration: Veridion / Quote: Procurement Magazine
To do this effectively, you need visibility beyond Tier 1 suppliers.
You need to map who the critical players are, how they impact your direct suppliers, and the supplier hierarchies and facility-level dependencies that underpin your operations.
To ensure accuracy, use a third-party supplier intelligence platform to verify your data.
These platforms typically deliver rich business profiles, even for your suppliers’ suppliers, providing information such as:
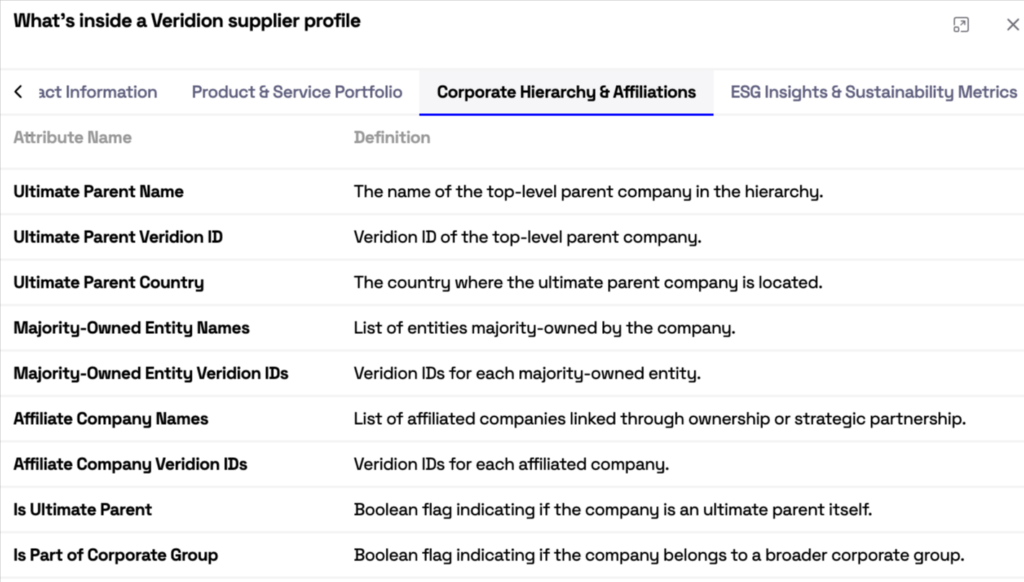
Source: Veridion
All data undergoes robust verification and is regularly updated, helping ensure a complete and reliable view of your supply chain.
Once your data is validated, you can visualize your supply chain by mapping suppliers, facilities, products, and relationships between them.
This enables you to identify concentration risks like single-facility dependencies, high revenue or volume exposure per supplier or site, and more.
All the dependencies you’ve identified now need to be translated into plausible, concrete disruption events that could realistically impact your operations and financial performance.
Each scenario should clearly specify:
| What happens | For example, a fire, flood, regulatory shutdown, labor strike, or quality issue |
| Where it happens | The specific facility, plant, and region affected |
| Duration | A short-term disruption versus a prolonged shutdown |
| Scope of impact | Which products, SKUs, or customer orders are affected |
These scenarios should cover the full range of potential disruptions.
This can include anything, from natural disasters and financial events such as bankruptcy to operational issues like labor strikes and geopolitical factors such as tariffs.
At the same time, they must stay grounded in reality.
There is no value in modeling, say, an earthquake scenario if such events are virtually nonexistent in a supplier’s region.
This is, once again, where you’ll want to leverage verified supplier intelligence.
This reliable, up-to-date data is vital, as it ensures your scenarios reflect actual operational exposure rather than your assumptions and guesswork.
For example, our AI-powered business intelligence platform, Veridion, provides profiles on more than 130 million companies across 250 countries, offering broad and deep, model-ready insights.
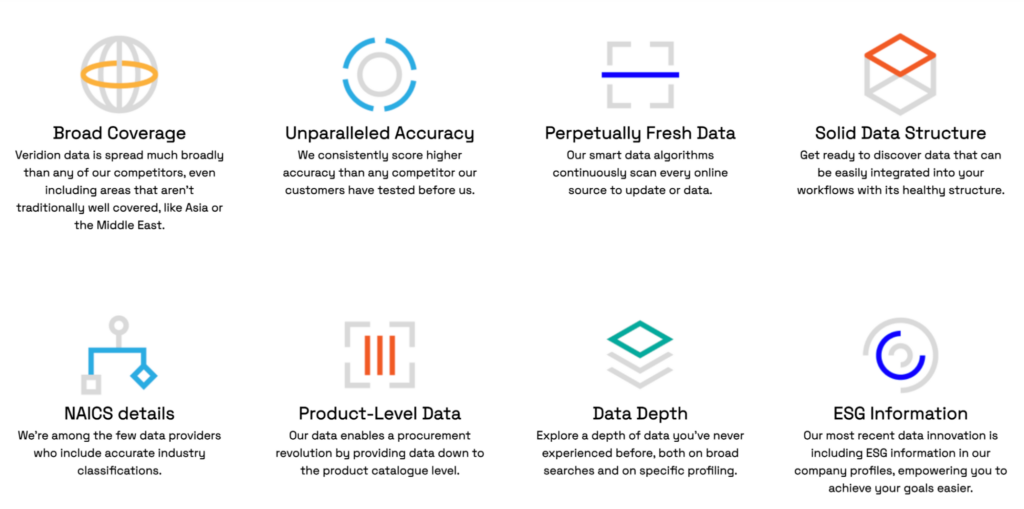
Source: Veridion
Along with core company details, contact information, and business classification, these profiles include:
This kind of visibility enables you to pinpoint where risk truly resides and build scenarios accordingly.
For instance, you can use Veridion’s location intelligence to identify exposure to political instability, sanctions, or environmental challenges.
Or, leverage our financial data to assess insolvency, bankruptcy, or liquidity risks across both direct suppliers and extended tiers of the supply chain.
In short, Veridion provides everything you need to define disruption scenarios based on what is actually happening across your supply chain today.
No guesswork. No fragmented or unreliable sources.
Just accurate, current data ready for strategic, data-driven modeling and decision-making.
“Cost buckets” are categories of potential costs and losses that a supplier disruption could trigger.
In this step, you ensure the model captures all the ways a disruption can affect your business, from immediate operational to longer-term strategic consequences.
This helps you avoid underestimating the total impact of a disruption.
Typical cost buckets include:
Direct costs are the immediate, out-of-pocket expenses incurred by a disruption.
They include things like rework, lost revenue from delayed or missed shipments, expedited shipping, or overtime and contract labor.
These costs are typically the easiest to calculate.
They represent incremental costs or lost contributions directly attributable to the disruption, measured over the disruption window and compared to a “business as usual” baseline.
Direct costs often get the most attention because they are easily visible and can be significant.
For example, the 2025 ETQ survey shows that product recall remediation costs, which also fall into this category, can range anywhere from $10 million to $49.99 million.
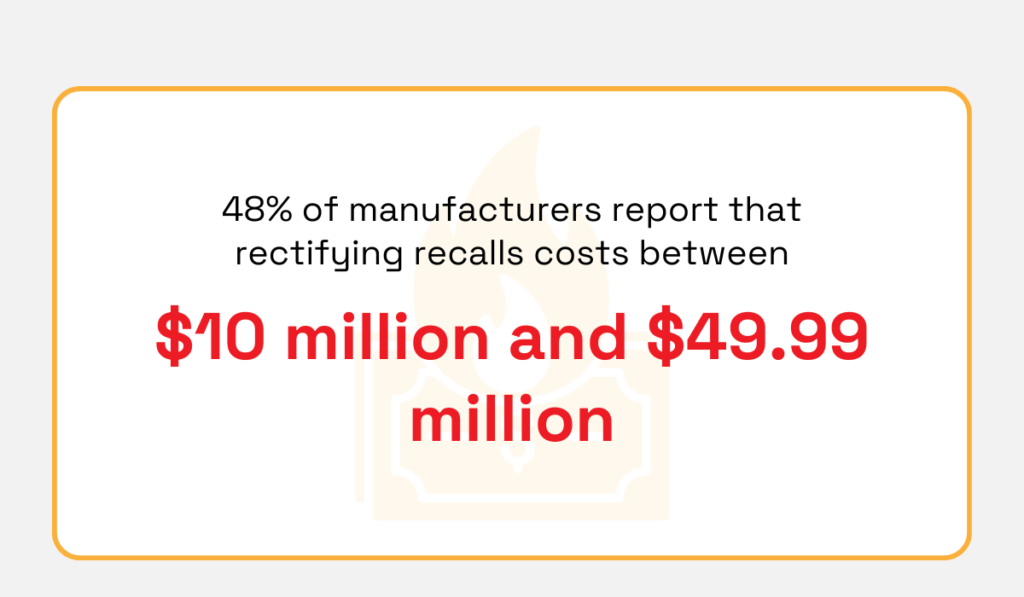
Illustration: Veridion / Data: ETQ
Indirect costs, on the other hand, are less obvious.
They include production downtime, penalties for missed procurement commitments, or operational inefficiencies caused by resource reallocation.
These costs are often estimated using proxies, such as lost productivity or increased unit costs, and are typically modeled over time rather than as a one-time expense.
Example:
A disruption forces your plant to idle for 5 days.
Fixed operating cost = $120,000/day
Indirect cost (downtime) = 5 × $120,000 = $600,000
Such costs may be less visible but can accumulate quickly and seriously damage your financial performance.
For instance, ABB research indicates that plants typically lose an average of $125,000 per hour of downtime.
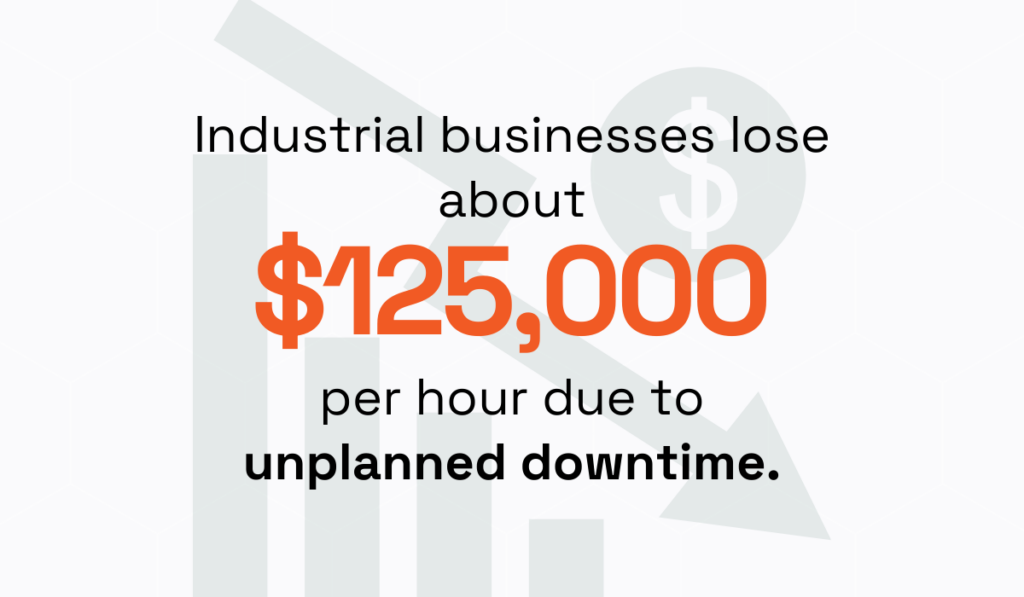
Illustration: Veridion / Data: ABB
Finally, strategic costs include reputational damage, delayed product launches, and customer churn caused by service disruptions.
These costs are best modeled as expected values or ranges, rather than precise point estimates.
Here, you’ll also need to factor in the probability of occurrence, duration of impact, and financial value of future business.
Although these are the most difficult to calculate, you still need to account for them, as over time, they can exceed both direct and indirect costs.
By now, you might be thinking: supply chains are incredibly dynamic and complex. How could I possibly account for every scenario and its financial impact?
That’s exactly where agent-based modeling (ABM) comes in.
This computational simulation method is designed to study complex systems by modeling the interactions of autonomous, individual agents, like customers, firms, or markets, within a virtual environment.
Amanda M. Y. Chu, a researcher at The Education University of Hong Kong, explains why ABM is so effective in this context:

Illustration: Veridion / Quote: SmythOS
Essentially, ABM creates autonomous digital entities, or ‘agents,’ that mirror real-world participants, with each agent operating independently according to programmed rules and behaviors.
For instance, a manufacturer might adhere to inventory rules to decide when to order materials, while a distributor agent could optimize delivery routes based on schedules.
So, unlike traditional models that assume a single, static outcome, ABM allows you to simulate dynamic interactions, cascading effects, and nonlinear behaviors, even during disruptions.
Now, if all of this sounds too complex and costly to develop, you’re not necessarily wrong.
Building these ABM models can be incredibly time-consuming and often requires advanced programming skills.
Luckily, there are now platforms that offer ABM models as a part of their services.
Learn more about how they work here:
Source: AnyLogic on YouTube
They take care of the hard part, so you can focus on analyzing results and identifying high-impact nodes or bottlenecks.
These insights can then guide your mitigation strategies and improve supply chain resilience.
Finally, it’s time to leverage your financial impact findings to design targeted mitigation strategies that reduce disruption risk in the most cost-effective way.
That’s how you stay ahead of the competition and earn your customers’ trust, says Parvez Musani, SVP of Stores and Online Pickup & Delivery Tech at Walmart Global Tech:
Illustration: Veridion / Quote: PYMNTS
An informed, data-driven mitigation strategy is key to achieving this kind of agility and resilience.
So, start by reviewing your findings and identifying the disruptions that pose the greatest threat.
To prioritize them effectively, you’ll need to assess each risk along two dimensions: likelihood, i.e., how likely the risk is to occur, and severity, or how badly this risk would affect the business.
Once assessed, plot all your scenarios in a risk matrix, like the one you see below.
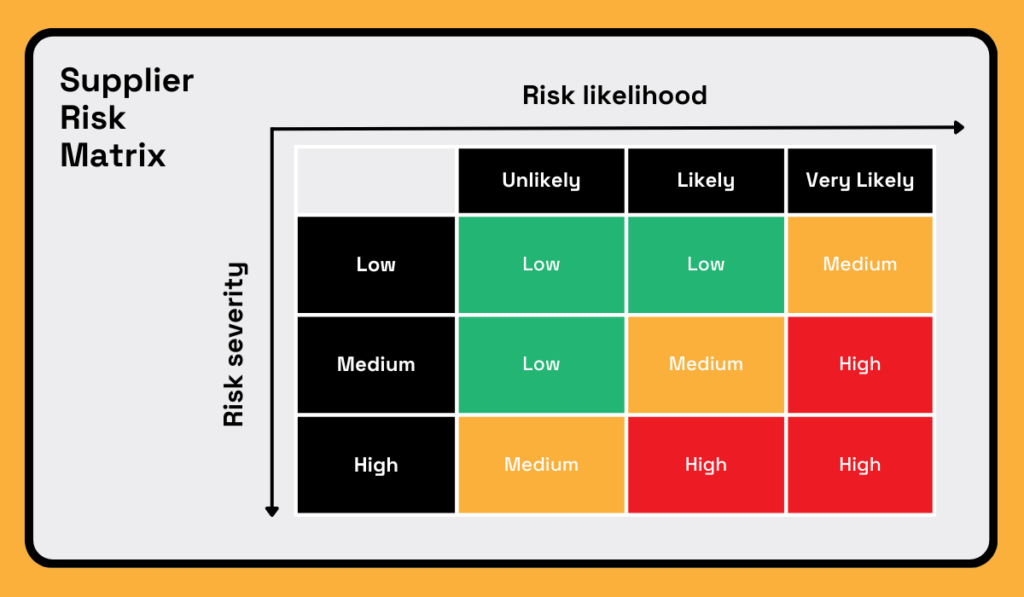
Source: Veridion
This will help you identify which areas need your immediate attention.
Just keep in mind that implementing a single tactic is rarely enough.
A layered mitigation strategy provides much stronger protection.
Jess Harris, VP and Risk Control Life Sciences & Technology Leader at Sompo, a global provider of property, casualty, and specialty insurance and reinsurance, explains why:
“The global supply chain landscape is currently evolving at a rapid rate, causing significant disruption […] To effectively address and mitigate these emerging risks, organisations must create a holistic, optimised supply chain programme […].”
In short, the more layers your strategy has, the better.
There are multiple strategy types you can combine:
| Strategy Type | What it Does | Examples |
|---|---|---|
| Avoidance | Remove the risk entirely | Don’t work with a high-risk supplier; switch to a more reliable one |
| Reduction / Control | Reduce the likelihood or impact | Quality checks, regular audits, supplier scorecards, dual sourcing |
| Transfer | Shift the risk to someone else | Insurance, contract clauses with penalties, outsourcing parts of the supply |
| Contingency / Backup | Minimize the impact if it happens | Emergency inventory, alternative suppliers, flexible logistics |
| Acceptance | Acknowledge low-level risk | Monitor minor risks that don’t justify the cost of mitigation |
Implementing regular quality checks, for instance, might not be enough on its own.
But layering additional strategies, such as contractual penalties (transfer) and maintaining backup suppliers and safety stock (contingency), will unlock much better results.
You probably noticed that data sits at the core of each of these steps.
Data about suppliers, your suppliers’ suppliers, their impact on your operations, as well as market and global supply-chain data, is vital to successfully model the financial impact of supplier facility disruptions.
That’s why the first question you should ask isn’t how to run the analysis, but whether your data is good enough to trust.
Is it accurate? Complete? Up to date?
If the answer is no, or “I don’t know”, pause and fix that first.
Audit your existing data sources, strengthen them with reliable third-party inputs, and close any gaps.
Once your data foundation is solid, the rest becomes a breeze.