14 Key Metrics for Assessing Supplier Performance


Managing supplier performance is one of the most challenging aspects of procurement.
Your suppliers directly impact your operations, and issues like late deliveries, inconsistent quality, and rising costs can disrupt workflows and hurt profitability.
To mitigate these risks, you need a reliable way to measure and evaluate supplier performance.
But with so many variables to consider, where do you start?
This article outlines 14 essential metrics every procurement professional should monitor.
From quality and delivery to cost and risk management, these metrics give a clear framework for assessing supplier performance.
Let’s jump right in.
When it comes to supplier performance, quality is non-negotiable.
Poor-quality products can lead to defects, customer dissatisfaction, and costly recalls.
To prevent these issues, here are three key metrics to monitor:
The defect rate measures the percentage of a supplier’s products or services that fail to meet quality standards.
It’s calculated by dividing the number of defective units by the total units delivered or inspected, then multiplying by 100.
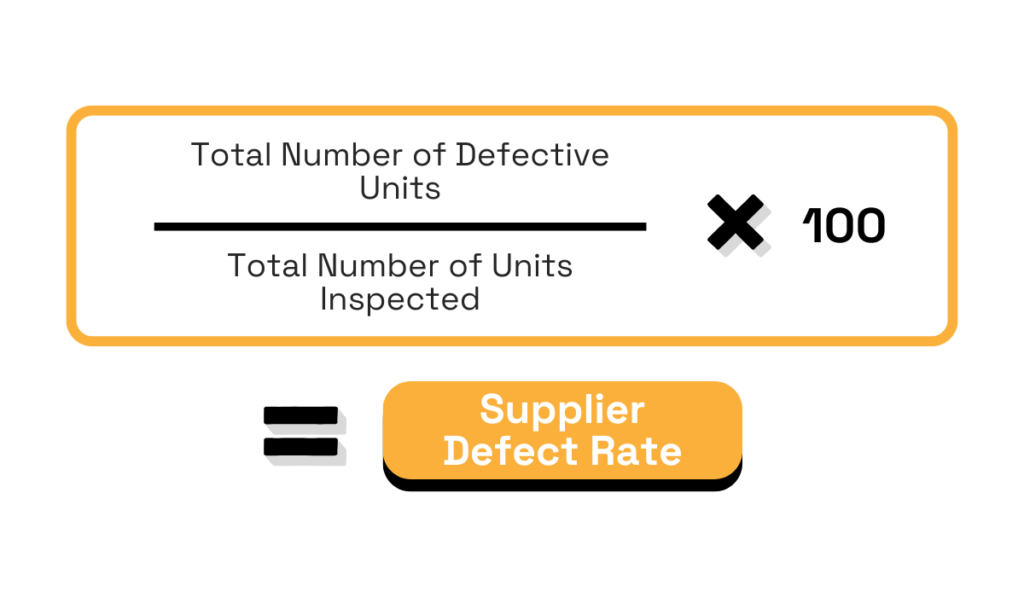
Source: Veridion
For example, if a supplier delivers 5,000 units of a part, and 200 of those are defective, the defect rate is 4%.
A low defect rate, such as below 1%, signals robust quality control and reliable production processes.
In contrast, a higher defect rate—say 15% or more—indicates systemic issues that could disrupt your operations.
This metric is particularly critical in industries like automotive manufacturing, where even minor defects can lead to recalls or safety concerns.
Toyota, for instance, famously demands near-zero defects to maintain its reputation for reliability.
Akinori Hyodo, former Factory Manager at Toyota HiAce Factory, and currently a leading Toyota Production System consultant, describes Toyota’s approach:
“When it comes to quality, it should be a matter of either zero or 100% or only black or white and no grey. What I mean by this is that there is no such thing as “acceptable poor quality” products.”
All in all, monitoring defect rates helps you evaluate the consistency of your supplier’s output and decide whether they can meet your quality requirements.
Similarly, the return rate is a key measure of product quality.
It is the percentage of products returned due to defects or other issues.
This is calculated by dividing the number of returned units by the total units delivered and multiplying by 100.
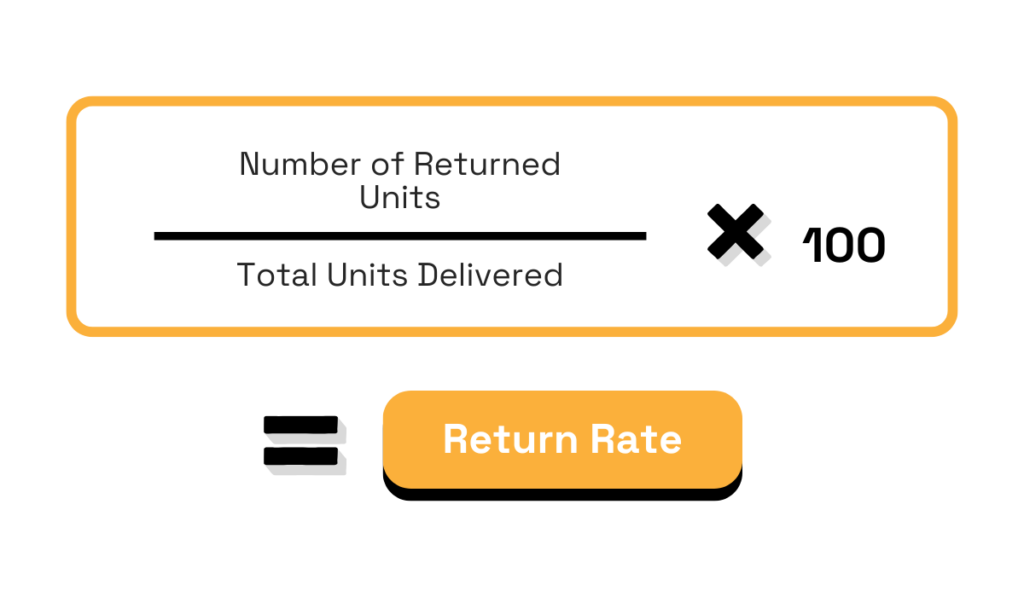
Source: Veridion
This metric also provides direct feedback on whether your supplier’s quality assurance systems align with your standards.
A low return rate, typically below 1%, indicates strong quality assurance processes and also leads to higher customer satisfaction.
On the other hand, high return rates can damage your bottom line, as they not only represent wasted resources but also strain customer relationships.
So, if return rates exceed acceptable thresholds, collaborate with your supplier to identify the root cause, such as inadequate raw materials or insufficient quality checks.
This important quality metric measures how often a supplier meets agreed-upon requirements for materials, product dimensions, or performance.
While not always expressed as a formula, compliance with specifications can be tracked during quality inspections and audits.
A supplier consistently failing to meet specifications might disrupt production schedules or lead to subpar end products.
This happened with the infamous Samsung Galaxy Note 7.
Batteries from two suppliers failed to meet critical specifications—one had design flaws leading to short-circuiting, while the other had missing insulation and sharp protrusions causing safety risks.
These failures led to fires and a global recall that cost Samsung billions of dollars.

Source: LA Times
On the other hand, suppliers with high compliance rates signal reliability and strong manufacturing capabilities, making them valuable partners.
Timely and accurate deliveries are essential to maintaining smooth operations in any supply chain.
Delivery performance metrics help you assess how well your suppliers can meet these expectations.
Among the most critical indicators are order accuracy, lead time, and on-time delivery.
Order accuracy measures the percentage of orders a supplier fulfills correctly, including the right products, quantities, and specifications.
This is calculated by dividing the number of accurate orders by the total number of orders, and then multiplying by 100.
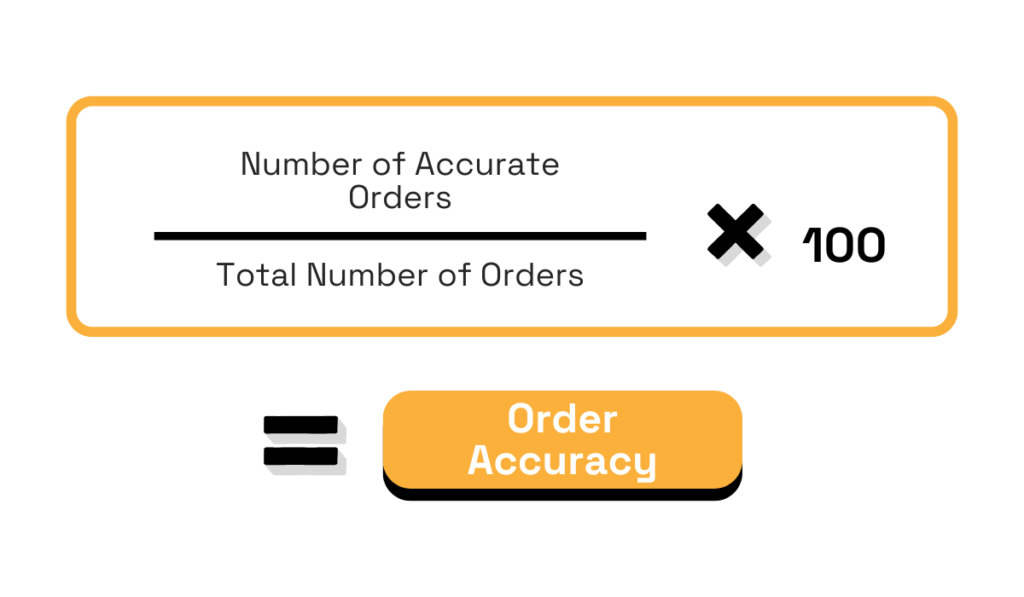
Source: Veridion
High order accuracy minimizes disruptions in your operations, as you can depend on suppliers to deliver exactly what you need.
Conversely, a low order accuracy rate could signal issues like poor inventory management or even miscommunication.
For instance, in the retail sector, companies like Walmart demand exceptionally high order accuracy (as well as on-time and in-full shipments) from suppliers to avoid stockouts or overstocking, both of which can affect profitability.

Source: Redwood
By monitoring this metric, you can identify suppliers who consistently deliver what they promise and ensure your inventory remains balanced and efficient.
Lead time evaluates the time it takes for a supplier to deliver goods after receiving an order.
It’s calculated as the number of days from order placement to delivery.
For example, if a supplier takes 15 days to fulfill an order, their lead time is 15 days.
Shorter lead times are generally preferable because they allow you to respond quickly to market changes and reduce the need for excessive inventory.
However, lead time is interconnected with other factors, including your own purchase order cycle time—the time it takes your team to process and send a purchase order to the supplier.
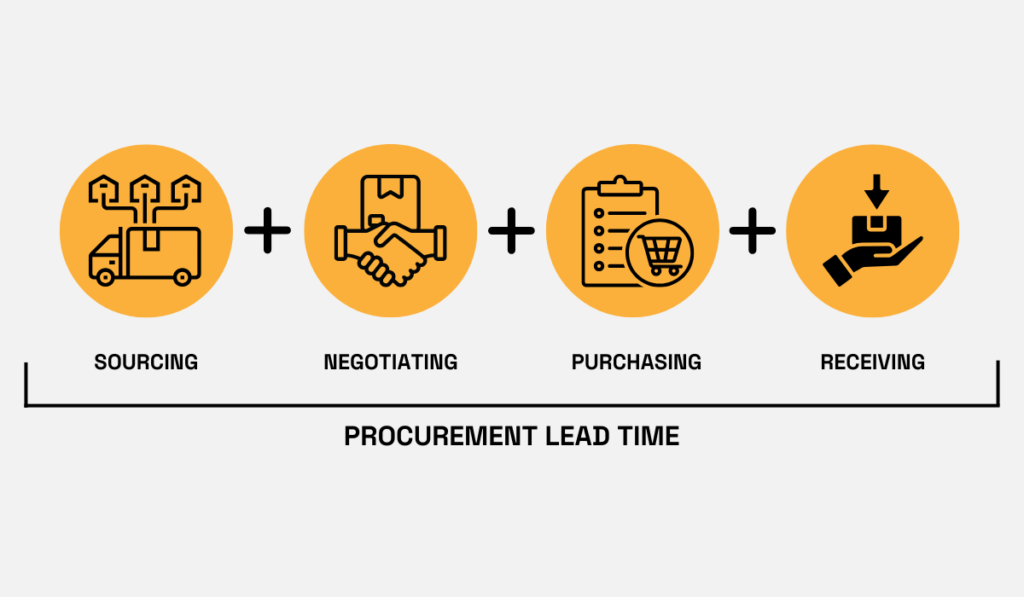
Source: Veridion
Monitoring both helps you pinpoint whether delays originate internally or with the supplier.
Industries like fashion and tech thrive on short lead times to stay ahead of trends and meet tight product launch schedules, making this metric also important for understanding supply chain agility.
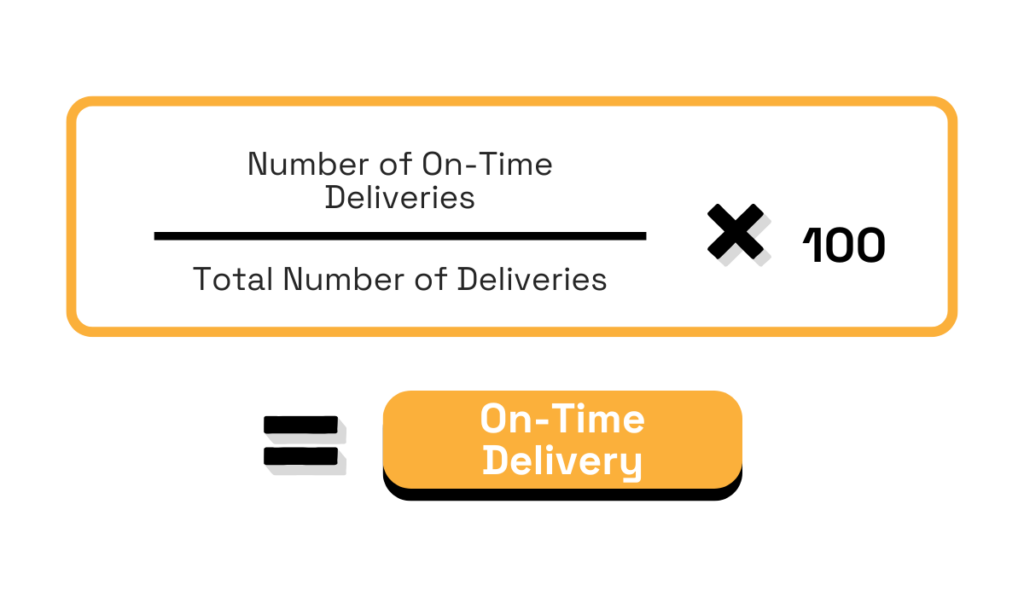
On-time delivery reflects how consistently a supplier meets agreed-upon deadlines.
It’s calculated by dividing the number of on-time deliveries by the total number of deliveries and multiplying by 100.
Source: Veridion
Why should you measure it?
Well, because this metric highlights a supplier’s reliability, which directly affects your ability to meet production schedules and customer commitments.
Imagine working with a supplier who has a low on-time delivery rate—perhaps 70%.
Every missed deadline could disrupt your operations, leading to downtime or dissatisfied customers.
In a nutshell, tracking on-time delivery helps you differentiate between suppliers who can be trusted to meet deadlines and those who risk compromising your performance.
Do you want to know how adaptable and responsive your suppliers are?
Or whether they share the same sustainability values as you?
Then, you should measure the following metrics:
Supplier responsiveness measures how promptly and effectively a supplier reacts to inquiries, order changes, or unexpected issues.
For example, imagine a production line comes to a halt because a key component is out of stock.
A responsive supplier who quickly reallocates resources to help you out or expedites shipping can prevent significant downtime.
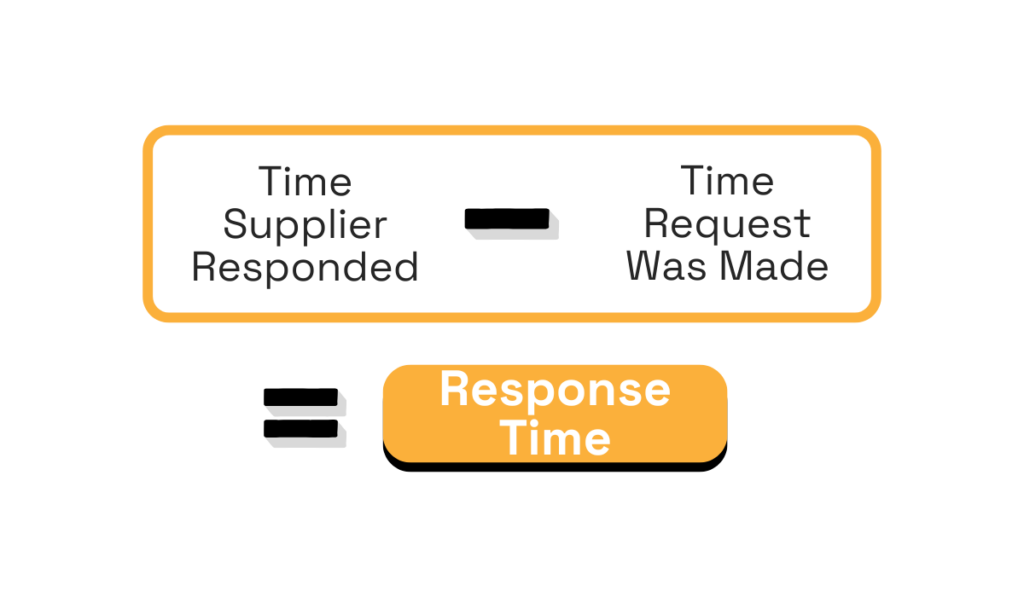
To measure responsiveness, you can track the response time, which is the time taken from the moment you make a request to when the supplier acknowledges and acts on it.
A formula to calculate response time could look like this:
Source: Veridion
All in all, responsiveness is crucial for maintaining business continuity and mitigating risks, so make sure to track this metric.
This metric focuses on how well a supplier can adjust to changes in demand, specifications, or external conditions.
For instance, during the early months of the COVID-19 pandemic, many manufacturers faced sudden spikes in demand for essential goods like medical supplies.
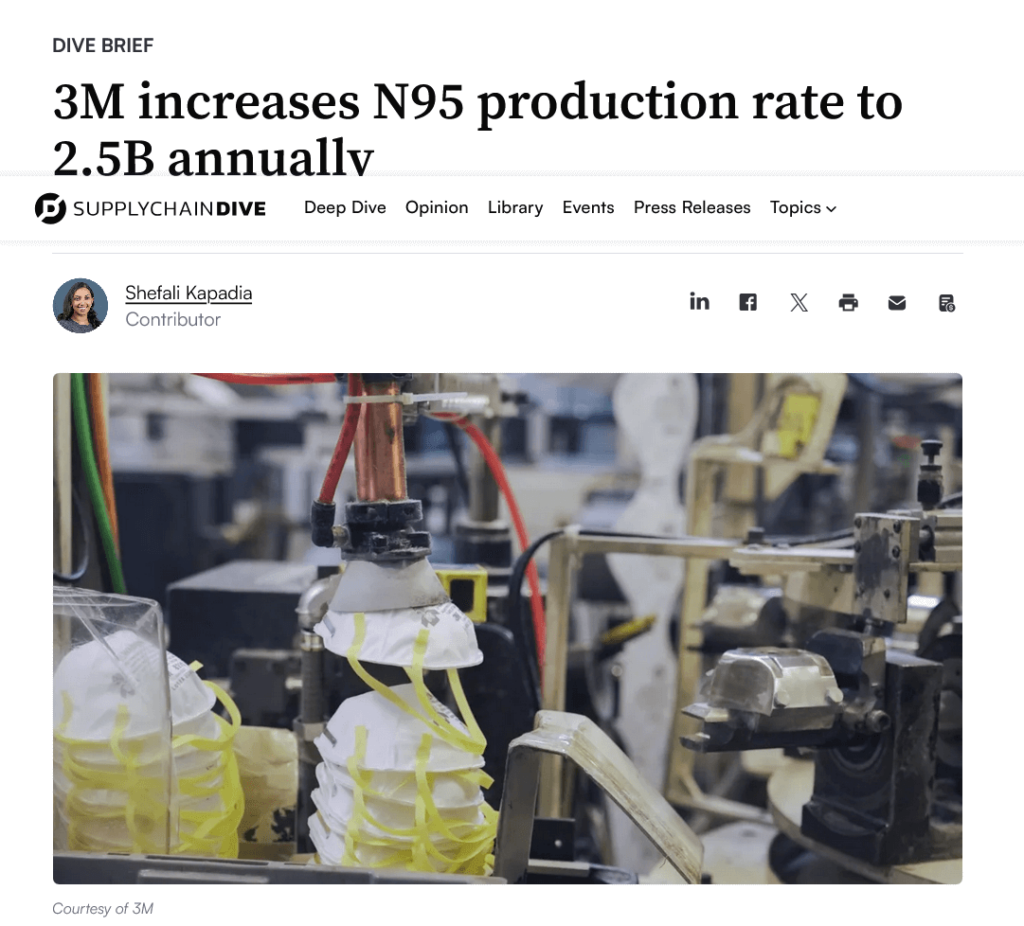
During the pandemic, companies like 3M quickly adapted production to meet rising demands for PPE, highlighting the value of adaptable suppliers.
Source: Supply Chain Dive
Suppliers who could reconfigure their production lines or increase output quickly proved invaluable.
So, to measure adaptability, you could track metrics such as:
Adaptability isn’t just about crisis response but also speaks to a supplier’s willingness to innovate and evolve.
Which brings us to the next metric.
Contribution to innovation measures how much value a supplier adds through new ideas, technologies, or processes, to improve your products or services.
Here are some ways your company can assess this metric:
A great example of a company that prioritizes supplier innovation is Procter & Gamble.
Their “Connect + Develop” program actively rewards suppliers who contribute innovative solutions.

Source: P&G
Suppliers are encouraged to collaborate on cutting-edge technologies, which has led to breakthroughs in product formulations and packaging.
By fostering supplier innovation, P&G has maintained its position as a leader in consumer goods while building stronger partnerships with its most forward-thinking suppliers.
None of this would be possible without consistently tracking and measuring which suppliers contribute most to innovation.
It’s hard to have a discussion about procurement or supply chains today without mentioning sustainability—and for good reason.
Sustainability is becoming critical as companies face growing pressure from customers, governments, and stakeholders to adopt environmentally friendly and socially responsible practices.
For instance, regulatory frameworks like the EU’s Corporate Sustainability Reporting Directive make it increasingly difficult for companies to ignore supplier sustainability.

Source: Google
If you want to partner with suppliers who share your sustainability values—and comply with regulations—you should evaluate supplier sustainability.
This can be done by measuring how well they implement environmentally and socially responsible practices.
Here are some metrics you can use:
Despite sustainability’s growing importance, these metrics are still often overlooked in procurement.
If you’re curious about other KPIs that are frequently neglected but shouldn’t be, check out our article on the topic.
If you want to know that you’re getting value for money from your suppliers, you have to consider cost-related metrics for assessing supplier performance.
The metrics from this category will help ensure that the costs you’re incurring align with expectations and that you’re making the best financial decisions in your supply chain.
Here are the two metrics that you should pay attention to:
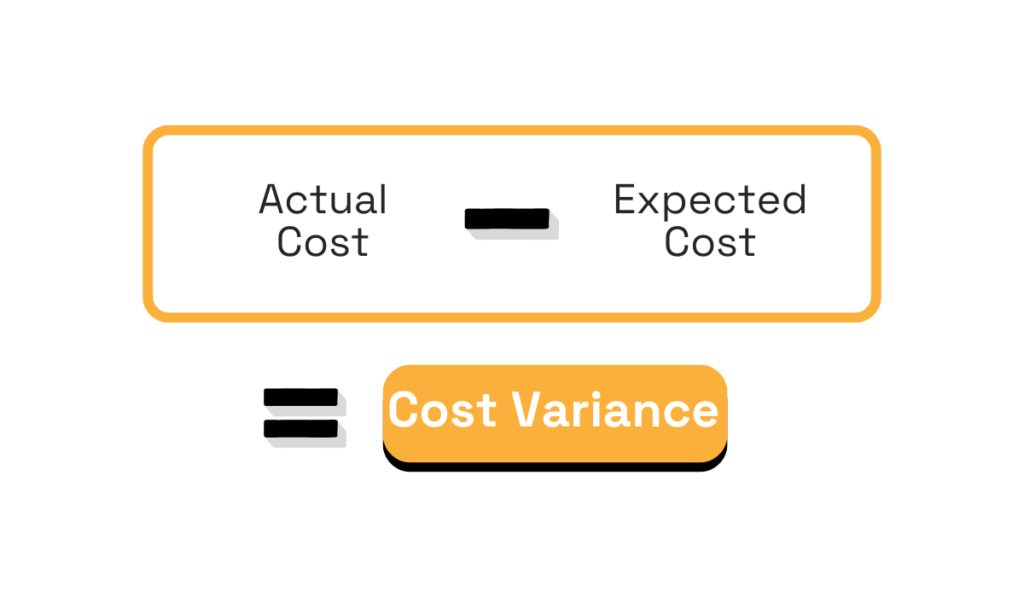
Cost variance measures the difference between the expected cost and the actual cost of goods or services.
Source: Veridion
It’s a simple but powerful way to see how well a supplier is managing costs.
If the actual costs are consistently higher than expected—it can create real issues for your budget and profitability.
There are plenty of reasons for cost variance, including:
If you see a negative variance (where costs go over budget), it might mean the supplier is struggling with planning, dealing with waste, or not adapting well to unexpected changes.
Why does this matter?
First, frequent cost overruns can mess up your financial plans and even put your projects at risk.
Second, tracking this metric helps you hold suppliers accountable.
It’s a clear, objective way to check if they’re staying on track or if you need to step in, renegotiate, or even consider other options.
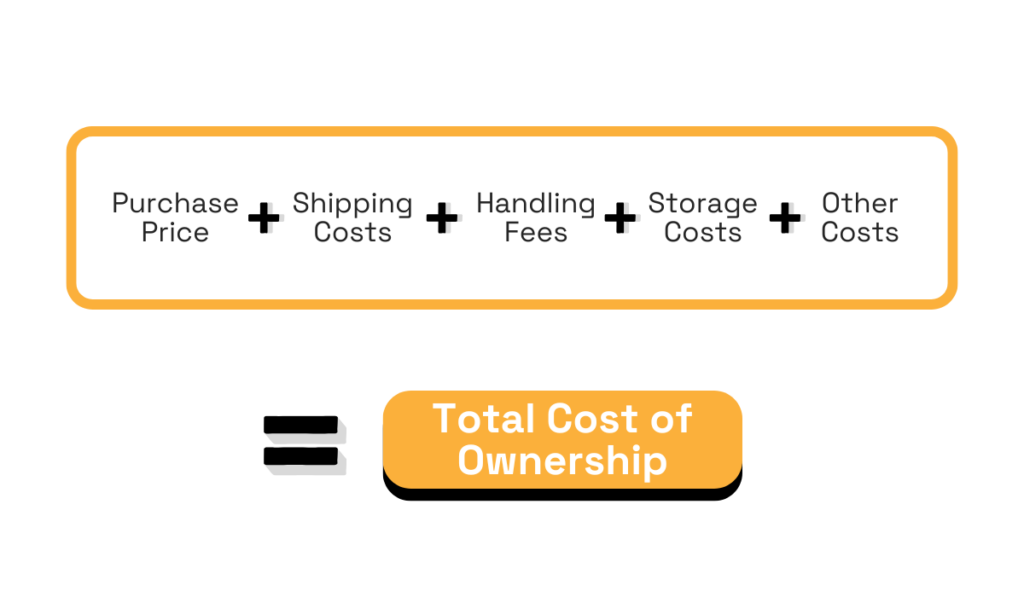
Total cost of ownership (TCO) goes beyond the initial purchase price and evaluates the full cost of working with a supplier, including direct and indirect costs.
It encompasses factors such as shipping, handling, storage, and any additional costs associated with the lifecycle of the product or service.
Source: Veridion
This helps you better understand the true cost of a supplier, beyond just the unit price.
For example, a supplier with a higher unit price but lower shipping costs and faster delivery may be more cost-effective in the long run.
By considering TCO, you can identify opportunities to optimize supplier choices and reduce overall costs.
Moving on to risk metrics, these are crucial for understanding potential threats in your supply chain.
After all, your supplier’s stability and ability to handle disruptions directly impact your operations.
If you ignore risk, even a single failure can ripple through your business, costing time, money, and reputation.
To effectively manage these risks, it’s essential to conduct a supplier risk assessment, which evaluates your suppliers’ potential vulnerabilities.
Here’s a closer look at two key metrics that help you assess supplier risks:
This metric gives you an overall view of how risky a supplier is.
It considers everything from their financial health and performance history to external factors like geopolitical stability.
While there is no fixed formula for a supplier risk score (since it may involve a range of risk factors), the score is typically calculated using a weighted formula based on various risk parameters such as:
Companies may use internal or third-party frameworks to calculate this score, often on a scale from 1 (low risk) to 10 (high risk).
This score helps you prioritize suppliers and figure out where to focus your risk mitigation efforts.
For example, a high-risk supplier might prompt you to have backup options in place or invest more in monitoring their performance.
Source: Veridion
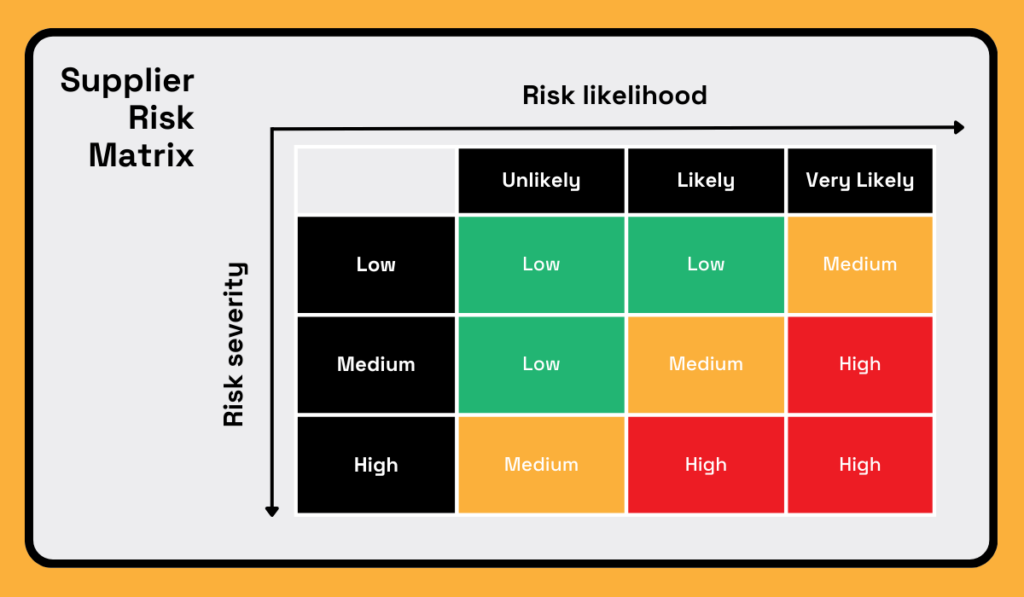
Tools like supplier scorecards, the Kraljic Matrix, and other risk matrices, which you can see above, are useful for visualizing these risks and deciding how critical a supplier is to your operations.
And when it comes to monitoring supplier risks in real time, that’s where our big data platform, Veridion, can assist you.
Source: Veridion
With access to comprehensive data on over 120 million suppliers—including financial, ESG, regional, and product risk data—Veridion helps you define more accurate supplier risk scores, and manage your supplier risk better.
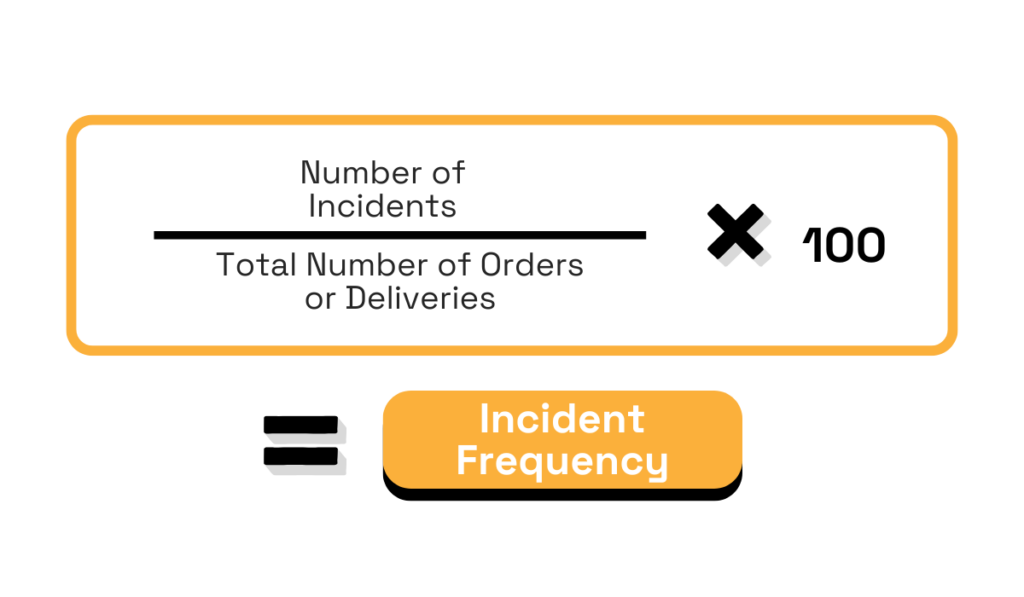
Incident frequency tracks how often incidents like quality failures, delays, or compliance issues occur.
It is calculated by dividing the number of incidents by the total number of orders or deliveries, then multiplying by 100 to get a percentage.
Source: Veridion
If a supplier has a high incident frequency, it’s a red flag.
It could point to deeper issues like poor quality control, capacity problems, or disorganized processes.
Why does this matter?
If a supplier frequently causes problems, it doesn’t just hurt your operations but also erodes trust and adds unnecessary costs.
By keeping a close eye on this metric, you can work with your supplier to identify the root causes and improve their performance, ultimately reducing risks in your supply chain.
An incident frequency metric can also be a basis for implementing contractual penalties or diversifying your supplier base to mitigate the risk of ongoing disruptions.
As you can see, assessing supplier performance involves tracking a wide range of metrics, each offering valuable insights.
Focusing solely on cost metrics while neglecting supplier reliability, defect rates, or risks can lead to missed opportunities or costly mistakes.
That’s why it’s important to include a comprehensive set of metrics in your supplier performance assessment.
Now that you’re familiar with these 14 key metrics, we hope you’ll use them to gain a more complete view of your suppliers and drive better decisions for your business.
Best of luck!