Insights / Articles
Essential KPIs for Measuring Procurement Performance
In this article, we are providing you with a deep dive into the essential KPIs that will help you measure your procurement performance in 3 categories: cost management, supplier management, and process efficiency.

In many companies, the procurement department serves as the lifeblood, ensuring goods and services are procured on time, at the right price, and in the correct quantity, enabling the rest of the company’s operations to proceed smoothly.
However, achieving this relies on efficient procurement processes, adept cost management, and reliable suppliers who consistently deliver on time and with the right quantity and quality.
To gauge where your procurement stands in these crucial areas, it’s essential that you regularly measure procurement performance across these three dimensions: cost management, supplier performance, and process efficiency.
Today, we will outline all the essential key performance indicators that you must diligently keep track of within these three categories.
Let’s dive in.
Cost Management KPIs
How a procurement department manages costs directly impacts an organization’s financial health and performance.
So, it’s in everyone’s interest that you do it effectively.
But for that, it’s essential first to monitor the right cost management KPIs and then take action according to the results.
By doing so, you can drive cost savings, mitigate financial risks, and ensure a stable bottom line.
Keep reading to learn what KPIs we have in mind and how to measure them.
Cost Savings
Cost savings is a critical cost management KPI.
It helps you understand how well your procurement strategies and practices are helping your organization save money.
Essentially, this metric represents the difference between what you paid for goods or services and what you would have paid without your procurement efforts.
For example, if you negotiated a better price with a supplier than initially quoted, the difference between the quoted and negotiated prices would be your cost savings.
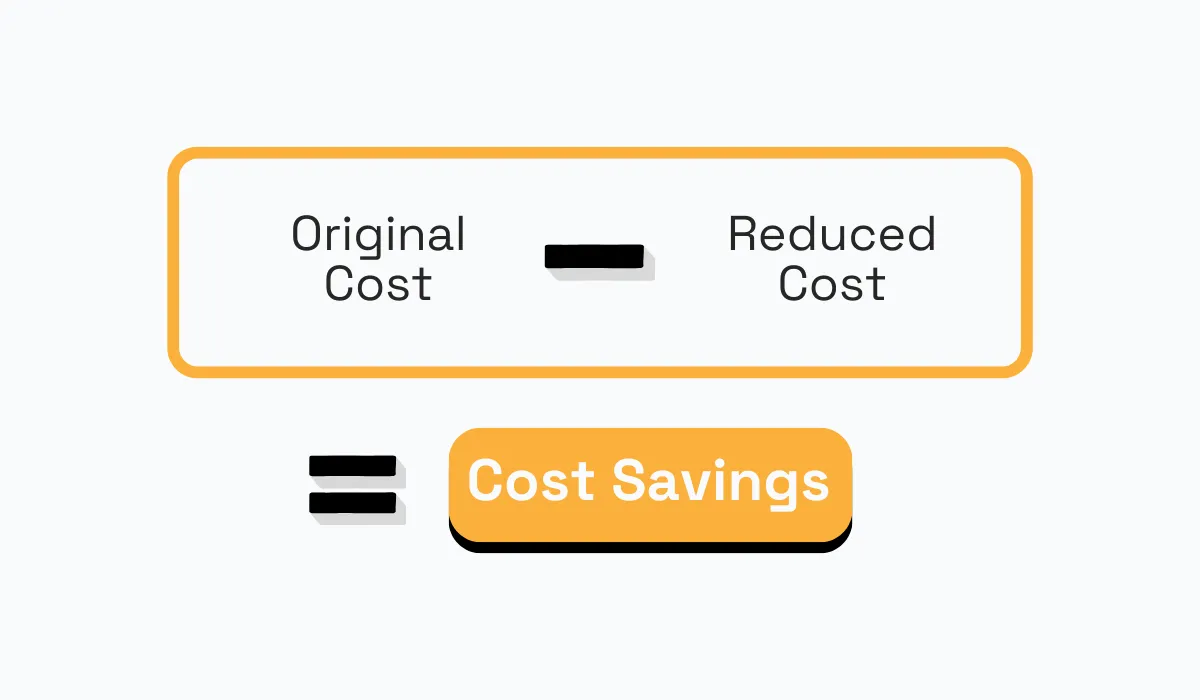
Source: Veridion
Cost savings are also called hard savings because they are immediately visible in financial statements.
Now, measuring them can be just a bit more complicated than the formula above, but it depends on the type of cost savings and the methodology you use.
To learn more about measuring different types of cost savings, take a look at our article dedicated to this topic.
All in all, measuring cost savings is an essential cost management KPI.
This metric will show you how well your cost-saving strategies are performing in achieving hard cost savings, or, in other words, how much more revenue is turning into your profit.
Cost Avoidance
Cost avoidance is another crucial metric that procurement departments should use to assess their effectiveness in mitigating potential costs—and risks.
Unlike cost savings, which measure actual reductions in expenses, cost avoidance focuses on preventing potential costs from materializing.
You measure cost avoidance to evaluate how well your procurement strategies and practices are helping your organization avoid unnecessary expenditures.
These strategies may involve entering into long-term contracts to shield the business from future price fluctuations or negotiating value-added services such as extended warranties, complimentary maintenance checks, or real-time shipment tracking.
Each of these approaches serves to mitigate risks and prevent future costs.
Although quantifying cost avoidance is challenging, you can gain insight into the costs you have avoided by comparing hypothetical costs without implementing these strategies with your actual costs.
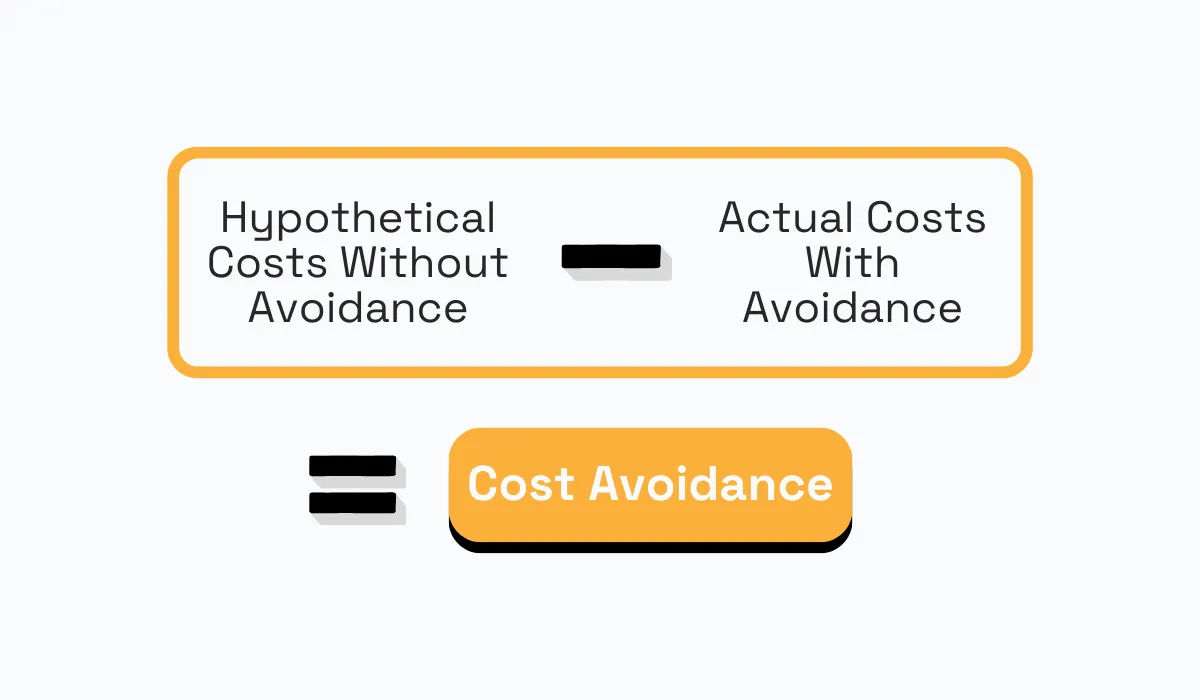
Source: Veridion
In a nutshell—cost avoidance is an essential KPI for the procurement department.
Although higher management sometimes doesn’t pay much attention to this KPI (because it’s not immediately apparent in financial reports), prioritizing cost avoidance together with cost savings will protect your organization’s financial health in the long run.
Procurement ROI
Procurement ROI, or return on investment, is a key performance indicator that measures the financial return generated by your procurement activities.
Procurement ROI is typically expressed as a percentage and is calculated using the following formula:
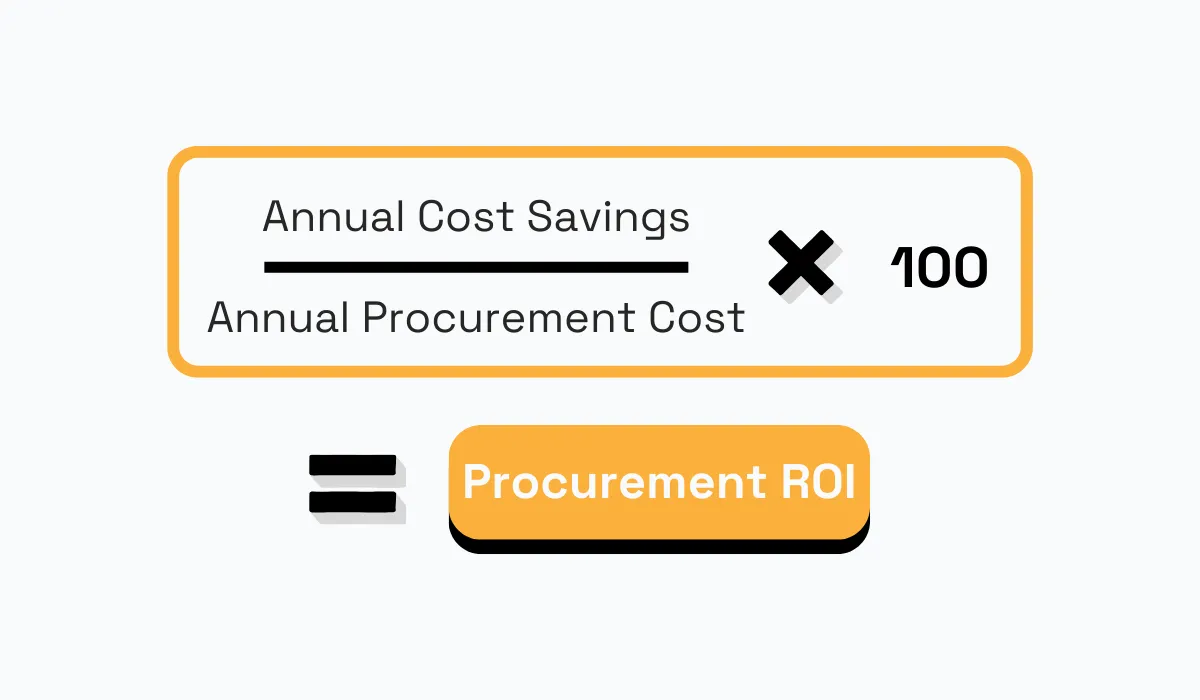
Source: Veridion
This KPI helps you understand whether the benefits derived from your procurement efforts outweigh the costs incurred and, as such, helps with internal department analysis.
By leveraging procurement ROI, you can then make informed decisions regarding resource allocation and process enhancement within your procurement department.
Total Cost of Ownership
Total Cost of Ownership (TCO) is a comprehensive cost assessment that considers all costs associated with procured goods or services over their entire life cycle.
It goes beyond just the purchase price and includes additional costs such as delivery costs, maintenance, operating costs, process change costs, and disposal expenses.
The formula for calculating TCO typically involves summing up all direct and indirect costs of a product or service over its entire lifecycle.
Total Cost of Ownership (TCO)=Purchase Price+Delivery Costs+Maintenance Costs+Operating Costs+Process Change Costs+Disposal Expenses
Measuring TCO is essential for gaining a more accurate understanding of the true cost of procured items and making more informed procurement decisions about procuring goods and services.
For example, you can compare multiple sourcing options to evaluate which ones would bring you more long-term value.
Finally, every efficient procurement department aims to minimize the TCO of procured goods or services by selecting high-quality, cost-effective solutions that reduce lifecycle costs.
Spend Under Management
Spend under management is a critical metric that measures the percentage or proportion of your procurement spend actively managed or controlled by the management department.
This includes total approved spend, such as direct, indirect, and service-related costs, minus any maverick spend—unauthorized purchases made outside established procurement processes or policies.

Source: Veridion
When spend under management is high, you can exert greater control and oversight over purchasing activities.
This allows you to negotiate better terms with suppliers, consolidate purchasing volumes, and implement standardized processes to streamline operations and reduce costs.
In essence, maximizing spend under management enables you to maximize cost savings, minimize risks, and drive strategic sourcing decisions.
As such, efficient procurement departments often aim to achieve a high percentage of spend under management, with targets reaching up to 80%.
Supplier Management KPIs
Supplier management is a crucial aspect of procurement that influences the quality, reliability, and efficiency of your supply chain.
Understanding and monitoring supplier management KPIs can, therefore, help you oversee your suppliers and ultimately optimize supplier relationships, ensure timely deliveries, maintain product quality, and minimize supplier-related risks.
Let’s see which KPIs can assist you on your supplier management journey.
Supplier Availability
Supplier availability measures the frequency with which items are available from a particular vendor compared to the total number of orders placed with that vendor.
You measure it to assess the reliability and consistency of your suppliers in fulfilling orders and meeting your demand, and especially their ability to respond to emergency demands.
The formula to calculate it goes as follows:

Source: Veridion
For example, if you place ten orders with a supplier and they have the items available for eight of those orders, the supplier availability KPI would be 80%.
By tracking supplier availability, you can identify suppliers that consistently meet your demand and those that may struggle to maintain adequate inventory levels.
This allows you to make informed decisions about supplier selection to minimize disruptions in your supply chain.
Supplier Compliance Rate
Supplier compliance rate measures the degree to which suppliers adhere to your organization’s purchasing policies, procedures, and contractual agreements.
These include on-time delivery, adherence to exclusive discount offers, prompt resolution of delays or issues, adherence to legal requirements, compliance with ethical standards, and more.
Simply put, you measure how your suppliers adhere to everything that is written in your contracts.
To calculate compliance rate, you must keep track of various metrics, including:
- the ratio of disputed invoices to total invoices,
- the total difference between paid and quoted prices,
- and other relevant factors based on your organization’s specific requirements and expectations from suppliers.
By monitoring supplier compliance rate, you can address non-compliance issues on time, negotiate better terms with suppliers, and strengthen supplier relationships, thereby enhancing overall procurement efficiency and effectiveness.
Supplier Quality
Supplier quality measures the overall quality and reliability of products or services delivered by your suppliers.
This KPI can help you ensure that the products or services received from suppliers meet your organization’s standards and requirements.
While there isn’t a specific formula for calculating supplier quality, you can develop scorecards that evaluate suppliers based on various quality metrics such as:
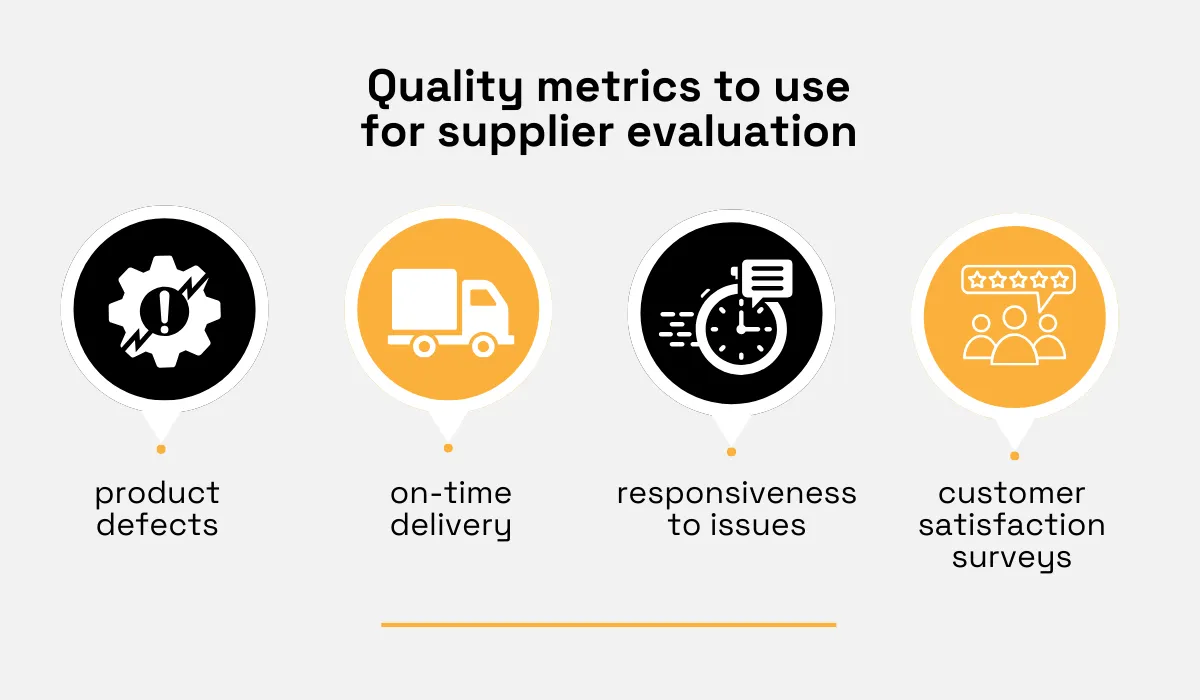
Source: Veridion
Based on these scorecards, you can identify high-performing suppliers that consistently deliver high-quality products and prioritize them in your supplier selection process.
Conversely, suppliers with poor quality performance will require closer monitoring, improvement initiatives, or even replacement.
The bottom line is that this metric will help you maintain product integrity, minimize defects, and enhance customer satisfaction.
All by pinpointing which suppliers deliver quality products and services.
Supplier Defect Rate
Supplier quality is further measured through one more specific KPI—supplier detect rate.
This rate is the percentage of substandard products or units received from a supplier compared to the total number of units inspected.
Supplier defect rate is critical for evaluating the individual quality performance of suppliers and identifying potential quality issues in the supply chain.
The formula for calculating the supplier defect rate is straightforward:
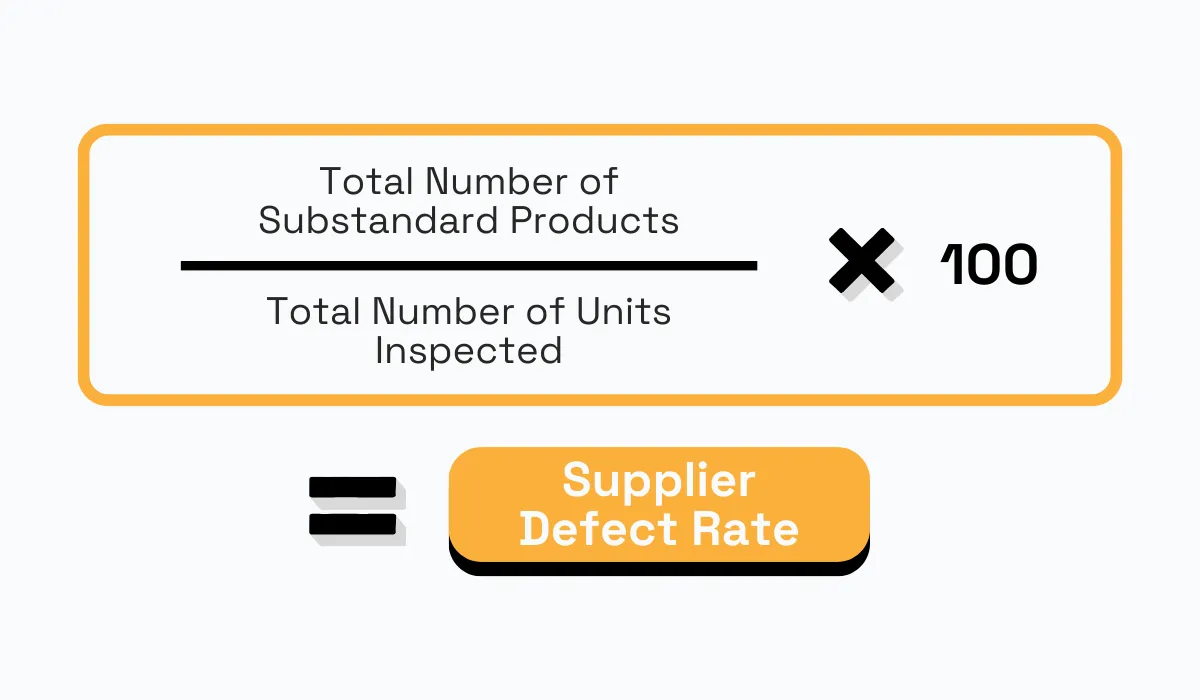
Source: Veridion
Constantly tracking different suppliers’ defect rates and breaking them down into different categories of defect types provides valuable insights into supplier performance and product quality.
This information allows you to take corrective actions, such as implementing quality improvement initiatives or sourcing from alternative suppliers, to address quality issues effectively.
All in all, measuring procurement through supplier management KPIs is essential if you want to procure quality products and services on time and in the right quantity while minimizing risks and enhancing customer satisfaction.
Process Efficiency KPIs
Last, but certainly not least, are the key performance indicators that gauge the efficiency of your procurement process.
As a procurement professional, you understand the critical importance of efficient procurement processes in optimizing resource utilization, cutting costs, and improving operational performance.
But how can you determine if your processes are truly efficient? By evaluating them using the following five KPIs.
Let’s delve into each one.
Procurement Cycle Time
Procurement cycle time measures the duration from the initial identification of the need for goods and services and the raising of purchase requisitions, through sourcing suppliers and negotiating contracts, to delivery and final payment processes.
Source: Veridion
There are several key metrics to track to understand the entire process’s duration, including:
- requisition processing time,
- purchase order cycle time,
- lead time,
- invoice processing time, and more.
Monitoring procurement cycle time will help you identify bottlenecks more quickly, allowing for the streamlining of workflows and overall process efficiency improvement.
If you are wondering how to reduce procurement cycle time, consider implementing procurement automation tools to streamline tasks such as raising purchase requisitions, creating purchase orders, and processing invoices.
Additionally, sourcing enablers like Veridion can significantly reduce supplier discovery and sourcing time, leading to shorter procurement cycles.
The latter is necessary if you want to respond faster to market dynamics and gain competitive advantages in today’s fast-paced business environment.
Vendor Rejection Rate
Vendor rejection rate is a key metric for assessing procurement efficiency, particularly in supplier sourcing and quality control.
It measures the percentage of products or services received from a supplier that are rejected due to quality issues.

Source: Veridion
A high vendor rejection rate may suggest that you are facing challenges in supplier sourcing, such as inadequate supplier evaluation processes or insufficient market research.
For example, a high vendor rejection rate can indicate that you struggle to identify and select reliable suppliers who consistently meet quality standards and contractual obligations.
Now, the reasons for this could be several:
- limited supplier visibility,
- incomplete supplier assessments,
- or a lack of clear criteria for supplier qualification.
This can then have several implications for the organization, including increased costs, delays in procurement processes, and potential disruptions to supply chain operations.
However, by monitoring this metric, you can identify areas for improvement in supplier sourcing, evaluation, and quality control, ultimately optimizing procurement processes for greater efficiency and performance.
Emergency Purchase Ratio
This KPI sheds light on unplanned purchases.
The emergency purchase ratio represents the percentage of purchases made by the procurement department under emergency circumstances compared to the total purchases within a specific period.

Source: Veridion
Sometimes, ad hoc purchases indeed happen in procurement, but when they are too frequent, this indicates inadequate planning and inventory shortages.
Such purchases typically also come with higher costs and increased risks.
However, when you monitor the emergency purchase ratio, you can identify the root causes of emergency purchases, implement preventive measures, and optimize inventory management practices.
Ultimately, reducing emergency purchases leads to minimized costs, improved resource allocation, and enhanced procurement efficiency.
Purchase Order Accuracy
Purchase order accuracy refers to the precision and correctness of the information contained in your purchase orders sent to suppliers.
For instance, accurate purchase orders ensure you request the correct products or services, in the appropriate quantities, and at the agreed-upon prices.
When your purchase orders are accurate, suppliers receive clear and precise instructions, enabling them to fulfill your orders promptly and precisely.
Conversely, when purchase order accuracy is low, it can lead to various challenges, such as receiving incorrect items or quantities.
This can adversely affect your procurement processes, resulting in:
- delays in procurement processes,
- additional expenses for returning or replacing incorrect items,
- strained relationships with suppliers,
- and disruptions in operations and failure to meet customer demands on time.
To mitigate these risks and ensure efficient procurement operations, it’s crucial to prioritize improving purchase order accuracy.
One effective strategy to achieve high purchase order accuracy is leveraging procurement automation tools.
These tools streamline the purchase order creation process by automating data entry, validation, and approval workflows, minimizing errors common with manual entry.
Additionally, procurement systems provide real-time tracking and monitoring of purchase orders, facilitating prompt identification and resolution of discrepancies or issues.
Inventory Turnover Ratio
The last key performance indicator we will mention today is a metric that can help you manage your inventory more efficiently.
The inventory turnover ratio measures how you manage inventory by indicating how many times inventory is sold or consumed within a specific period, typically a year.
To calculate this metric, divide the cost of goods sold (COGS) by the average inventory level:

Source: Veridion
If your inventory turnover ratio is high, your inventory is sold more rapidly, indicating efficient inventory management.
On the other hand, this KPI also helps you identify slow-moving or obsolete inventory and refine demand forecasting and inventory planning processes.
All in all, if you strive for a higher inventory turnover ratio, you can reduce carrying costs, optimize cash flow, and enhance your overall operational efficiency.
Conclusion
And with that, we wrap up our discussion.
Today, we’ve delved into fourteen key performance indicators essential for assessing your procurement performance across three core areas: cost management, supplier management, and process efficiency.
While keeping tabs on all these KPIs might appear overwhelming, the insights they offer are invaluable.
Consistently monitoring these indicators provides valuable data on your procurement’s strengths and areas for improvement, ultimately enhancing overall performance.
So, embrace these KPIs and leverage them to optimize your procurement processes and drive success.
Happy tracking!
Articles
Discuss how these trends affect your organization.
Our analysts are available for a short call. Bring a specific question and we will ground it in the data.