
Blog
8 Spend Analysis Metrics to Keep Track Of
By: Stefan Gergely -
16 September 2024


We love our data, and now that you're here, you're one step closer to loving it too.
A wide sample of data, so you can explore what is possible with our data
Choose ->
built with procurement in mind. Focused on manufacturers, products and more
Choose ->
built with insurance in mind. Focused on classifications, business activity tags and more
Choose ->
built with sustainability in mind. Focused on sustainability commitments, and environmental and social governance insights.
Choose ->
built with strategic insights in mind. Focused on market trends, competitor analysis, and industry-specific data
Choose ->

Keep up to date with our technology, what our clients are doing and get interesting monthly market insights.

In procurement, knowing where your money goes is essential, making spend analysis one of the key practices you should engage in.
And what easier way to get data on how you spend money than with the help of metrics?
Yet, if you don’t track the right ones, you might miss opportunities to streamline procurement, improve efficiency, and save money.
To prevent that from happening, we’ll explore eight crucial spend analysis metrics that you should keep track of.
They will help you better understand how you spend and consequently enable you to make more informed decisions to improve your bottom line.
Let’s dive right in.
As the name suggests, requisition-to-order time measures the time between when a purchase requisition (or request) is made and when the final order is placed.
It’s essentially a snapshot of how quickly this part of your procurement process runs.
So, what does it tell you?
If your requisition-to-order time is short, your team is efficient.
If it’s long, however, you’re likely facing some bottlenecks that can delay projects or increase costs.
A long requisition-to-order time could signal three things:
But what is considered a healthy requisition-to-order time, then?
According to Coupa’s 2024 Total Spend Management report, top-performing companies spend an average of just 3.8 hours on this process.
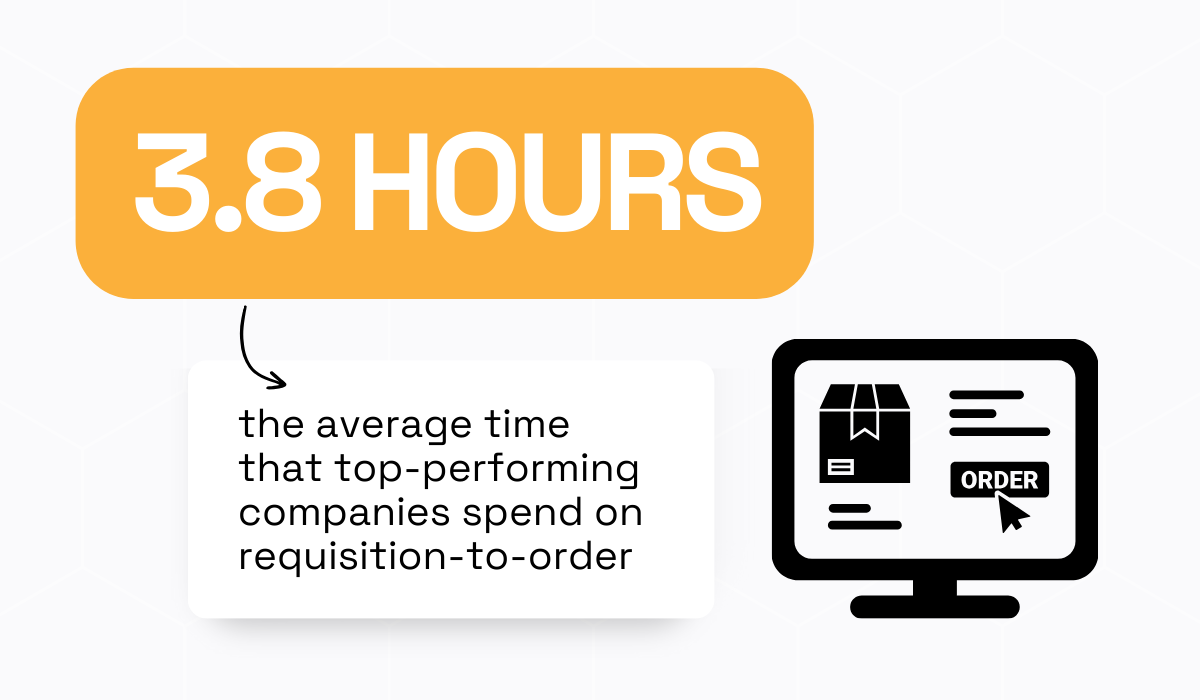
Illustration: Veridion / Data: Coupa
How do they achieve this?
It’s simple—they eliminate the bottlenecks mentioned above.
And the key to doing that? Procurement software.
With the right tools, you can automate every step—from raising a purchase request to sending it out for approval, no matter where the approver is.
Once approved, the software can instantly turn the requisition into a purchase order, speeding up the entire process.
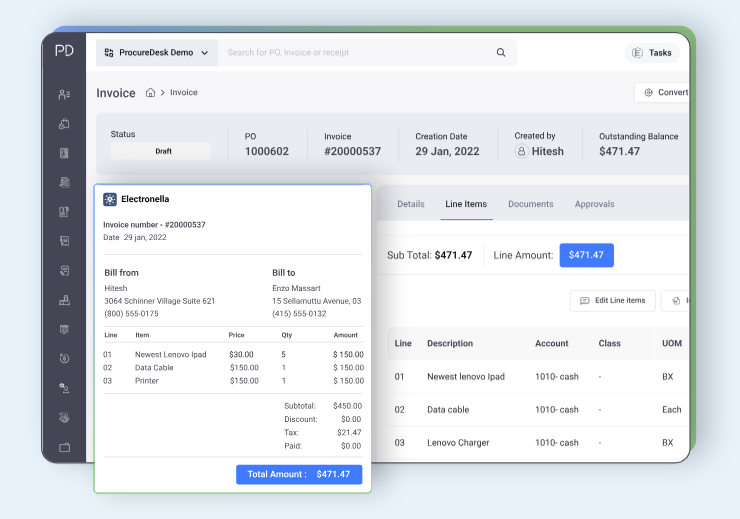
Source: ProcureDesk
Not only does this save time, but it also creates a clear digital trace of every step, making your processes more transparent.
So, how does your requisition-to-order time measure up? This metric will tell you.
And if it’s lagging, now’s the perfect time to dig in and find out what’s causing the delays.
This metric tracks the percentage of your spend that goes through pre-approved suppliers or contracts.
Simply put, it shows how much of your purchasing aligns with the guidelines your procurement team has set.
Here is how you can calculate it:
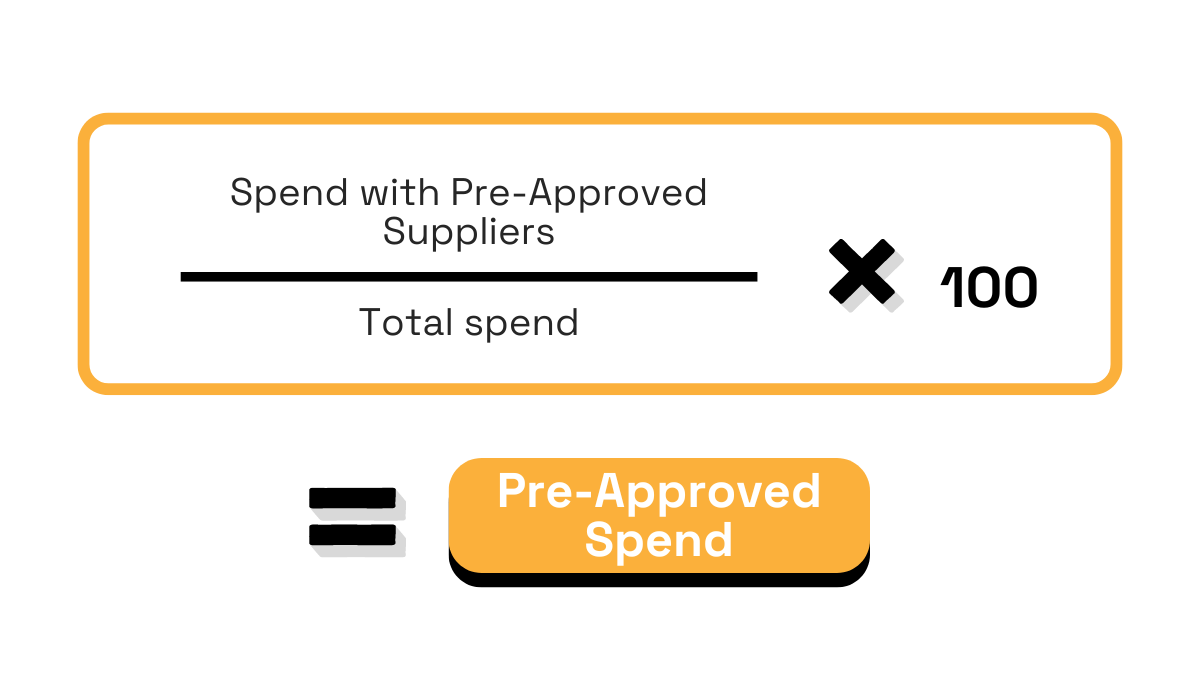
Source: Veridion
Why should this matter to you?
Well, when you stick to pre-approved suppliers, you get the best deals from trusted partners.
This protects you from maverick spending, ensures compliance, and lowers the risk of fraud.
So, if you have a high percentage of pre-approved spend, it’s a sign that you’re managing your budget wisely and following the set procurement policies.
Here’s something interesting: in 2019, over half of high-performing companies used a list of pre-approved suppliers.
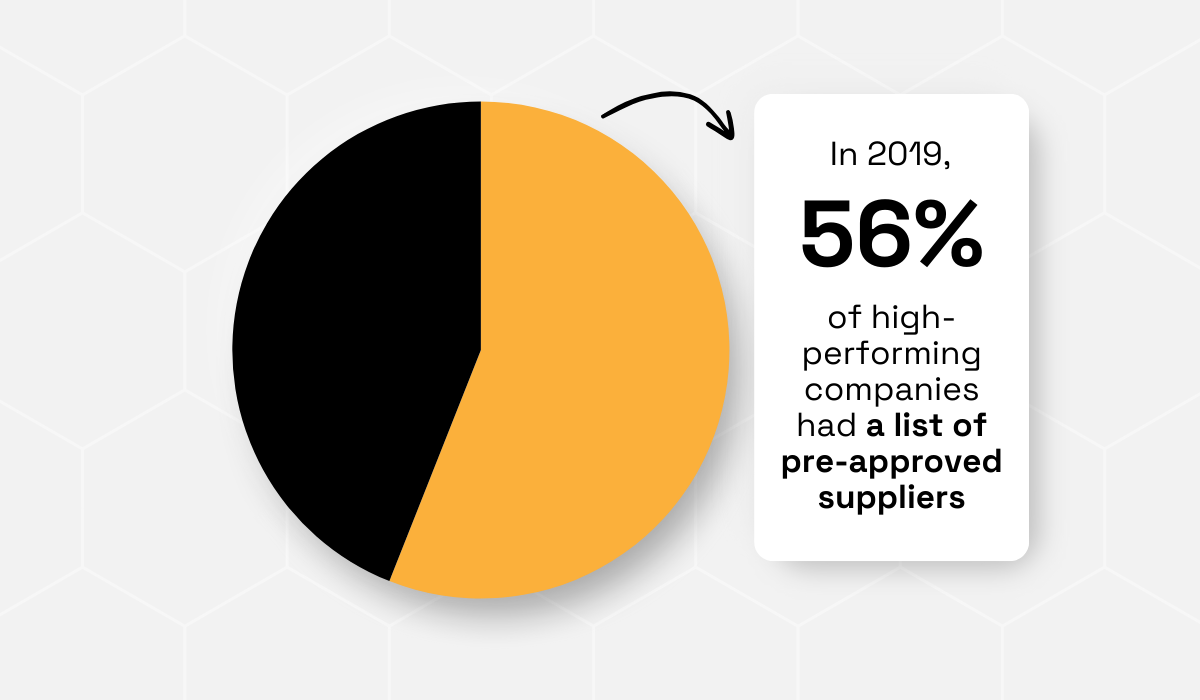
Illustration: Veridion / Data: The Hackett Group
This provided them with better control over their budgets and resulted in fewer financial surprises.
A high pre-approved spend also means more spend under management, which can lead to even more savings and stronger relationships with your key vendors.
So, what can you do to increase your pre-approved spend?
Start by identifying reliable suppliers using services like Veridion’s supplier discovery platform.
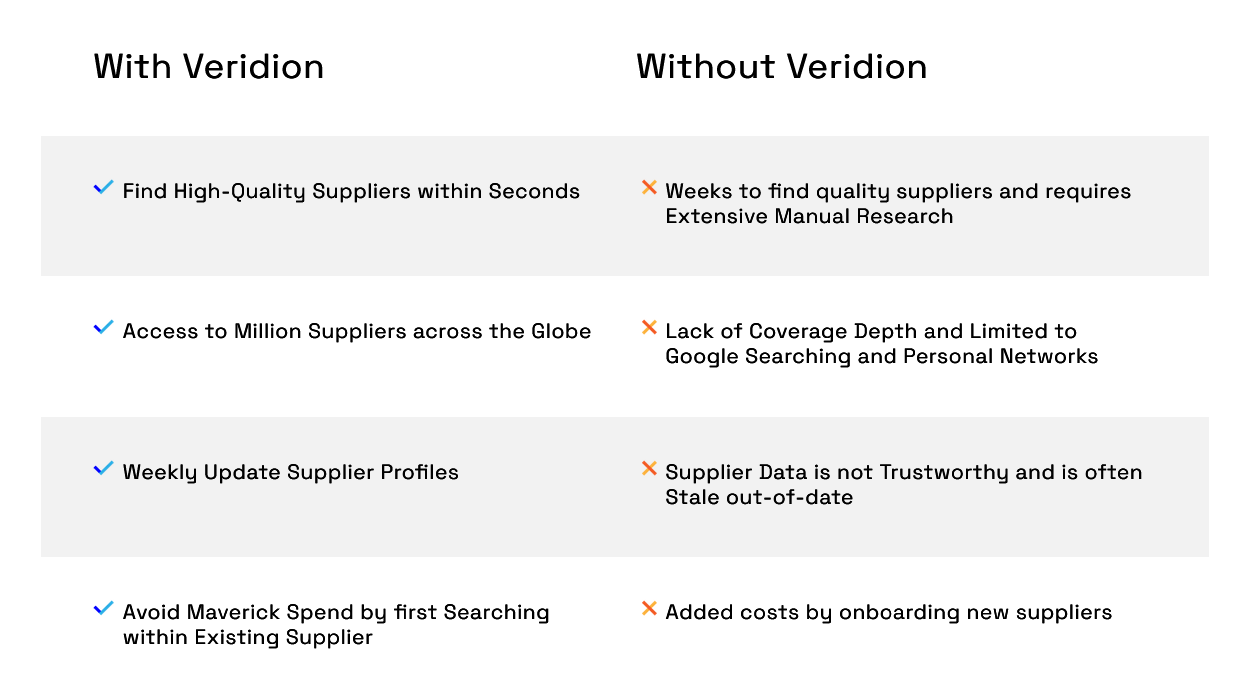
Source: Veridion
Build your pre-approved supplier lists, and with Veridion’s alerts on supplier changes, ensure those suppliers continue to be your best, low-risk option.
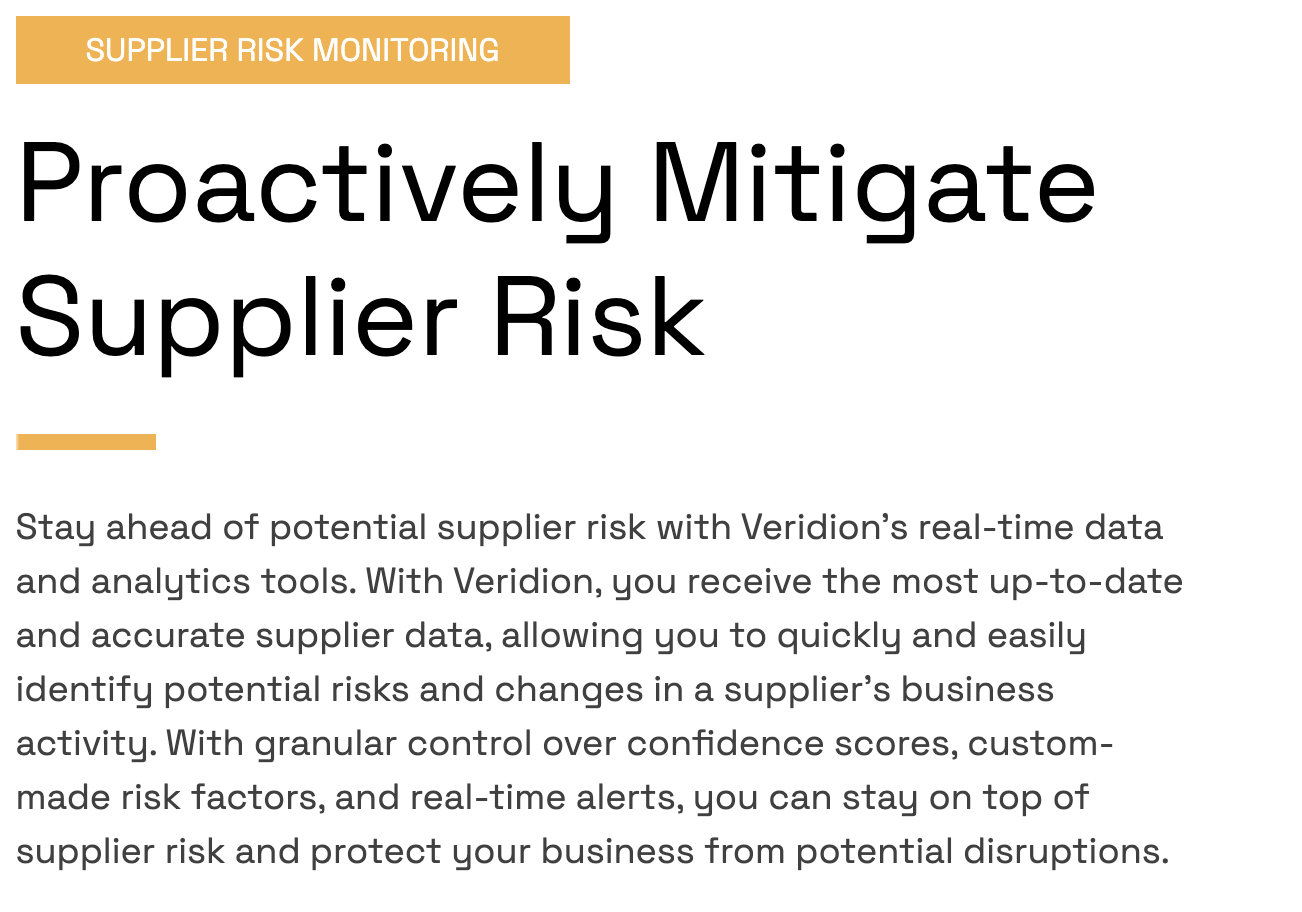
Source: Veridion
Lastly, implement user-friendly procurement software that will guide your employees to purchase only from these approved suppliers.
Why?
Because top performers who do this achieve an impressive 96.1% pre-approved spend, according to the Coupa benchmark study we mentioned earlier.
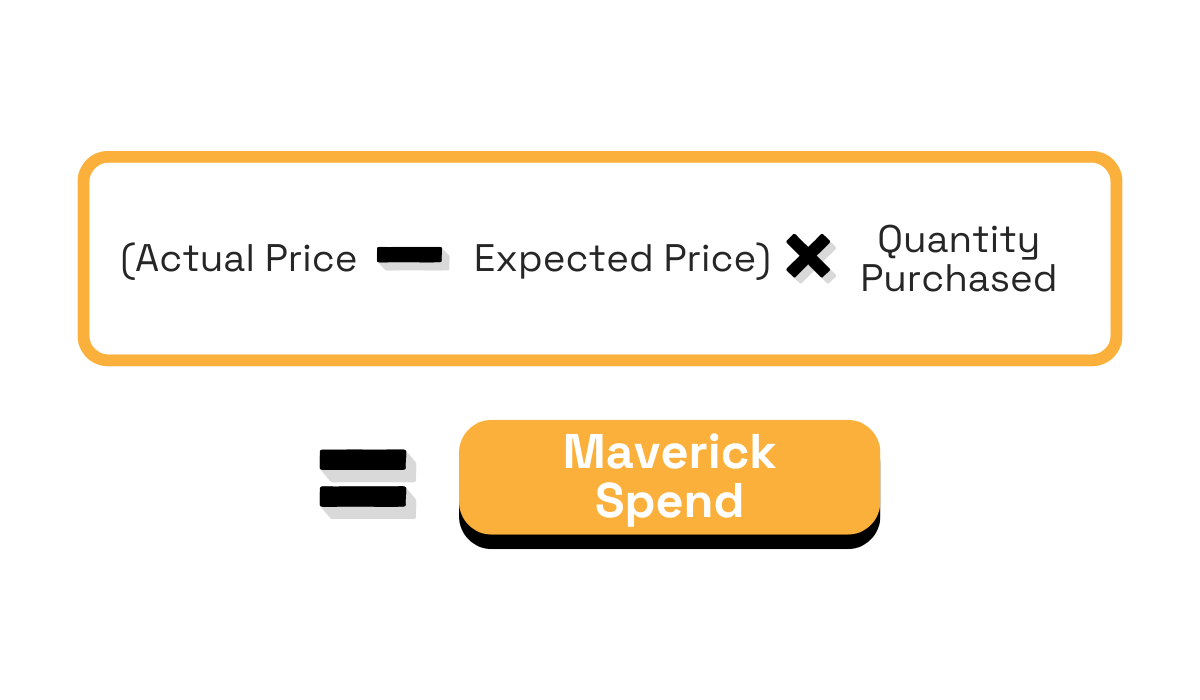
On the flip side of pre-approved spend, there is maverick spend.
Maverick spend refers to the money spent outside of your established procurement processes, or, in other words, when employees bypass your approved suppliers or ignore the rules.
You can calculate it using the following formula:

Source: Veridion
But why does maverick spend happen in the first place?
According to The Hackett Group’s 2019 User Experience and Maverick Spend Study, it usually comes down to a few key reasons, illustrated below.
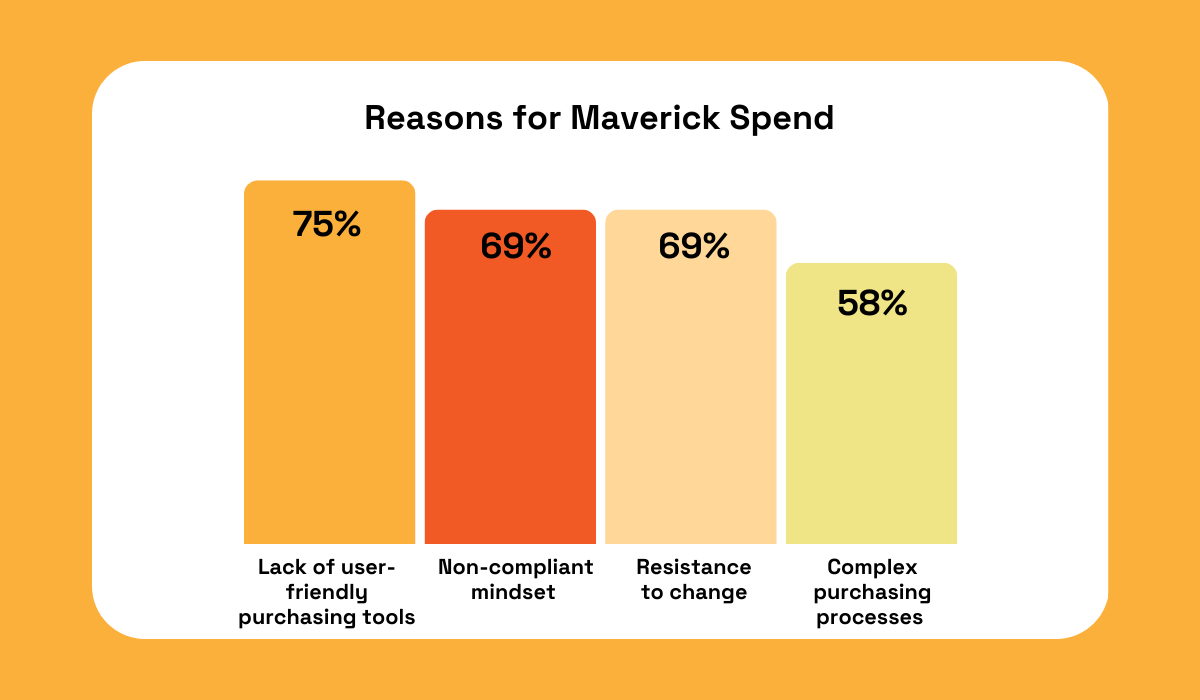
Illustration: Veridion / Data: The Hackett Group
All these reasons push employees to find their own, quicker ways to purchase goods and services.
But let’s see how maverick spend affects your company.
For starters, it drives up costs.
Employees who go off-contract miss out on the pre-negotiated deals you’ve worked hard to secure.
For example, if someone buys office supplies from a non-approved vendor, they may pay a premium, miss out on bulk pricing, or buy items that don’t meet company standards.
Beyond the immediate cost, there’s also a hidden price:
Given all this, it is really important to track this metric and work on minimizing it.
So, what can you do to minimize maverick spend?
First, invest in user-friendly procurement tools that make it easier for employees to follow approved processes.
Second, provide clear training on the importance of compliance, and third, implement monitoring systems to track and reduce off-contract purchases.
It is bound to pay off in more ways than one.
PPV measures the difference between what you expected to pay for goods or services and what you actually paid.
Source: Veridion
In other words, it tells you if your team is hitting their savings targets or if you’re overspending.
If you’re consistently paying more than expected, this could point to several issues:
| Outdated pricing information | If your pricing data isn’t updated, you might be using old numbers that don’t reflect current market rates. |
| Changing vendors too often | Switching suppliers often can lead to unexpected price differences, especially if new vendors have different terms or hidden fees. |
| Lots of rush orders | Urgent purchases often come with higher costs due to expedited shipping or emergency fees. |
| Incorrect volume estimations | If you’re not ordering the right quantities, you may be missing out on bulk discounts or overpaying for smaller orders. |
These are just a few reasons why your PPV might be unfavorable. And if these factors go unchecked, they can slowly erode your bottom line.
But here’s the thing: an unfavorable PPV doesn’t always mean you’re doing something wrong.
Sometimes, external factors like market shortages or supply chain delays push prices up.
And in those cases, negotiating down to your last purchase price (LPP) may not be realistic.
Plus, remember that even if PPV shows you’re paying more, it’s possible you’ve avoided an even bigger cost.
For example, if prices rise by 10% and your team negotiates it down to just a 5% increase—that’s still a win!
You’ve minimized the impact of rising costs.
All in all, tracking PPV matters because it helps you spot areas where you’re overspending, but it’s also important to put it in context with other procurement KPIs.
This way, you get a clear picture of where your purchasing strategy works or needs improvement.
Realized savings is a metric that measures how much money your procurement efforts are actually saving the company.
This can come from various areas—better supplier contracts, process improvements, or the implementation of new technologies.
Unlike projected savings (i.e., what you expect to save), realized savings are the actual, measurable reductions in costs that have been achieved.
High-performing companies, for instance, save an average of 5.8% of their total spend.
That’s a significant gain, as highlighted in the report we referenced earlier.
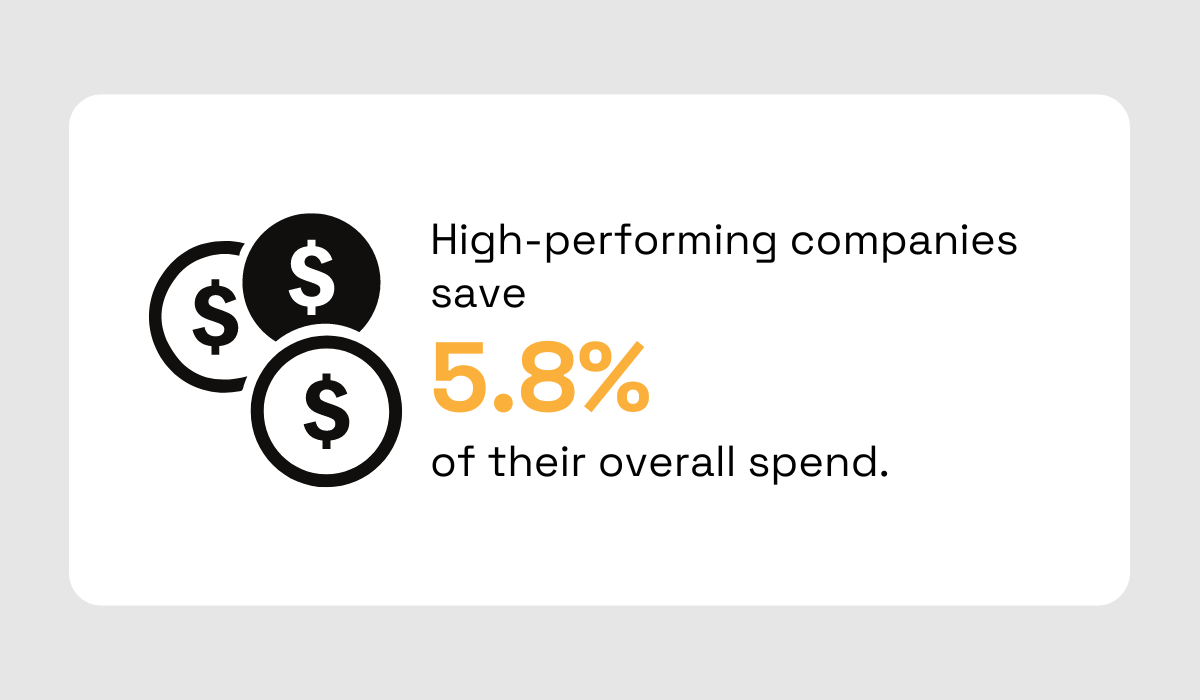
Illustration: Veridion / Data: Coupa
So, why should you track realized savings?
Because it gives you a clear view of whether your procurement strategies are paying off.
Think about it—are your e-procurement tools, data-driven negotiations, or supplier diversification strategies leading to real savings, or just theoretical ones?
If you’re not tracking this, you may miss valuable insights that could help you tweak your approach and save more.
But there’s more to it.
Tracking realized savings also pushes your team to keep looking for ways to cut costs, ensuring that the savings you plan for are fully realized.
It also allows you to benchmark performance, assess the success of your procurement initiatives, and identify areas for improvement.
One important note—tracking this metric goes beyond a simple comparison of financial statements.
It’s about understanding how savings translate into actual value for the company, which is why we’ve created a detailed guide on how to measure cost savings effectively.
Be sure to check it out!
This metric measures the percentage of your total spend attributed to specific suppliers, categories, or departments.
Essentially, it shows how your budget is distributed across different parts of your procurement.
Here is how to calculate it:
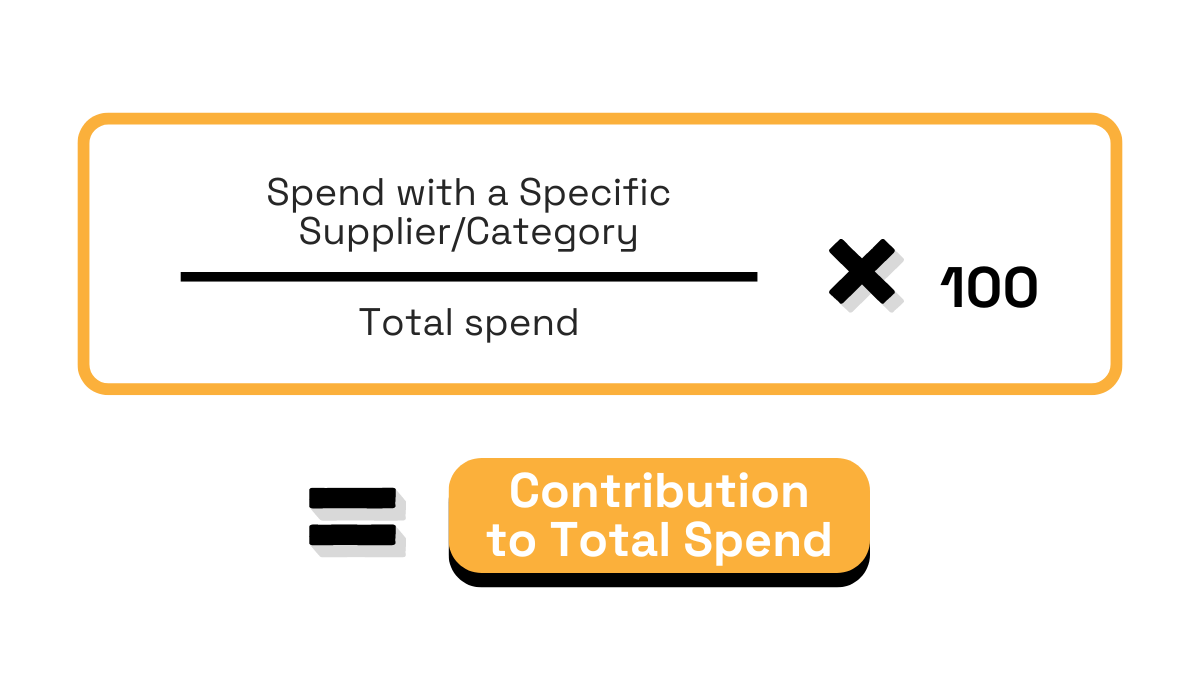
Source: Veridion
Tracking contribution to total spend helps you see where your costs are concentrated.
Why is that important?
Because, when a big chunk of your spending goes to a single supplier or category, you can negotiate better deals using your buying power.
Let’s say a large percentage of your budget goes toward a specific supplier for raw steel.
With this insight, you might realize that consolidating your purchases with this supplier could unlock better pricing thanks to higher order volumes.
On the flip side, if you’re spreading your spend across multiple suppliers for different raw materials, you might be leaving money on the table.
So, by concentrating your orders with fewer suppliers, you could negotiate bulk discounts or secure more favorable terms.
At the end of the day, understanding how your spending is distributed helps you make smarter decisions.
You can strengthen supplier relationships, optimize your budget, and improve your negotiating power.
Contract compliance measures how well your purchases align with the terms of existing supplier contracts.
You can track this through several key metrics, illustrated in the image below.
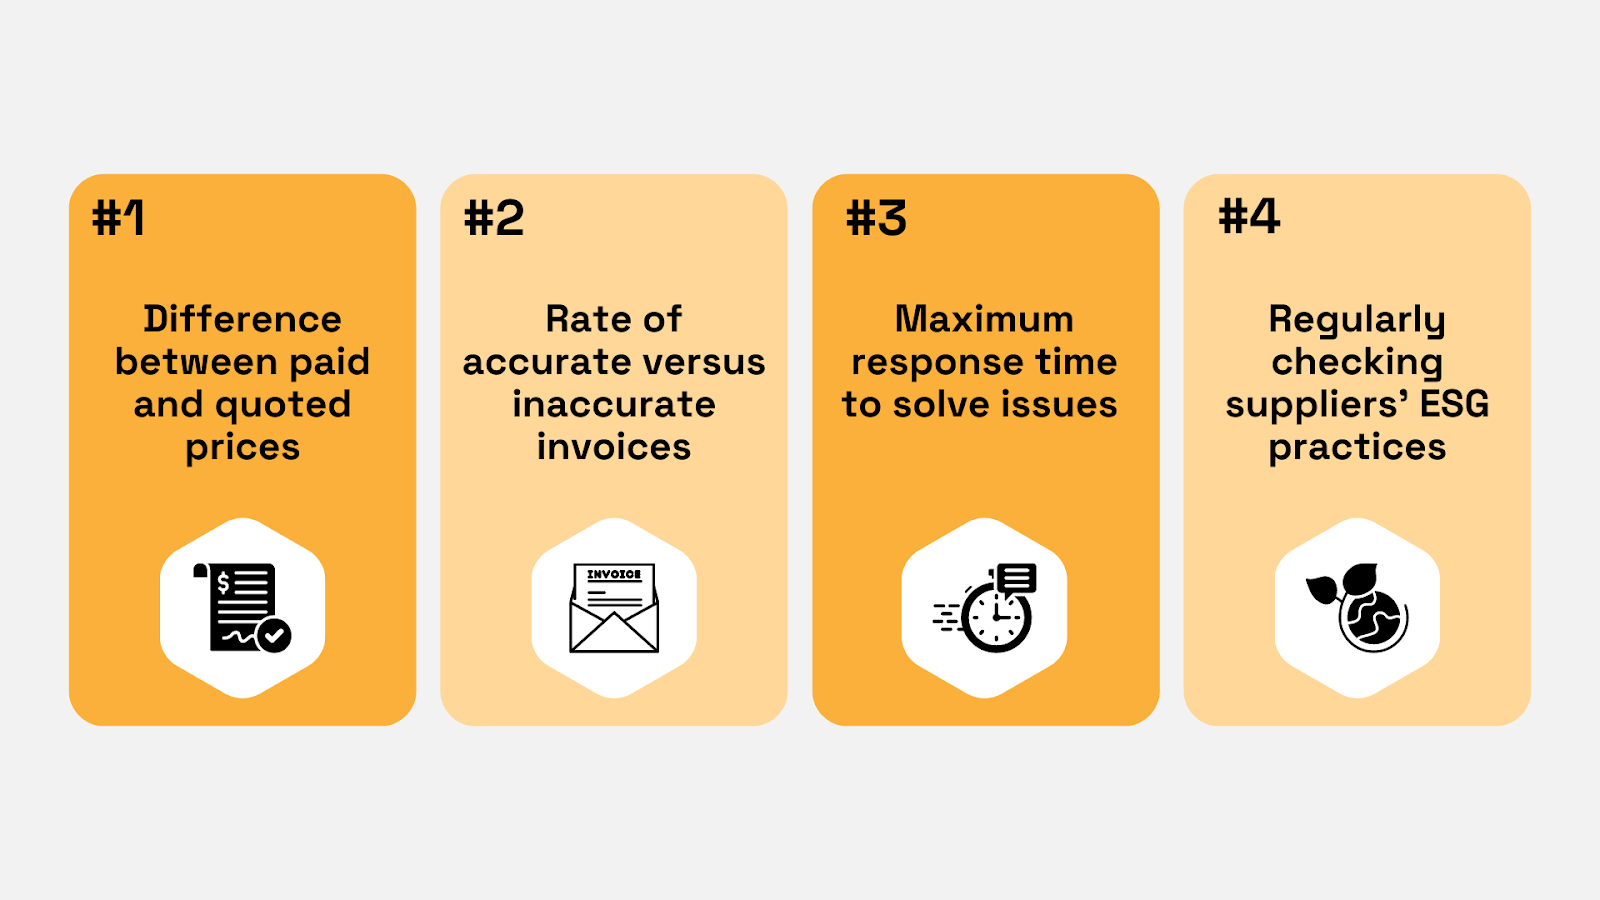
Source: Veridion
But why should you care about this often-overlooked procurement KPI?
Because it can make or break your procurement strategy.
When you monitor contract compliance, you can more easily ensure that you and your suppliers are sticking to the agreed terms.
This protects you from missed savings, unexpected costs, and potential quality issues.
Think about it—if you have a contract for discounted rates on bulk purchases, but your team buys outside of those terms, you’re losing money.
Or, if a supplier charges more than what’s in the contract or doesn’t deliver as promised, you’re stuck with higher costs and potential delays.
By keeping an eye on contract compliance, you ensure everyone plays by the rules, helping you save more and keep costs under control.
Just like contract compliance, supplier performance is something you can measure through several metrics.
Here’s what you should be keeping an eye on:
| Lead times | How fast are suppliers delivering your orders? |
| Contract compliance | Are they sticking to the terms you agreed on? |
| Availability | How often can they supply the products or services when you need them? |
| On-time delivery rate | Are they consistently delivering on time? |
| Quality | How good are the products? What’s the defect rate? |
| Pricing | Is their pricing competitive and fair? |
| Responsiveness | How quickly do they handle issues or requests? |
By tracking these metrics, you can easily determine if your suppliers are adding value to your business or becoming a burden.
For example, if you’re investing a lot in a supplier, but their delivery times or product quality aren’t cutting it, you might want to reconsider that partnership.
On the other hand, if a supplier consistently meets or exceeds your expectations while offering competitive prices, that’s a relationship worth nurturing.
But the key is, then, to share these metrics with suppliers, as Eduardo Piña, Commodity Manager at Tenneco Inc, suggests:
Illustration: Veridion / Quote: LinkedIn
So, tracking supplier performance is only half the battle—acting on it is where real change happens.
How many of these spend analysis metrics can you say you actively keep track of?
If the answer is “not enough,” it’s time to roll up your sleeves.
Start by focusing on one or two areas where you can improve, whether that’s speeding up your requisition-to-order time or tightening control over maverick spend.
Tracking these metrics will help you identify gaps, improve processes, and ultimately make smarter decisions with your procurement budget.
The key is consistency—because you know what they say: “The more you measure, the more you can improve.”