Key Strategic Procurement KPIs You Should Track


You’ve probably heard the famous saying by Lord Kelvin: “If you can’t measure it, you can’t improve it”.
This principle holds true in procurement, too.
By measuring various aspects of the procurement process, you can identify areas for improvement, assess your strengths and weaknesses, and inform your strategies to ensure smooth, cost-effective, and risk-free operations.
In this article, we explore some important KPIs across four vital aspects of procurement—purchasing, cost savings, suppliers, and spend—that you should consider tracking to take your procurement game to the next level.
Let’s get started.
Let’s start with purchasing KPIs, which evaluate the efficiency, cost-effectiveness, and value of the purchasing process within procurement.
The purchase order (PO) cycle time is a KPI that estimates the total time it takes to convert a purchase requisition into a purchase order.
In simpler terms, it measures the speed at which POs are processed, making it a crucial KPI for assessing the efficiency of your strategic procurement process.
The objective here is to minimize this timeframe as much as possible.
Namely, a shorter cycle time signifies a more streamlined workflow, operational fluidity, and adherence to schedules.
The formula itself is simple: pinpoint when the process starts and ends, then calculate the time elapsed between these two points.
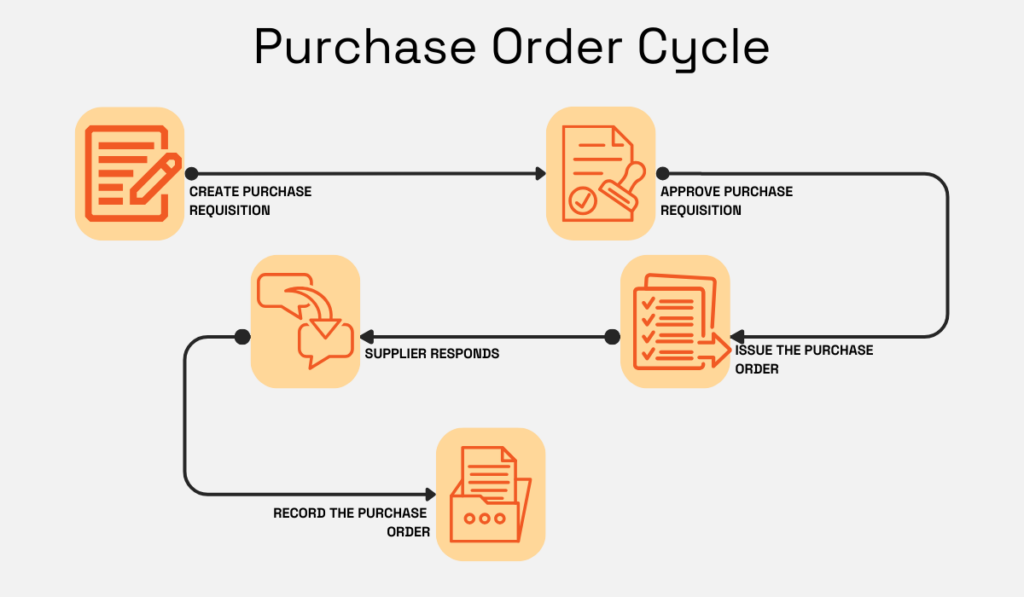
Keep in mind, however, that you need to consider the entire purchase order process, taking into account all the steps involved.
You can see them outlined in the image below.
Source: Veridion
By keeping a close eye on this KPI, you can uncover bottlenecks and streamline your procurement process even further, driving the business toward greater efficiency and potential cost savings.
This metric focuses on calculating the total cost associated with a particular purchase over its entire life cycle.
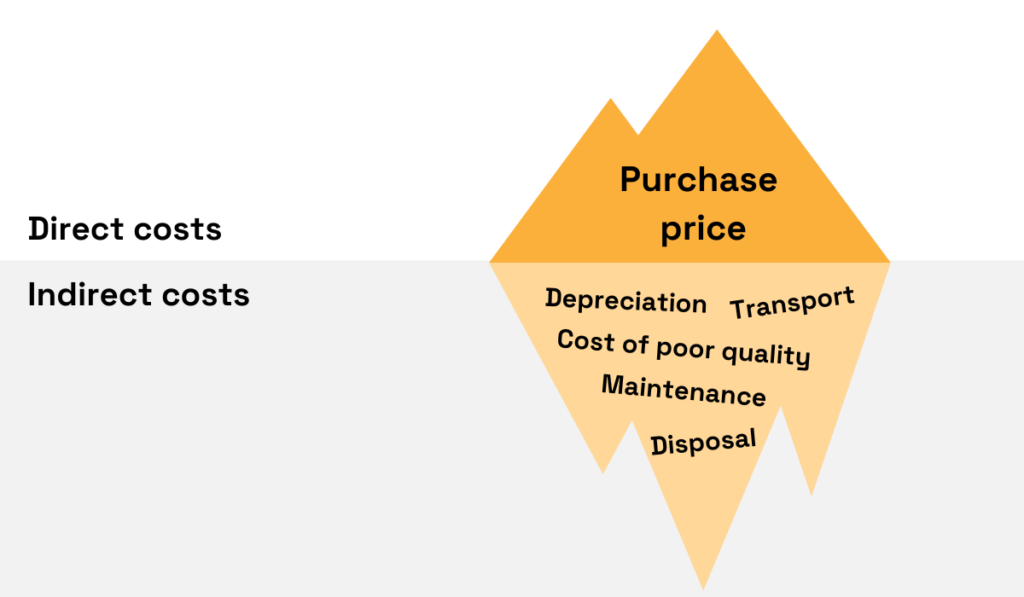
It encompasses not only the initial purchase price but also all expenses related to acquiring, maintaining, and disposing of the product.
You can think of TCO as an iceberg: the purchase price is the visible part at the top, while the rest of the costs are hidden below the surface.
Source: Veridion
Tracking this KPI helps procurement teams and companies better understand both the direct and indirect expenses incurred through their purchases, in turn empowering better-informed, more cost-effective decision-making.
So, how do you calculate TCO?
Easily. You simply determine the timeframe for the calculation, quantify each cost component, and then just add them all up.
This KPI is all about assessing the profit-effectiveness of the procurement function as a whole.
Its main focus is on gauging procurement’s impact on the bottom line.
As such, it’s vital for demonstrating its value for the company, as well as ensuring the business maintains financial strength to pursue its objectives.
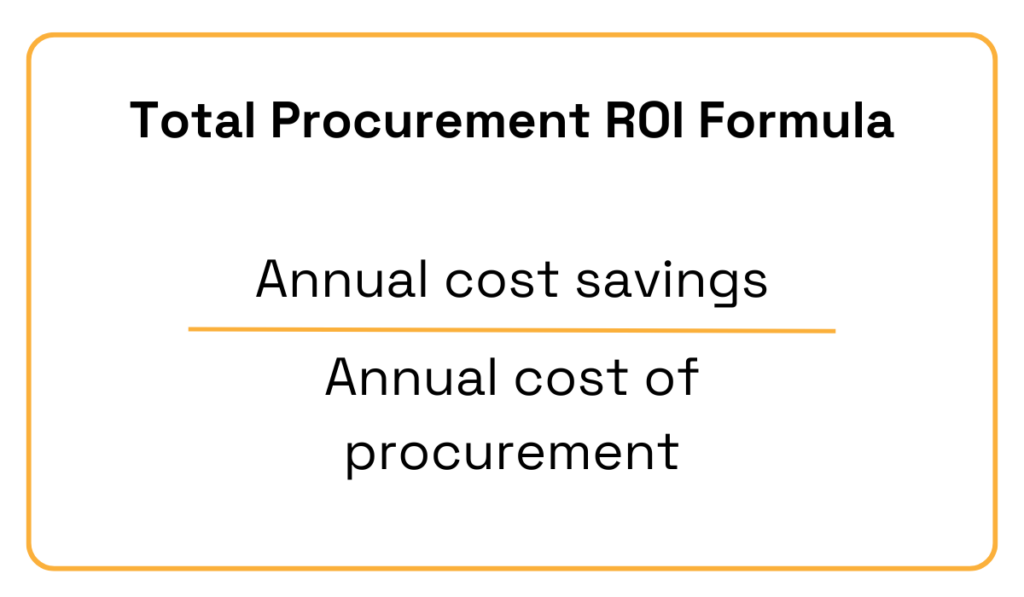
To calculate total procurement ROI, you’re going to quantify two things: the money procurement spends and the money it helps save in a given period.
Source: Veridion
The former category includes components like total cost per invoice, total paper check payments, and cost per payment, while the latter typically encompasses metrics such as total rebates secured, catalog compliance amount, and so on.
Once you defined all the inputs and outputs, the rest is a breeze: simply divide the annual cost savings by the annual procurement cost.
Now, to gauge the effectiveness of the PO procedure, it’s not enough to measure only the time required to process a purchase order.
You should consider the associated costs, too.
This is where the average cost of processing a PO metric comes into play.
It measures the expenses incurred by a company to process a single purchase order, providing insight into the cost-effectiveness of the entire workflow.
And guess what?
You’ll find that the cycle time and cost of PO processing are actually intertwined: the faster the process, the greater its overall efficiency, leading to lower expenses.
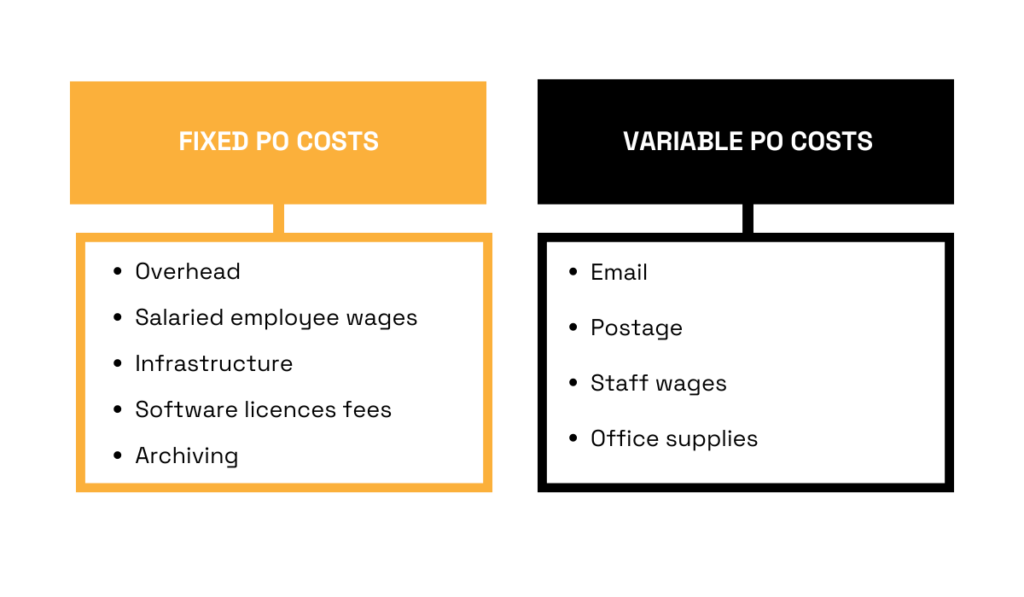
An important thing to remember here is that PO processing costs consist of two categories: fixed costs (such as overhead or employee wages) and variable costs (such as email or postage).
Source: Veridion
To calculate this KPI, you typically sum them all up over a specific period (e.g., monthly or annually) and divide that figure by the total number of purchase orders processed during that same time frame.
Next up, we’ll be covering cost and savings KPIs.
As the name suggests, they revolve around the financial benefits of procurement processes.
Historically, cost reduction has been procurement’s primary role and ultimate goal.
And even as its role evolves into a more strategic one, as is the case today, monitoring this KPI stays equally important.
It helps evaluate the effectiveness of your cost-cutting strategies, such as negotiations or process optimization, and of course, facilitates their improvement.
The formula for calculating cost reduction is pretty straightforward: simply subtract the last price you paid for a product or service from the actual purchase price.
The greater the savings achieved, the more successful the strategy.
Plus, this KPI usually garners the most attention across the entire company, so it serves as an effective tool for demonstrating that procurement brings tangible value to the business.
However, be careful not to mix up this metric with the next KPI we’re going to cover: cost avoidance.
While cost reduction aims at cutting current expenses, cost avoidance takes a more proactive approach by focusing on preventing future costs from arising altogether.
For instance, if you were to enter into a long-term contract to preempt future price increases, you would use this metric to gauge the effectiveness of such a move.
Calculating cost avoidance can be a bit more tricky.
After all, this figure isn’t exactly visible on an invoice.
So how do you do it?
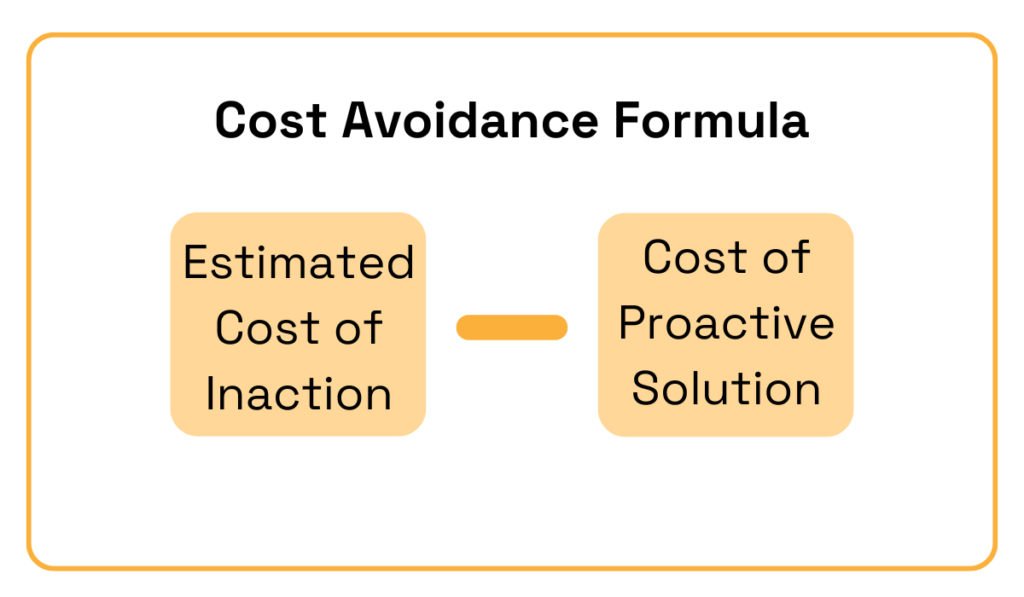
For starters, you should estimate the potential cost that would have been incurred if no preventive action had been taken.
This estimation can be based on historical data, prevailing market conditions, or anticipated cost trends.
Then, you’ll need to quantify all the expenses associated with implementing the preventive strategy.
Finally, all that’s left to do is to deduct the actual costs incurred post-implementation of cost-cutting measures from the projected costs had no action been taken.
Source: Veridion
This figure will, then, represent the financial value of the costs that you managed to avoid through a specific measure of initiative.
This metric assesses the total amount of money saved within a given year through both cost reduction (hard savings) and cost avoidance (soft savings).
It holds significant importance, as it provides a 360-degree view of procurement’s financial benefits.
This, ultimately, helps you boost stakeholder confidence and serves as a justification for investments in cost-saving initiatives.
There are various approaches and methodologies for calculating cost savings, some of which are:
| Historic savings | Compares current savings to past ones |
| Budget savings | Compares planned budget to actual spending |
| Request for Proposal (RFP) savings | Measures savings derived from the competitive bidding process |
| Technical savings | Measures savings realized when procuring alternative product services with different technical specifications |
If you’d like to dive a bit deeper into this topic, we’ve created a dedicated article specifically focusing on measuring procurement cost savings.
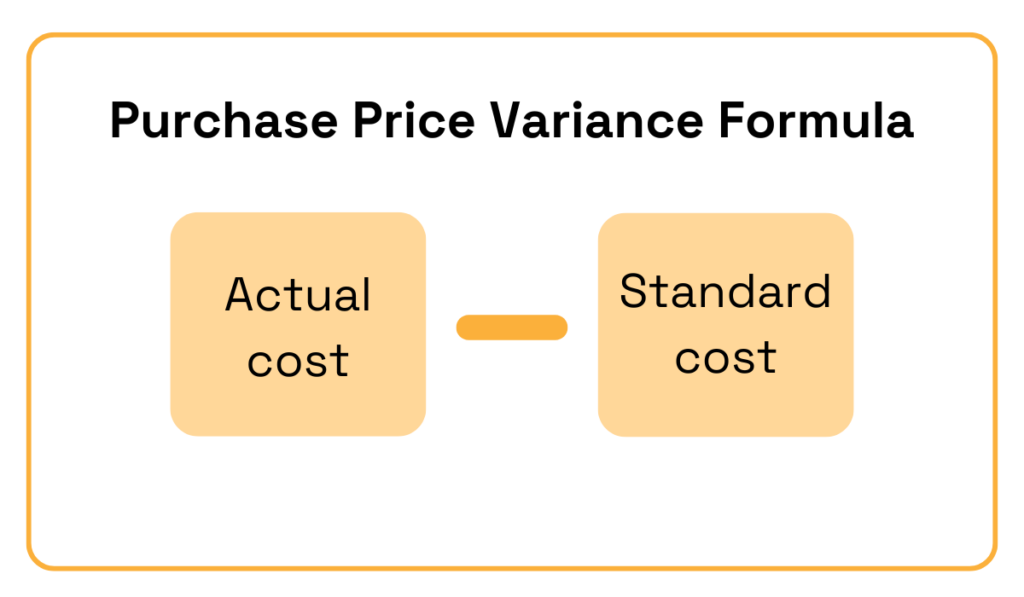
Purchase Price Variance (PPV) is a simple, yet insightful KPI that assesses the variance between the standard cost (also known as baseline price) of a procured product or service and the actual amount you end up paying for it.
It provides insights into price fluctuations over a defined period and helps gauge whether the procurement team is effectively meeting cost-saving targets.
To calculate PPV, use the following formula:
Source: Veridion
A positive variance indicates that the price exceeded the budgeted amount.
It’s a red flag signaling potential inefficiencies in certain procedures or communication gaps with suppliers.
Therefore, your goal as a procurement professional is to steer the PPV towards the negative spectrum, which suggests you’ve implemented successful cost-saving strategies and processes.
Suppliers have a huge impact on the overall outcomes of procurement, so it’s only natural you’re going to want to monitor their performance as well.
Here are some relevant supplier KPIs you should consider keeping your eye on.
This KPI assesses both the total number of suppliers you’re engaged with and the amount of money you invest in them.
By analyzing this metric, you gain a clearer understanding of your supplier network and the associated costs, enabling better supplier relationship management and optimization.
The goal here is to strike a balance.
You want enough diverse suppliers to mitigate risks and enhance resilience against supply chain disruptions, yet not too many to avoid unnecessary costs and maintain strong relationships with the ones you do collaborate with.
A commonly recommended strategy is the 80-20 approach, where 80% of your expenditure is directed through just 20% of your suppliers.
This ensures that the bulk of your spending is concentrated on a smaller, more manageable group of suppliers.
The quality performance rating, as its name implies, evaluates supplier efficiency as well as the quality of goods and services they provide.
Monitoring this KPI allows you to identify areas for improvement and ensure you receive the top-notch service you expect and deserve (and pay for).
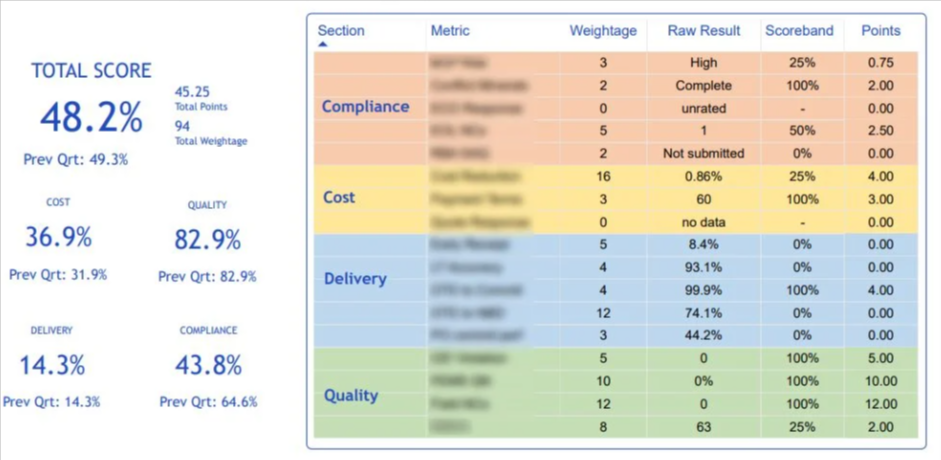
To keep tabs on this metric, you can use a supplier scorecard, such as the one from Just Analytics, which you can see below.
Source: Just Analytics
It’s a pretty useful tool, enabling you to cover all the bases and evaluate your suppliers across various key metrics.
These metrics may include:
This is the most efficient way to separate underperformers from the most reliable partners.
This is yet another important supplier efficiency metric.
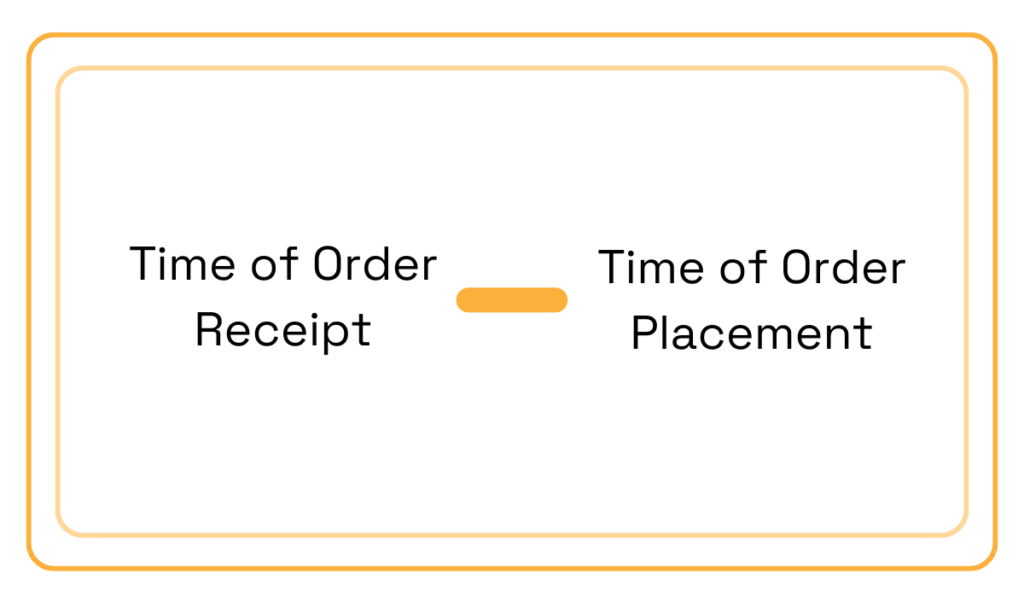
It measures the total time elapsed between the moment you place an order with the supplier and the moment that order arrives.
Typically, you’d want this figure to be as low as possible, especially if you’re adhering to the just-in-time framework.
Why?
Because it means that the supplier processes, packages, and delivers orders quickly and efficiently.
Besides, tracking supplier lead time is very important for maintaining optimized stock levels and mitigating the risk of under or overstocking.
If you understand precisely how long it takes for a supplier to deliver a product, you’ll also know when it’s best to place an order.
How to calculate this metric?
For individual orders, use this simple formula.
Source: Veridion
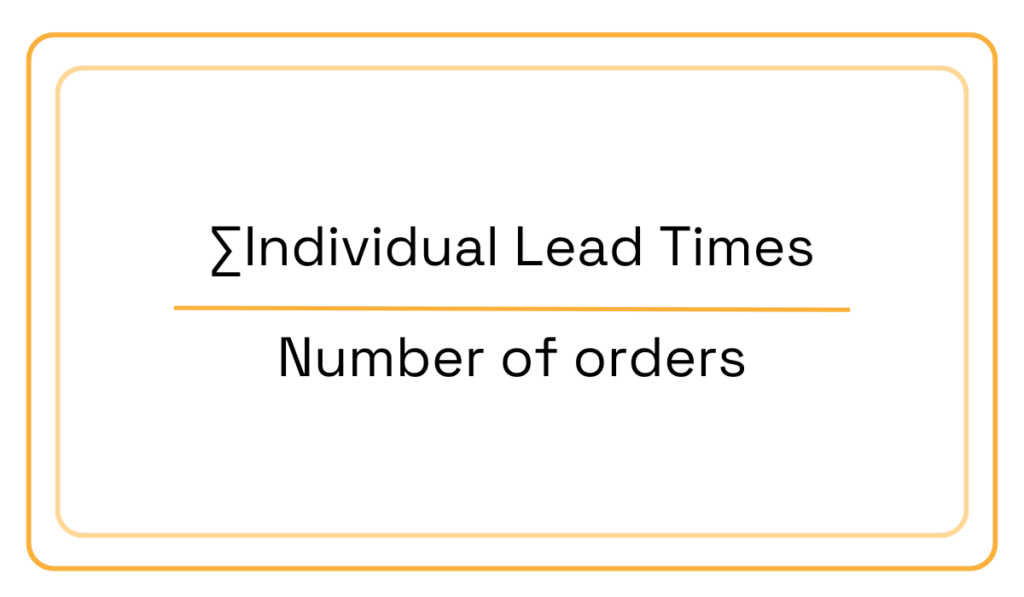
But, to get an overall picture, you’ll need to calculate the average lead time over a certain period:
Source: Veridion
This will give you a more accurate estimate of your suppliers’ lead times and their overall efficiency.
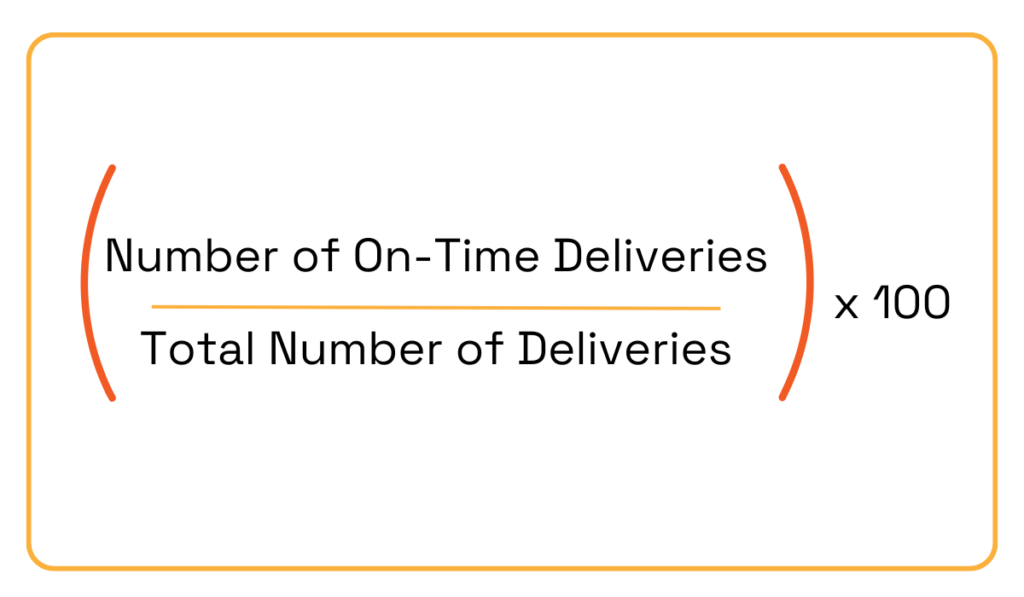
While lead time KPI measures the time frame taken by a supplier to deliver a product or service, on-time delivery (OTD) focuses on the frequency of timely deliveries.
It serves as a fool-proof method for evaluating supplier reliability, ensuring smooth operations, mitigating risks, and safeguarding the company’s reputation.
To calculate the OTD percentage, use the following formula.
Source: Veridion
This will provide insight into the rate of timely deliveries from a specific supplier within a given period and, after a while, it might even unveil some patterns and trends.
Is late delivery a recurring issue with a particular supplier?
Or does the problem, perhaps, seem to be tied to a certain product or geographical location?
Keeping tabs on this metric will help you find that out.
Finally, let’s explore spend KPIs, which are mainly centered on improving control, visibility, and management of procurement expenditures.
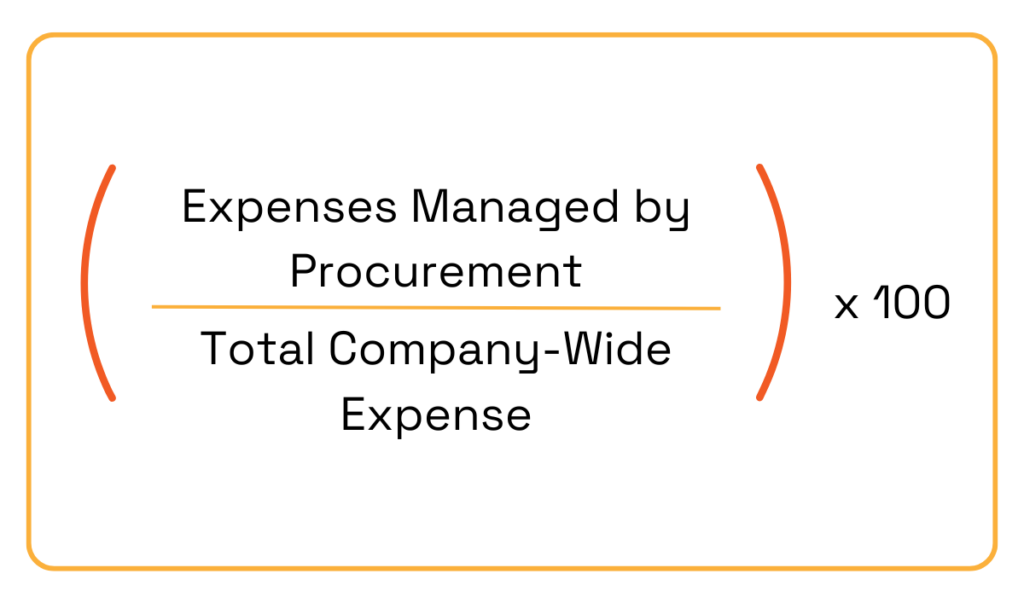
Spend under management (SUM) measures the expenditure overseen by the procurement department.
It consists of direct and indirect spend, and can be measured on both a corporate level and per-employee basis.
Why is monitoring this metric important?
Because it helps you gain more visibility of spend management, understand purchasing patterns, identify opportunities for cost savings, and improve financial forecasting.
To calculate the SUM percentage, you’re going to need the following formula.
Source: Veridion
Just bear in mind that the total company-wide spend excludes employees’ salaries and tax payments.
Now, a low figure, in this case, indicates that only a small percentage of the organization’s procurement activities are being actively managed, indicating that many purchases are being made outside of the established procurement processes.
In other words, when it comes to SUM, the higher the percentage, the better.
Maverick or rogue spend KPI measures instances of spending that don’t adhere to any predefined procurement policy.
This includes purchasing from unapproved suppliers and making purchases without going through an RFP or consulting the procurement team.
Tracking the rate of such spending is vital because it can reveal procedural or operational inefficiencies which, if left unaddressed, can result in missed cost-saving opportunities and compliance issues.
To calculate maverick spend, you first need to go through all spending data, including invoices, credit card statements, etc., and categorize it as either approved or maverick.
Once categorized, you’ll be able to easily quantify the amount of spending on maverick purchases and how frequently they occur within each category over a specific time period.
This metric focuses on determining the contribution of each supplier, product category, or individual item to the overall expenditure of the function.
Essentially, it analyzes how spending is allocated across various activities or categories, thereby improving cost management and informing long-term procurement strategies through insights into spending patterns.
For instance, if it’s found that a significant portion of spend is allocated to a particular product category, this may signal it’s prime time to try to negotiate for better terms or seek bulk discounts to reduce these costs.
So, to calculate, for example, the total spend contribution of different categories, follow these three steps:
This process can, of course, be applied universally, whether analyzing suppliers, product categories, or individual items.
Now, we can’t pretend that tracking this extensive list of metrics doesn’t seem daunting.
But luckily, with the right approach, it doesn’t have to be.
Start by selecting a few critical KPIs that align closely with your strategic goals and areas you want to improve.
You really don’t have to track all of them at once.
But the most important thing to keep in mind if you want to monitor procurement KPIs effectively is to steer clear of manual tracking, such as spreadsheets.
This approach can (and often does) really turn out to be laborious, cumbersome, and prone to errors.
Instead, if you have any kind of dedicated procurement software, take full advantage of it.
Such software can gather all relevant data automatically, keep it fresh and accurate, and even analyze it for you.
This way, you’ll be able to make the most out of these insights and improve your processes without sacrificing your own time.