- The SaaS industry will quintuple in market value by 2036.
- The average SaaS sales team rates its own readiness a 3.8 out of 10.
- Companies lose $2–$10 million per annum to their competitors.
How much do you actually know about the companies chipping away at your market share?
Most SaaS teams have a partial picture. A few pricing pages, a handful of G2 reviews, a Slack thread with a screenshot someone spotted.
That’s not analysis. It’s guesswork dressed up as strategy, and it falls apart the moment a competitor moves first.
Here’s what SaaS competitive analysis actually involves, and how the frameworks behind it work.
What Exactly Does SaaS Competitive Analysis Include?
SaaS competitive analysis is the systematic process of evaluating competitors, including their products, pricing, marketing, and market position, to inform your own strategy.
It isn’t a one-time audit, but an ongoing practice.
A comprehensive analysis covers five components:
Competitor investigation | identifying who you’re actually up against, and how they operate |
|---|---|
Unique selling propositions | what sets each competitor apart, whether that’s price, features, or service |
Keyword and content research | what topics competitors rank for, and where the content gaps are |
Marketing strategy | how competitors position themselves, and through which channels |
Market share | who holds influence, and where the openings are |
Done well, this process sharpens product decisions and gives sales teams the context to win more deals.
And the market isn’t shrinking, either.
SaaS is on track to almost quintuple in market value, from $375.57 billion in 2026 to $1482.44 billion by 2036, according to Fortune Business Insights.
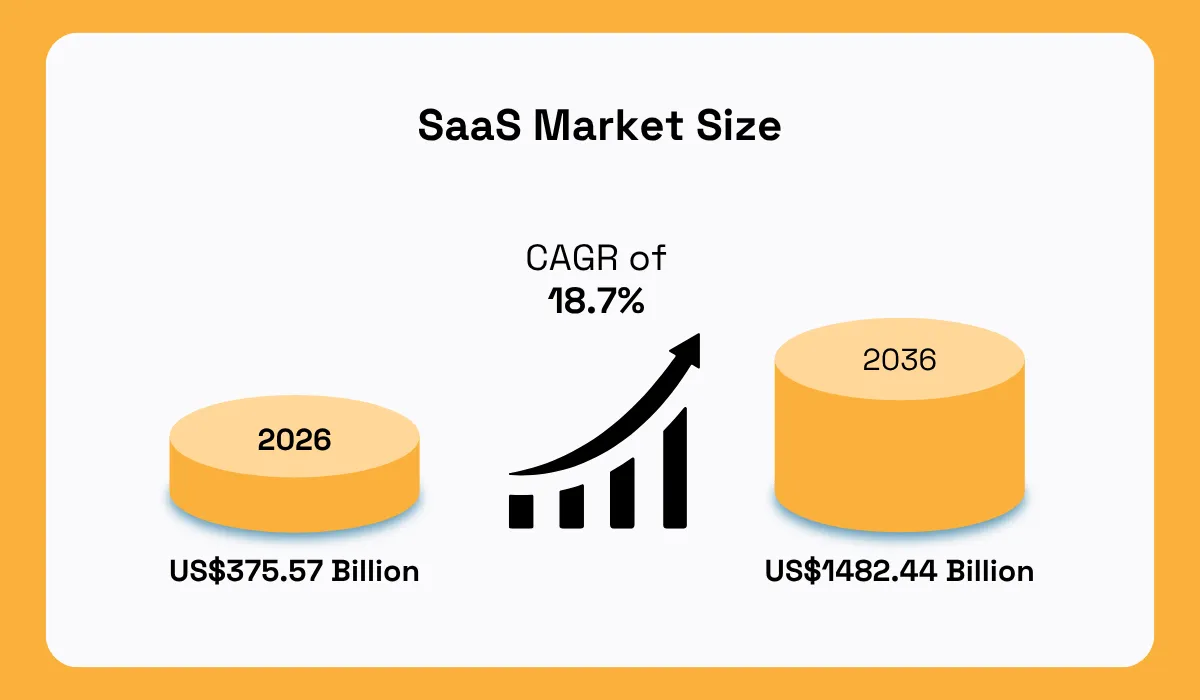
Illustration: Veridion / Data: Fortune Business Insights
More competitors are chasing that growth every quarter.
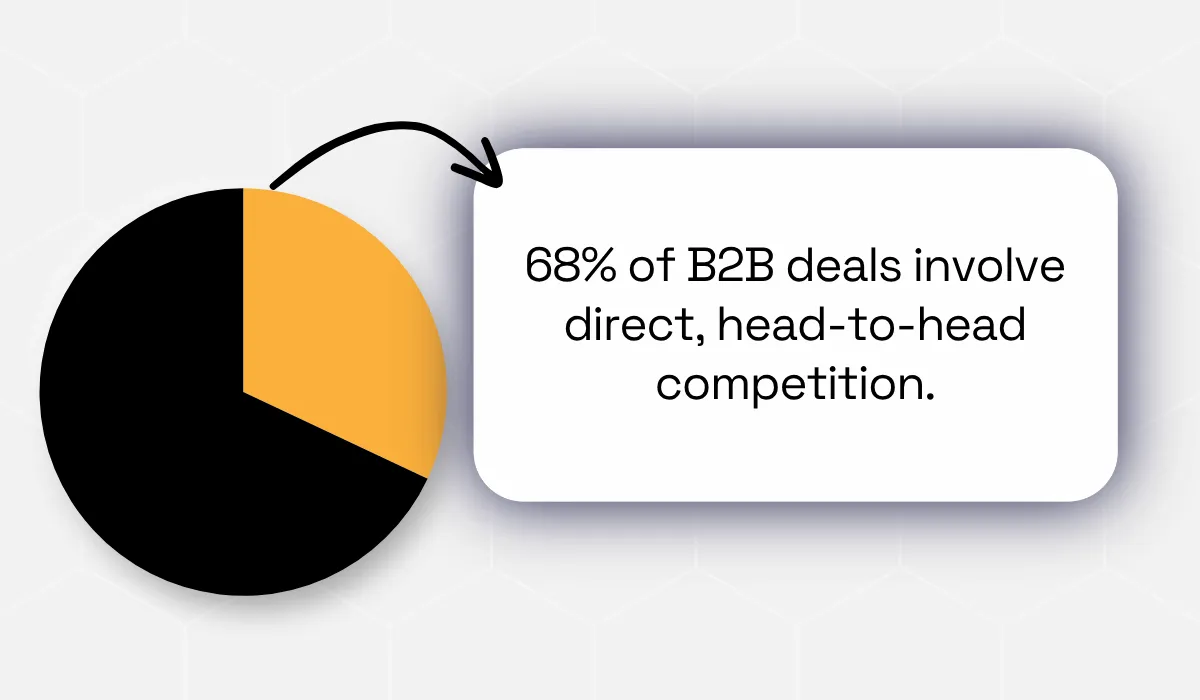
Furthermore, 68% of B2B deals now involve a named competitor in a head-to-head fight for the contract, yet the average sales team rates its own readiness a dismal 3.8 out of 10.
As pegged by Crayon’s 2025 State of Competitive Intelligence report, this gap results in a dramatic $2–$10 million in lost deals per annum.
That’s a cutthroat market that demands you prepare (and prepare well), or get left in the dust.
Even worse, 44% of companies don’t track competitors inside their CRM, and less than half of CI teams have KPIs in place to prove any of it is working.
As positioning consultant April Dunford puts it:
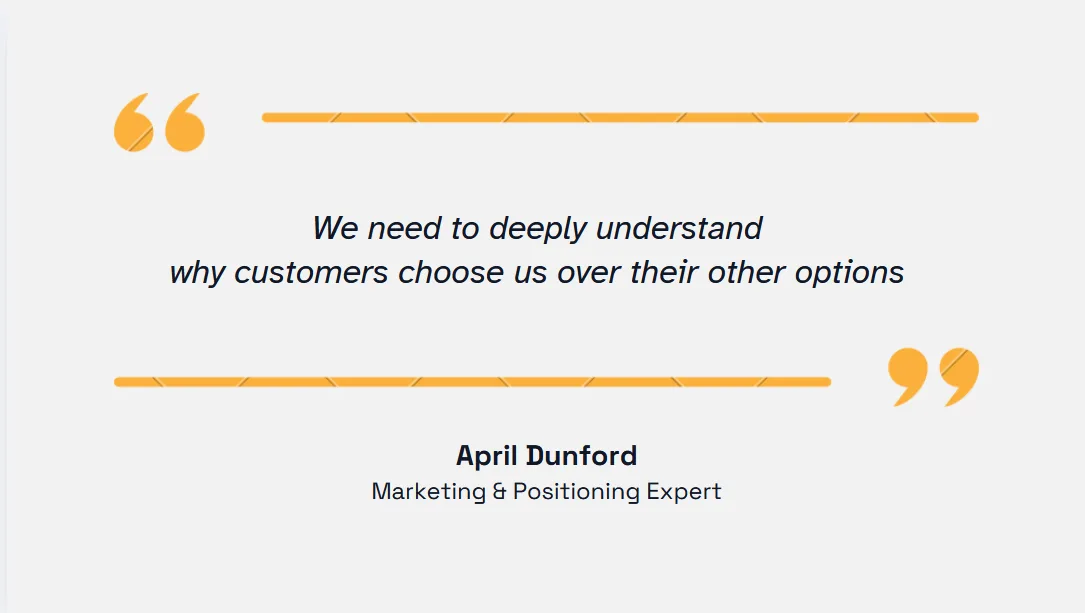
Illustration: Veridion / Quote: April Dunford’s substack
That level of confidence isn’t something you can get from vibes alone.
The key lies in reliable data.
Stale information on a competitor’s headcount, funding, or market position can send a strategy in the wrong direction, which makes tool selection matter tremendously.
Let’s look at the frameworks that help you move from blind guesswork to fact-based decision-making.
Which Competitive Analysis Frameworks Do SaaS Teams Use?
Different frameworks answer different questions.
SWOT gives you a quick internal read. Porter's Five Forces zooms out to market structure. A feature matrix tells you exactly where your product stacks up.
But relying on just one of them won't fix the bigger problem: an incomplete view of the competitive landscape.
None of the methods described below should be considered “the” definitive competitive analysis framework. It's rarely a good idea to put all your eggs in one basket.
Instead, what most SaaS teams do is reach for two or three methods, depending on what decision they're trying to make. This Swiss cheese model reduces the risk of missing any meaningful gaps, as each layer covers slightly different ground.
You'll find them described in detail below.
SWOT Analysis
SWOT breaks a competitor down into four buckets:
- strengths,
- weaknesses,
- opportunities,
- and threats.
It’s the fastest way to get a comprehensive (if surface-level) read on where a rival stands.
The upside is speed. You don’t need deep market data to run a SWOT. A few hours with a competitor’s website, pricing page, and reviews get you most of the way there.
The downside: that’s also its limit.
SWOT is only as sharp as the person filling it in. Two analysts can look at the same competitor and land on different quadrants entirely.
Even a rough SWOT can still drive a real call, though.
When Microsoft bundled Teams free with Office 365 in 2017, Slack didn't chase feature parity.
Instead, it doubled down on the strengths a SWOT would've flagged, like sharper UX or a stronger developer ecosystem. That bet on differentiation over imitation kept it competitive enough to land a $27 billion acquisition.
This type of tool works best when you need a fast, high-level gut check, early-stage market scoping, or a quick briefing before a leadership meeting.
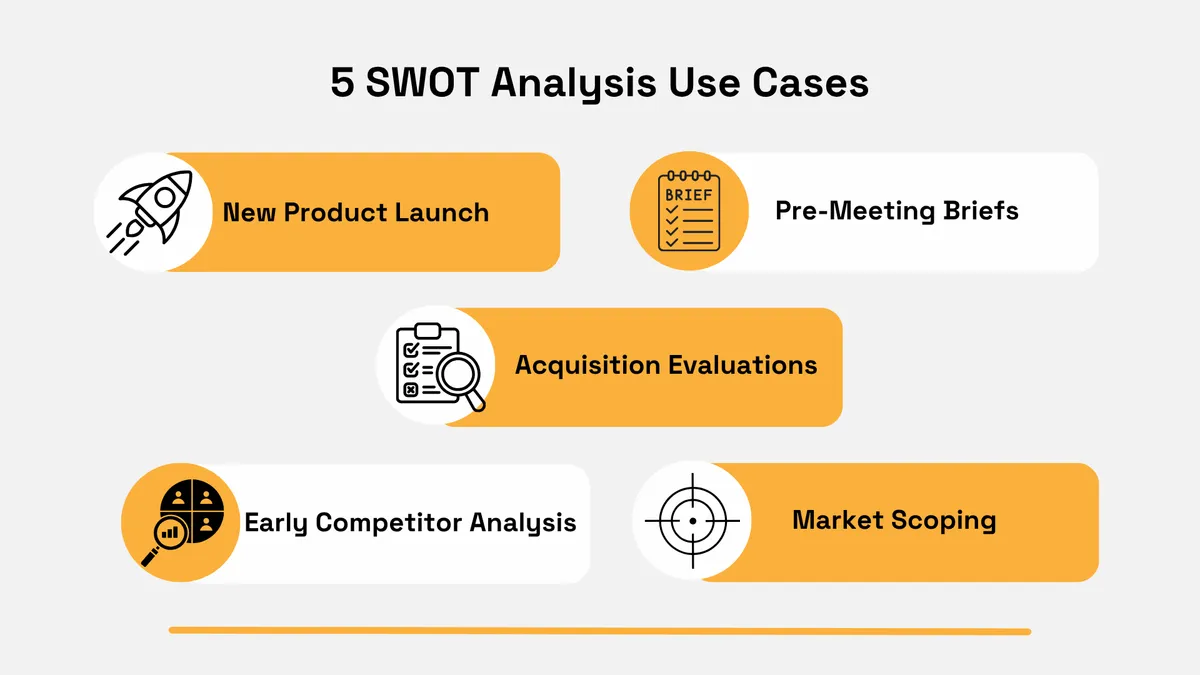
Illustration: Veridion
So, treat SWOT as a starting point, not a conclusion. It tells you where to look closer, not what to decide.
Porter’s Five Forces
Porter’s framework looks past individual competitors to the forces shaping the whole market:
- rivalry among existing players
- threat of new entrants
- threat of substitutes
- the bargaining power of both buyers and suppliers
In SaaS, this plays out in specific ways.
Buyer power tends to run high. Low switching costs and freemium tiers mean customers can walk. Supplier power concentrates around a handful of cloud providers (AWS, Azure, Google Cloud), so heavy reliance on one vendor is a real exposure.
Barriers to entry are often lower than they look, too, since capital requirements for a SaaS launch keep dropping.
A no-code tool can go from idea to public beta in weeks, not the months a legacy on-prem product once needed.
That is exactly why this force is worth tracking even when a market feels settled.
The tradeoff is effort.
This isn’t a framework you fill out in an afternoon. It takes real market and industry data, and it’s less reliable in categories that shift quickly.
Application-wise, this framework comes in handy when you need to understand market attractiveness and competitive intensity, not just individual rivals – useful ahead of fundraising or market-entry decisions.
Feature Comparison Matrix
This one is exactly as intuitive and uncomplicated as it sounds: it involves a simple, side-by-side breakdown of features across your product and your competitors, usually in a spreadsheet or table.
Its strength is clarity. Stakeholders who don’t have time for a written analysis can scan a matrix and immediately see where gaps exist.
The weakness is scope. It only captures what’s measurable. It says nothing about brand perception, customer sentiment, or go-to-market strategy.
So, whenever the decision in front of you specifically concerns product parity or differentiation, designing a matrix may help. Tasks that come to mind in particular involve roadmap prioritization, competitive battlecards, or a build-vs-buy call.
The downstream payoff tends to be significant if executed right.
One of the most common downstream uses of a feature matrix is the sales battlecard, a one-page competitive cheat sheet built from that comparison data and used by reps in live deals.
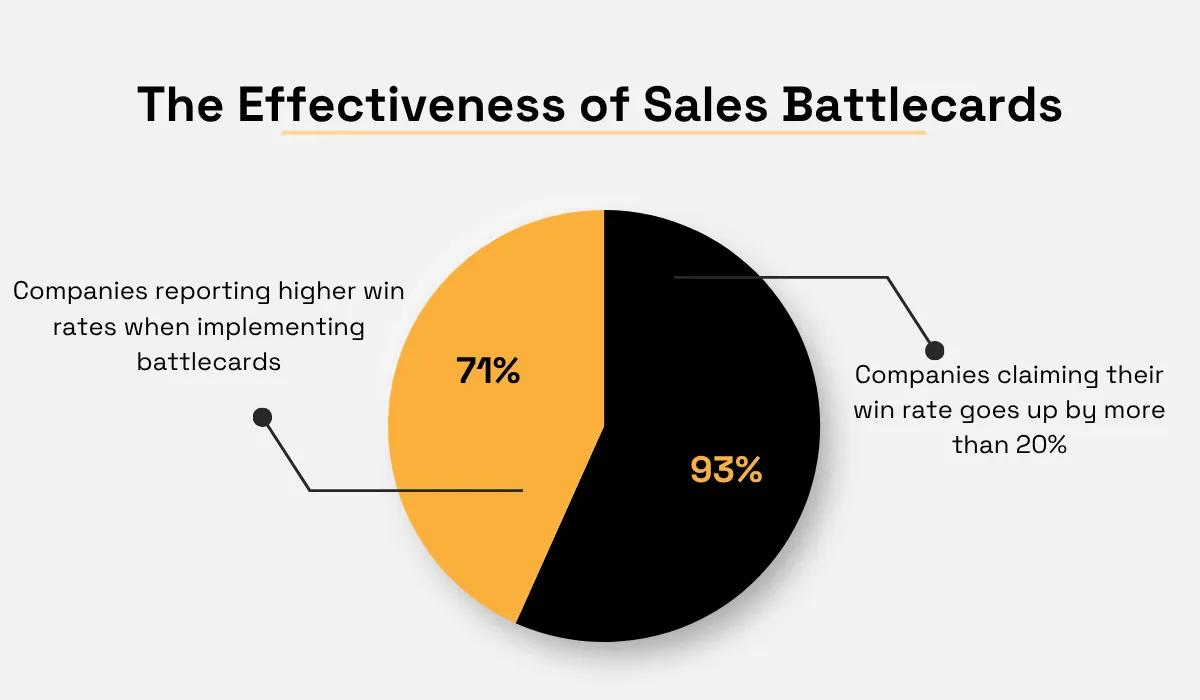
According to Crayon’s research, 71% of companies using sales battlecards report higher win rates, and 93% of those say the lift tops 20%.
Products like Asana or Monday.com are a natural fit for this kind of side-by-side benchmarking.
With the right tools, the kind of analysis that used to take weeks of manual research now takes a fraction of the time.
Perceptual Mapping
Perceptual mapping plots competitors visually, usually on two axes that matter to your buyers, for instance, price vs. feature richness, or ease of use vs. customization.
The result is a quadrant that shows at a glance who’s crowding which space, and where the gaps are.
It’s intuitive to read and easy to share with non-technical stakeholders.
The catch is that it’s built on perception data. If the underlying research is thin, the map just reflects your own assumptions back at you.
In any case, this method will bear the most fruit whenever a perspective shift is in order. For example, when you need to see the market the way a buyer does, or when shaping positioning or messaging.
Stepping outside the usual scope and looking at the landscape differently than your product team does can help you glean super useful insight into the market and identify gaps, niches, or timed opportunity windows.
You can then strategize and structure future actions or product releases around.
One pitfall to avoid pertains to the extent you rely on perceptual mapping, as it shouldn’t stop at just your direct competitors, either.
Going back to the expertise shared by April Dunford, she talks about three kinds of competitive threats:
The Hordes | Similar-looking alternatives |
|---|---|
The Giant | Large, established names and brands that buyers default to |
The Ghosts | The status quo customers stick with |
A map that only plots the obvious rivals misses two of the three.
A perceptual map built with all three categories in view gives you the competitive landscape the way a buyer actually sees it.
That’s the view that shapes messaging and helps you paint a clearer, fuller picture to then, in turn, find an appropriate, guided strategy and push more traffic your way.
Gap Analysis
Somewhat similarly to the previous method, gap analysis flips the lens: instead of comparing feature-for-feature, it hunts for what’s missing across the market; unmet needs no competitor is addressing well.
Customer reviews are the richest source here.
Recurring complaints on G2 or Capterra about a clunky onboarding flow, a missing integration, or unresponsive support are gaps you can act on directly.
The risk is anchoring too hard on today’s market and missing where it’s headed next.
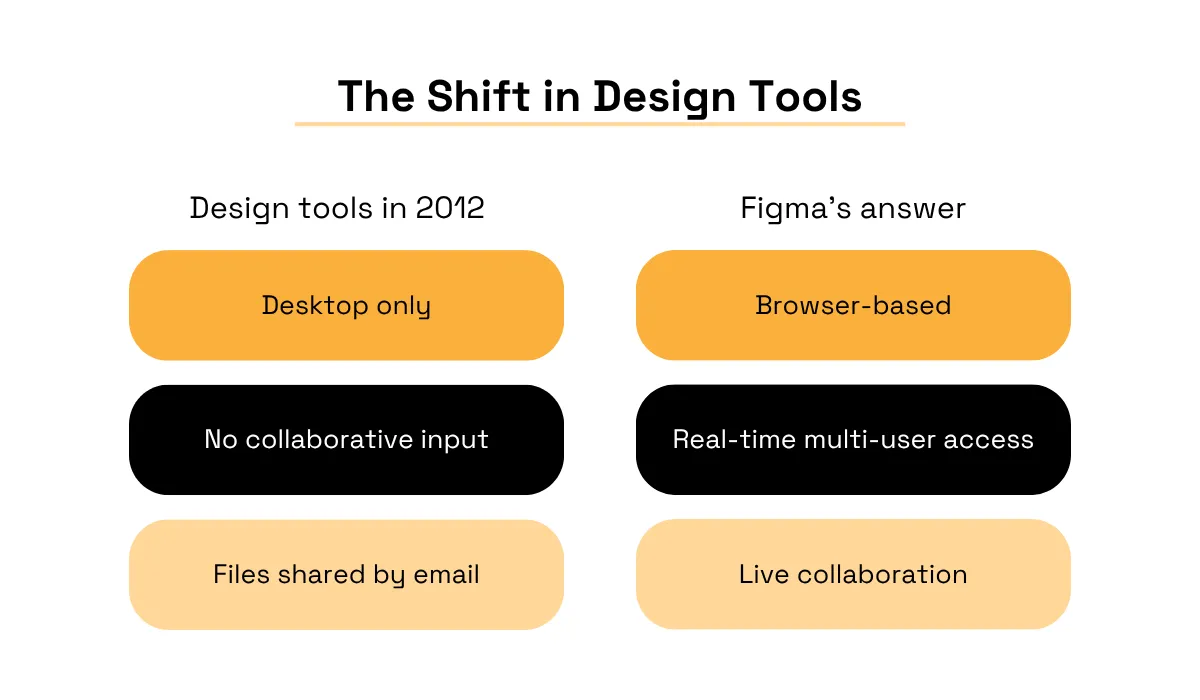
Figma’s founding makes the point cleanly. In 2012, design tools were desktop-based, single-player, and offline. Designers had to save files as v1, v2, v5000, and email them back and forth.
The collaboration problem was hiding in plain sight. As Dylan Field, Figma’s co-founder and CEO, put it:
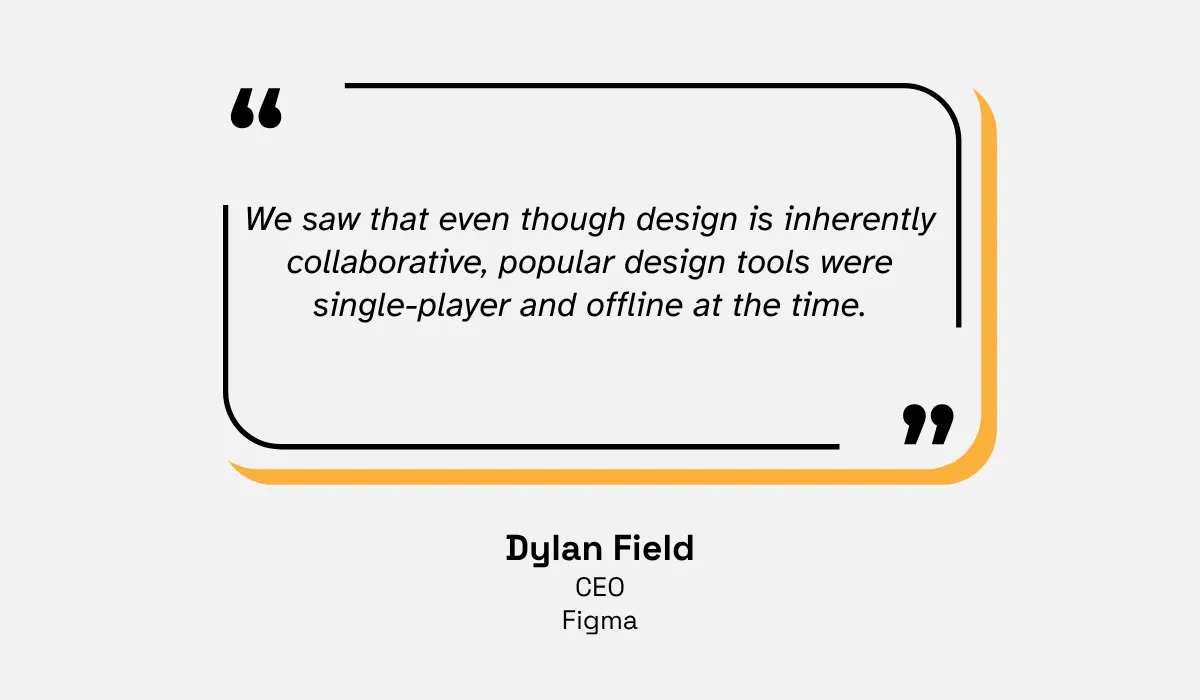
Bear in mind that this is around the time Adobe had just discontinued Fireworks, its web-focused design tool, leaving the market even more exposed.
Field and his co-founder Evan Wallace built directly into that opening. A browser-based, multiplayer design tool modeled on Google Docs that “could take this market where there hasn’t been much innovation for decades.”
Source: Veridion
By 2024, Figma’s 40% market share in design collaboration tools.
That's the real lesson of gap analysis. The most actionable gaps rarely require breakthrough insight.
What they really need is someone willing to look at what’s obviously broken and actually do something about it.
Most SaaS teams have the data to find those gaps. The question is whether they’re looking for them systematically or merely waiting to stumble across them.
How Veridion Helps Teams Stay on Top of Competition
Every framework above runs on the same fuel: accurate, current data about the companies you’re up against. Get that wrong, and even the sharpest framework produces a confident, wrong answer.
That’s the part most teams underestimate.
The problem is that bad competitive data doesn’t announce itself. A stale headcount figure looks exactly like a current one. A competitor you’ve written off as small can raise a Series C six months ago and not register on anyone’s radar.
By the time the strategy starts drifting, the source of the problem is invisible.
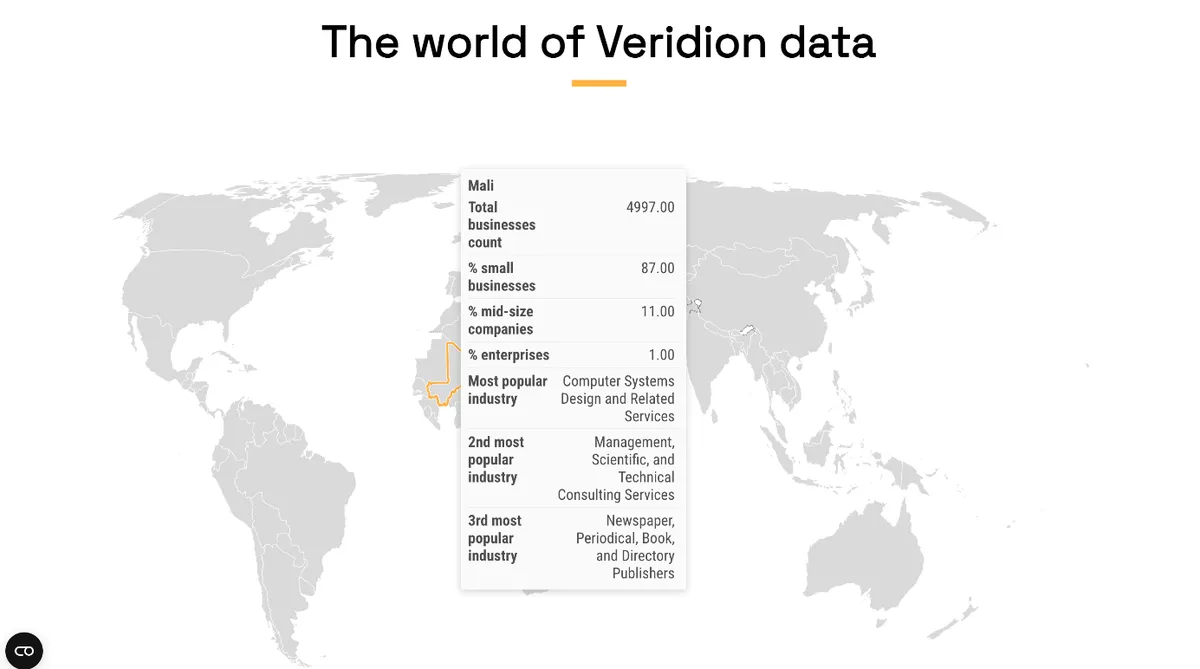
Veridion closes this gap for you by enabling access to curated data from all over the world.
Our AI-driven extraction engine continuously scans public sources, company websites, legal registries, filings, and news across more than 130 million companies globally.
Each use case can be meticulously constructed with your specifications in mind, with over 320 attributes each, refreshed weekly.
Source: Veridion
That includes the segment most competitor research misses entirely: coverage extends to over 90% of SMBs, including digital-first and unregistered businesses that don’t show up in traditional company databases at all.
We won’t build your SWOT for you. But with us, you’ll be sure the inputs are right, which is usually the harder hidden problem.
Conclusion
No single framework tells the whole story.
SWOT gives you speed, Porter’s gives you market structure, a feature matrix gives you precision, perceptual mapping gives you a buyer’s-eye view, and gap analysis gives you your next move.
Most SaaS teams that do this well aren’t running one of these in isolation; they’re combining two or three, pointed at the decision in front of them.
Start with reliable data, choose the lens that fits your decision, and let the analysis lead somewhere; not just to another slide, but to an actual call you’re ready to make.
Articles
Discuss how these trends affect your organization.
Our analysts are available for a short call. Bring a specific question and we will ground it in the data.