Insights / Articles
How to Implement E-Commerce Market Intelligence
Struggling to gain an edge in online sales? Master ecommerce market intelligence to uncover hidden opportunities, and understand your competitors.

- Half of business leaders report significant data-skill gaps in their organizations.
- American customers spent $257.8 billion on e-commerce sites during the 2025 holiday season.
- Market intelligence reports are worthless without any recommendations.
E-commerce markets move fast.
Prices shift, suppliers change capacity, and online demand can swing in a matter of days.
At the same time, competition is compressing margins faster than most procurement teams can react.
So teams cannot rely on slow category reviews anymore.
Those who pull ahead are the ones turning raw market data into specific, timely decisions.
Here is how to build that capability from the ground up.
1. Establish the Objective
Your first step is to define the business problem.
Start here because market intelligence can answer many questions.
It can show you where prices are moving, which suppliers are expanding, which competitors are changing their assortment, and which categories face supply risk.
But if you collect data before defining the question, you create noise.
You end up with reports nobody reads, dashboards nobody acts on, and analysis that arrives too late to matter.
Nobel laureate Herbert A. Simon warns that:
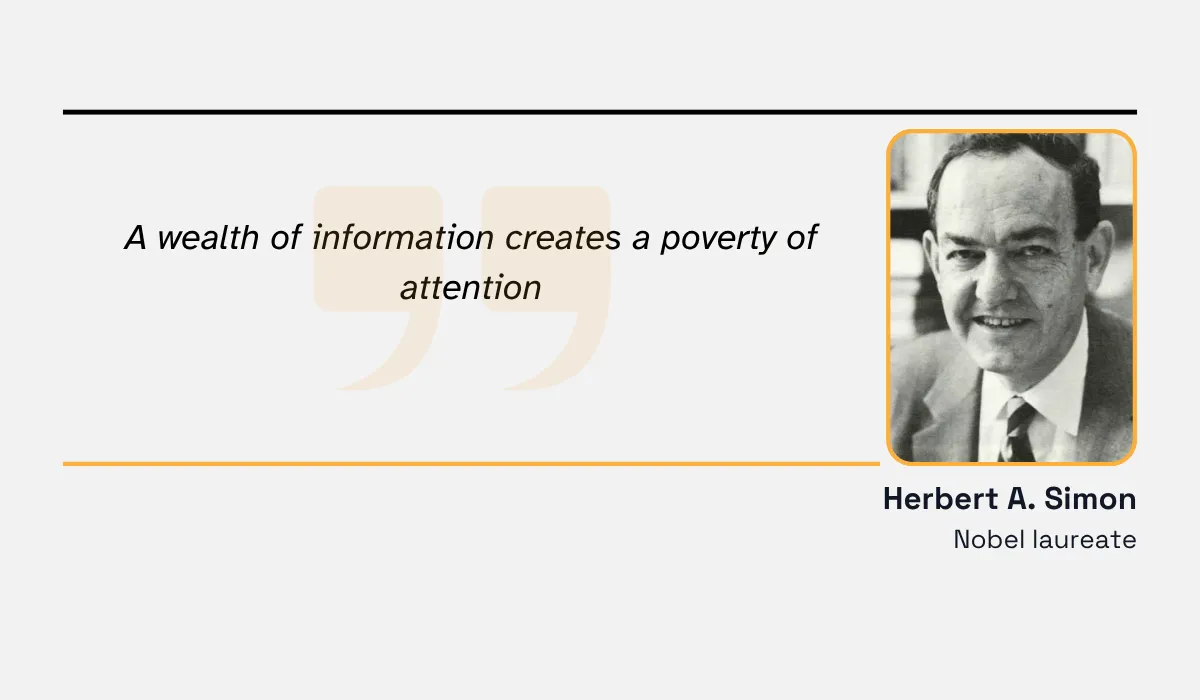
Illustration: Veridion / Quote: Berkeley Economic Review
And that warning is precisely what happens when e-commerce teams gather data without direction.
A weak objective sounds like this:
"We need better market visibility."
But a useful objective sounds like this:
"We need to identify three alternative suppliers for private-label electronics accessories in Europe, compare price movement by SKU family, and flag suppliers with ESG or fulfillment risk before Q4 planning."
That level of detail changes everything.
Your goal moves from vague to SMART (Specific, Measurable, Achievable, Relevant, and Time-bound).
It tells your team which data to collect, which sources to ignore, and which KPIs matter.
This matters because your decisions affect margin, resilience, and working capital.
McKinsey research reveals that less than 20% of available procurement data is actually used to inform decision-making.
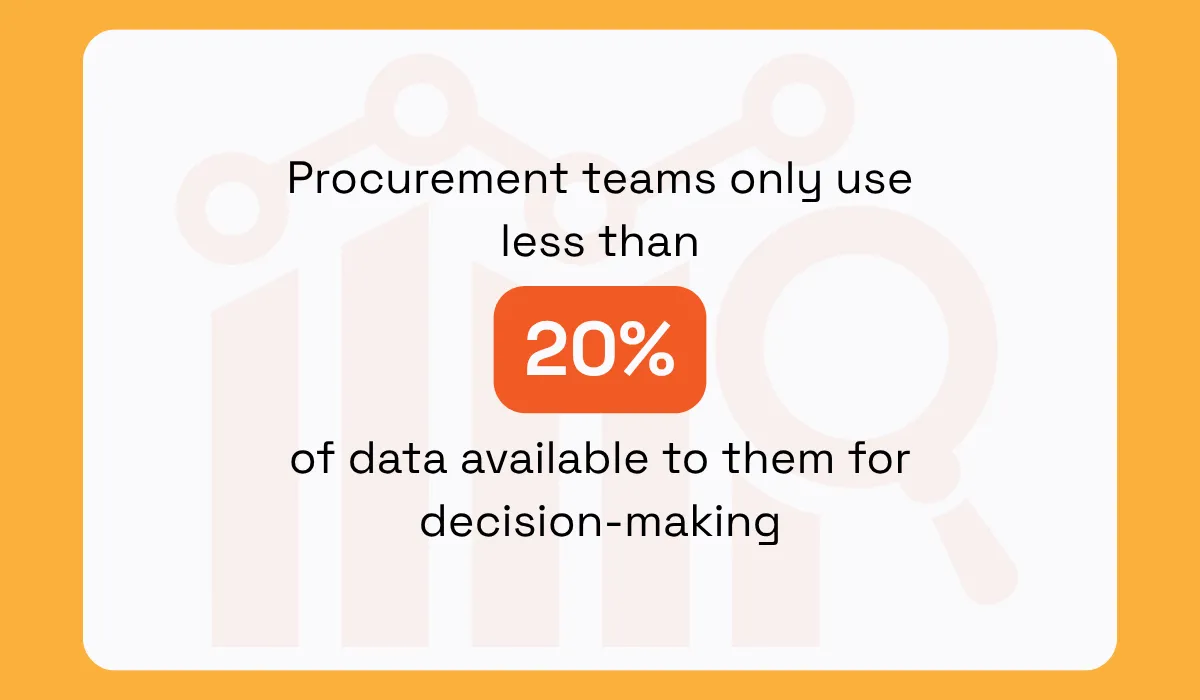
This is exactly what happens when you just gather whatever data you can get without thinking about why you’re doing it.
The pile of unusable information keeps growing, your team gets increasingly overwhelmed, and none of the objectives actually get completed.
The fix is to start with a specific business question.
If your business question is, "Are we overpaying for this category?", your data questions might be:
- What are the current market prices by region?
- Which suppliers offer equivalent products?
- How often do prices change?
- Which suppliers have the capacity and certifications we need?
Then define the output.
For example, your output might be a monthly category risk dashboard, a supplier shortlist, a price movement report, or a recommendation for renegotiation.
Keep it specific.
Each output should support one decision.
Defining the question first determines what data you need, which sources you pursue, and which KPIs you track.
Every step that follows depends on the clarity of this step.
2. Identify Key Data Sources
Once your objective is clear, the next task is mapping where reliable data actually lives.
Split sources into two groups: internal data and external data.
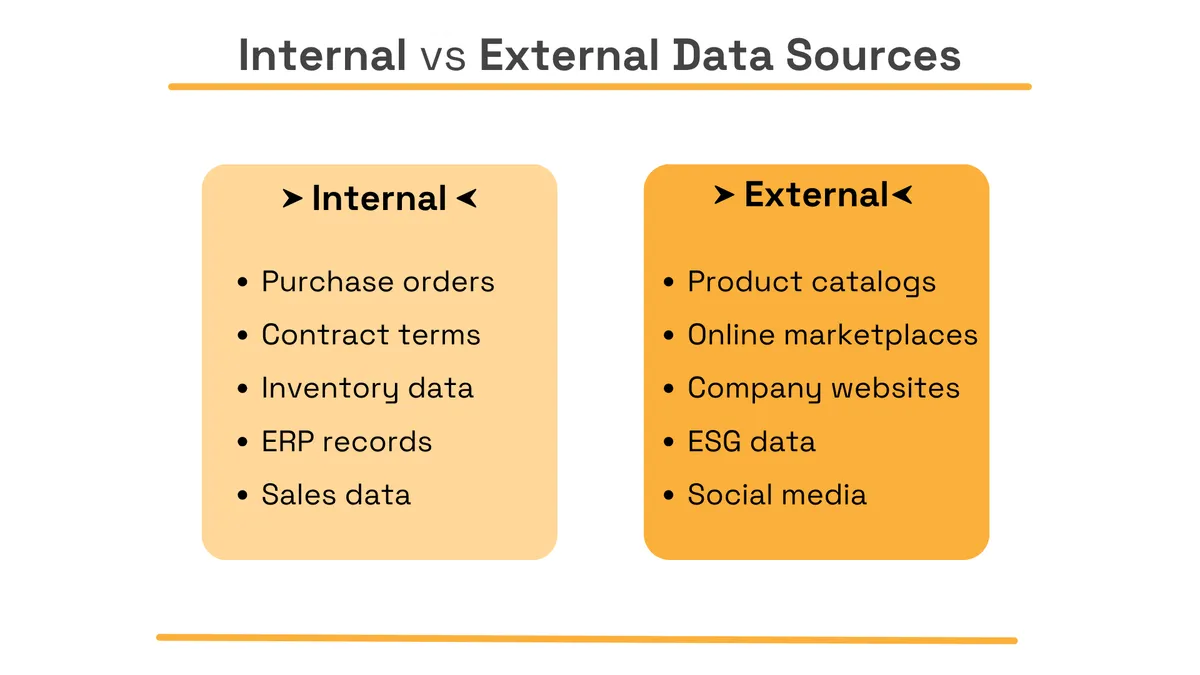
Source: Veridion
Internal data tells you what is happening inside your company and helps you understand your current position.
You can see which suppliers you use, what you pay, where orders fail, and which categories drive the most exposure.
External sources add context. They help you identify alternatives, shifts, and risks before they appear in your internal systems.
Mixing both types gives you a fuller picture and helps you make smarter choices.
But there's a catch.
You need to evaluate each source before you use it, especially when it comes to external data.
The challenge is that external data can be inconsistent, noisy, and extremely time-intensive to collect in-house, especially at scale.
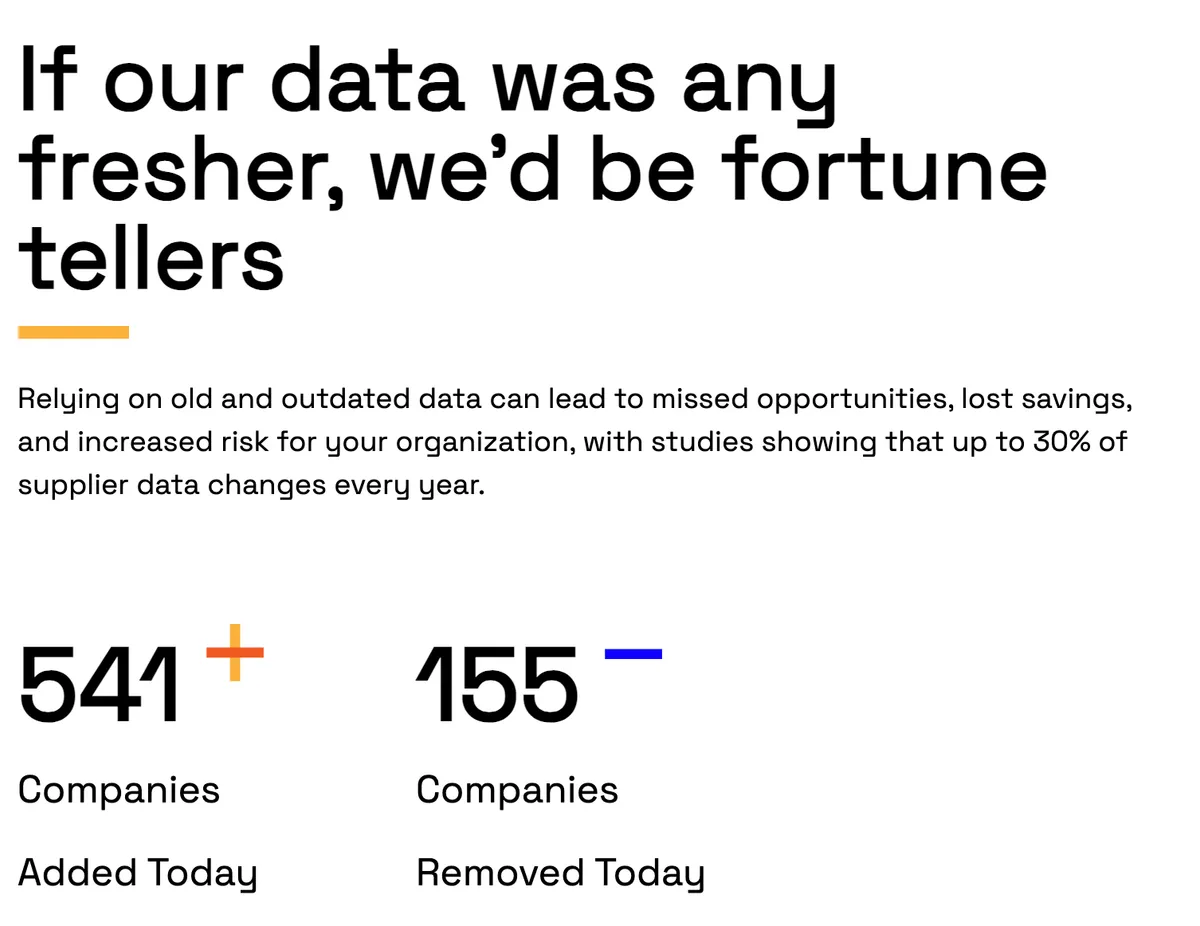
That is where platforms like Veridion become valuable.
Source: Veridion
Veridion is an AI-powered market intelligence platform that tracks over 693M companies globally, with more than 461 attributes per company profile, updated weekly.
For procurement and e-commerce teams, that means access to:
- supplier financial health indicators
- product and service portfolios mapped to UNSPSC and NAICS taxonomies
- ESG scores
- technographic data
- corporate hierarchy structures
- operational footprints
Our platform resolves entity duplication, identifies subsidiaries and brand aliases, and delivers data via APIs, batch files, or custom integrations.
Hence, it integrates directly with your existing BI stack without requiring a system overhaul.
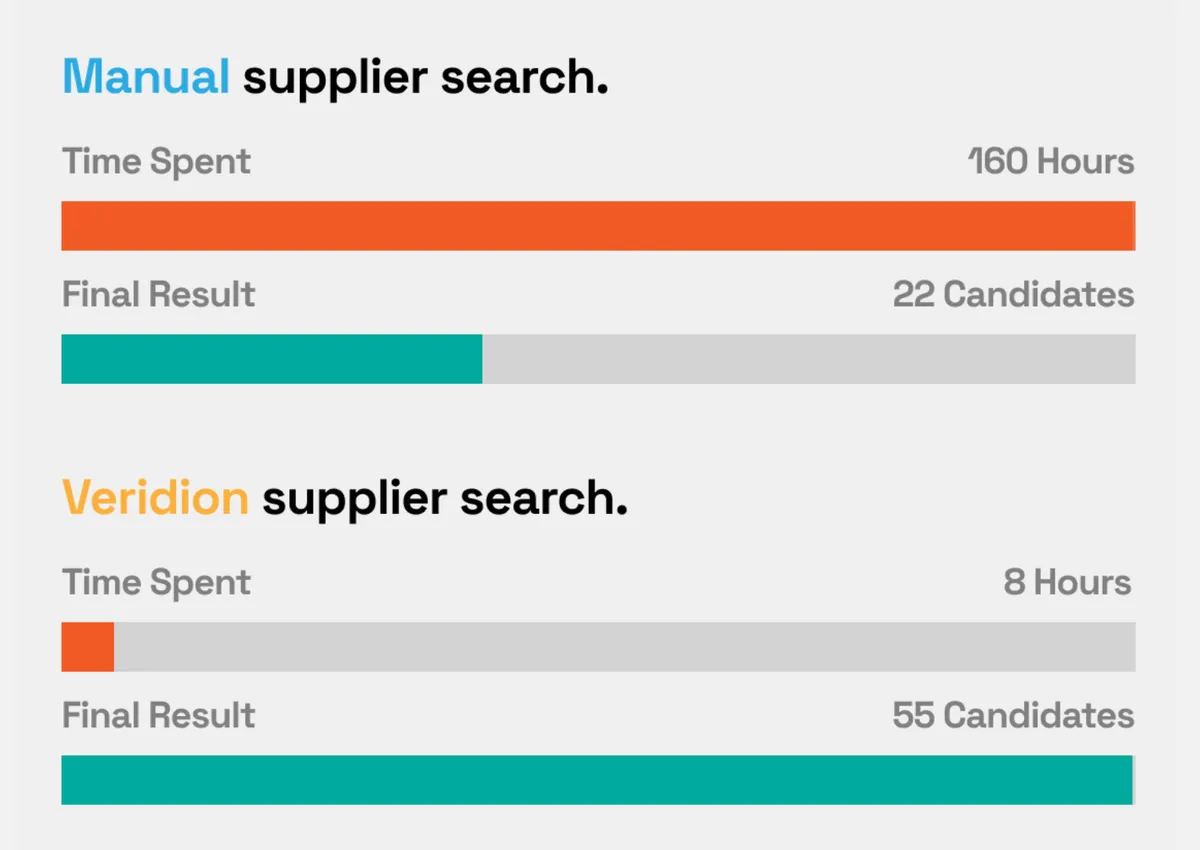
The platform supports competitor monitoring and supplier discovery at a scale that no in-house team could replicate manually.
Source: Veridion
You can query Veridion by product category, geography, or industry classification, and get structured company profiles back in seconds rather than days.
3. Assess Training Needs
Before your team starts analyzing data, check whether they can use it.
This step is where most enterprise teams stumble.
They invest in intelligence platforms, bring in rich datasets, and then find that analysts are unsure how to run segmentations, and stakeholders cannot read the dashboards.
The intelligence exists. The capacity to use it does not.
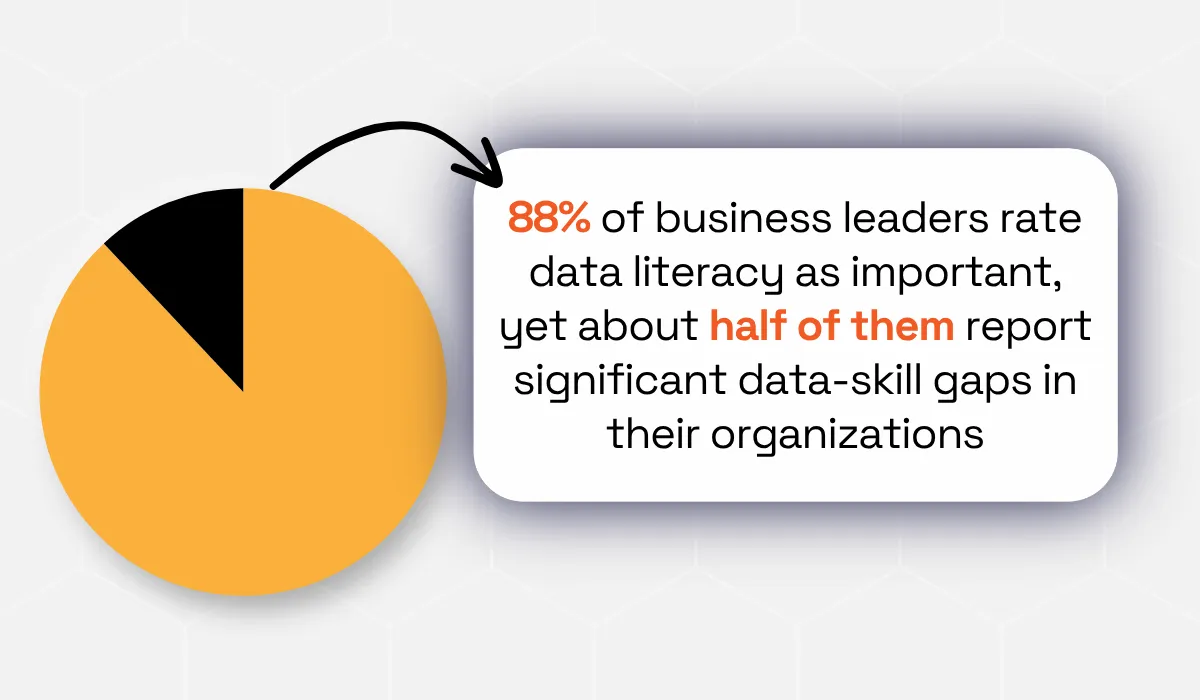
DataCamp's State of Data & AI Literacy Report 2026 found that 88% of business leaders rated data literacy as important or very important, on par with writing and project management.
Yet approximately half of those same leaders reported significant data-skill gaps in their organizations.
Fewer than one in three reported having a mature, organization-wide upskilling program.
Building the platform is only half the job. Building the people to use it is the other half.
So, assess your team before you scale.
Your assessment should answer three questions.
First, can your current analysts segment data, identify trends, and construct a coherent interpretation without external help?
Second, do the business stakeholders receiving intelligence reports understand what they are looking at, and can they challenge the analysis?
Third, is there a process for converting findings into a formal recommendation with defined next steps?
If any of these answers is no, address the gap before you scale data collection.
Start with three groups.
First, category managers. They should know how to analyze price trends, suppliers’ behavior, substitution effects, and shifts in the market.
Train them to ask better questions and challenge outputs.
Second, analysts. They should know how to cleanse data, do segmentation, develop dashboards, and analyze trends.
Train them on data lineage, data quality checks, and visualization.
Third, senior executives. They need to read market intelligence as a decision tool.
That’s right, training needs to be personalized for each role.
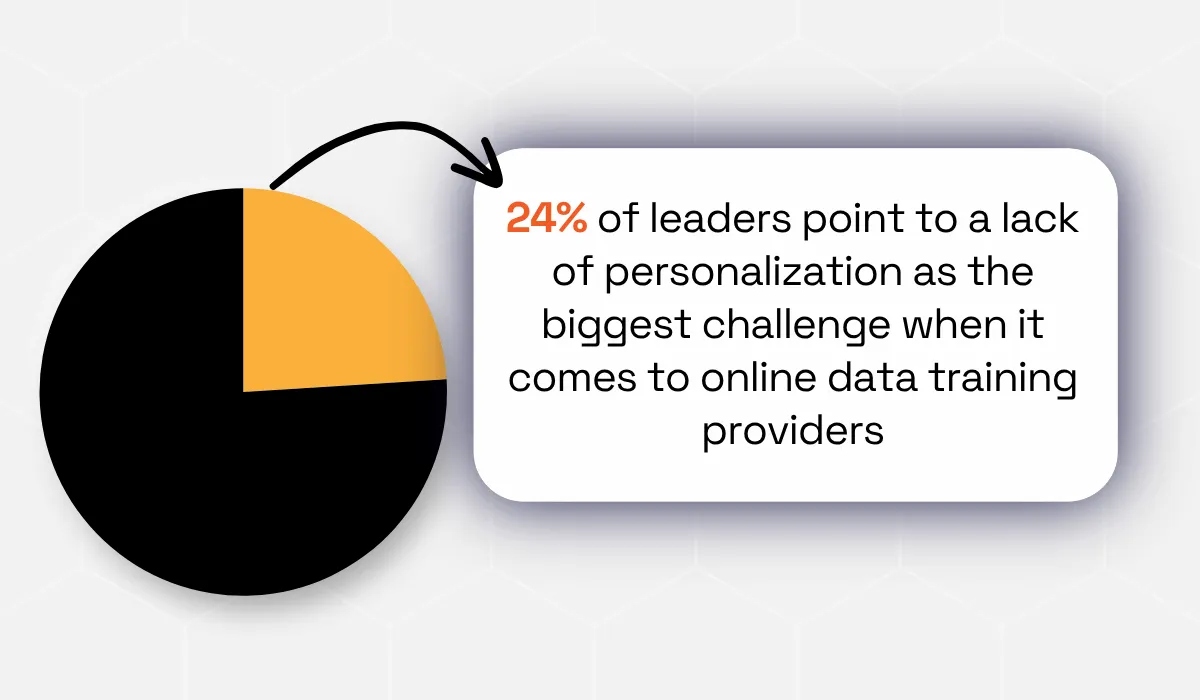
The very same DataCamp research we mentioned earlier shows that many leaders consider a lack of personalization as one of the biggest reasons training fails.
So, make sure you address the needs of everyone who’s going to be interacting with market intelligence.
Remember, you do not always need to hire a full new team.
In many cases, you can upskill current procurement specialists and pair them with analytics support.
But if your organization handles many categories, regions, and suppliers, you may need dedicated market intelligence roles.
4. Analyze the Data
This is the step where data becomes intelligence.
Data collection without analysis is just storage.
At this stage, your goal is to identify threats, opportunities, and decisions.
Do not analyze everything. Focus on the patterns that help your team act.
Start with segmentation.
Group suppliers by:
- category
- geography
- company size
- product capability
- certifications
- pricing range
- fulfillment model
- risk profile
Segmentation matters because the same product does not behave the same way in every market.
It also helps you avoid broad averages that hide important differences.
For instance, a supplier in one region may seem expensive until you consider lead time, compliance requirements, and consistency in deliveries.
Similarly, a cheaper vendor could be risky because of ESG or logistics-related factors.
Segmentation helps you see those trade-offs and prevents you from optimizing for averages that apply to no one in particular.
Next, use trend analysis to spot directional shifts before they become problems.
Note changes in prices, new product launches, signs of growth from the supplier, surges in demand, promotions, and stock status.
E-commerce statistics can help in this case since changes in the online sector usually precede official market reports.
According to Adobe, American customers spent $257.8 billion on e-commerce sites during the 2025 holiday shopping season, which is 6.8% more than last year, while Cyber Week spending was at $44.2 billion, 7.7% more than last year.
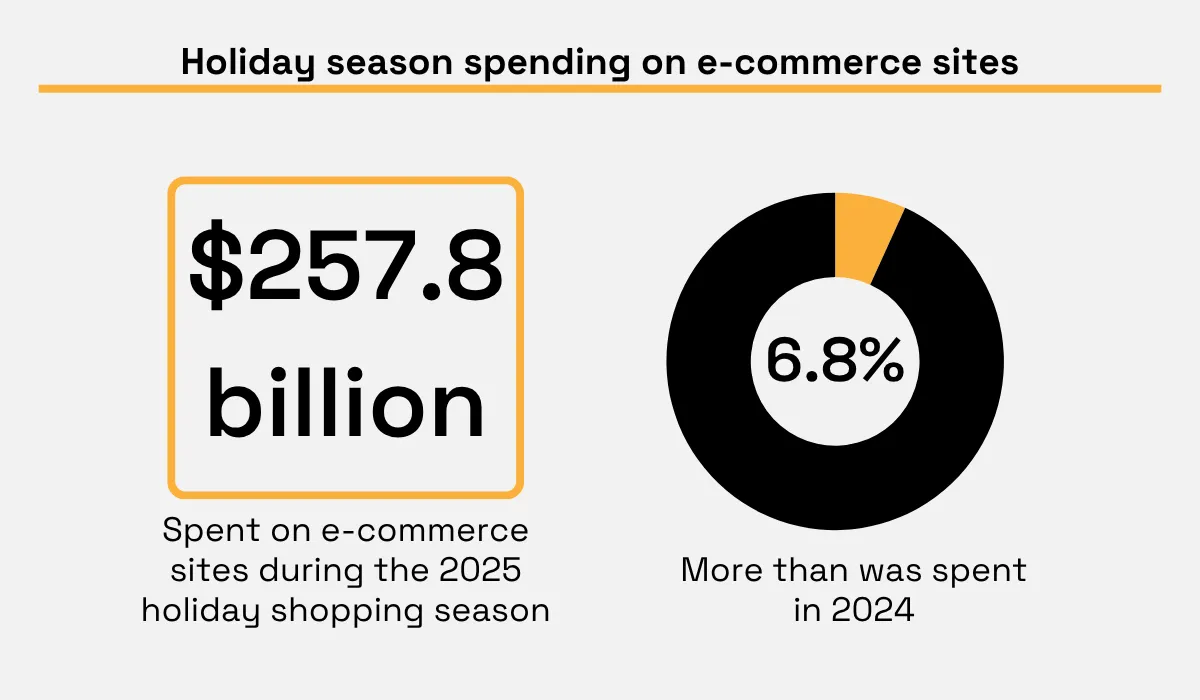
Such shifts affect demand planning, supplier capacity, and negotiation timing.
Then use visualization.
Data visualization is the bridge between analysis and action.
However, your dashboard should make decisions easier. So, it should not display every metric.
Highlight only a few factors:
- price trend
- vendor availability
- category risk
- demand shift
- margin squeeze
- recommendation
It is important to pick the right visualization for the right audience and data type.
Line charts communicate pricing trends over time.
Radar charts compare suppliers across multiple KPIs simultaneously, such as cost, delivery speed, and quality scores.
Bubble charts show multiple dimensions in a single view, for example, supplier size, risk rating, and current contract value in one chart.
The rule is to match the visual to the decision, not to the data.
Finally, apply judgment.
MIT Sloan warns that companies often start with available data rather than the decision they need to make, which can lead them to ask the wrong questions.
Stefano Puntoni, professor of marketing at Erasmus University, puts it clearly:
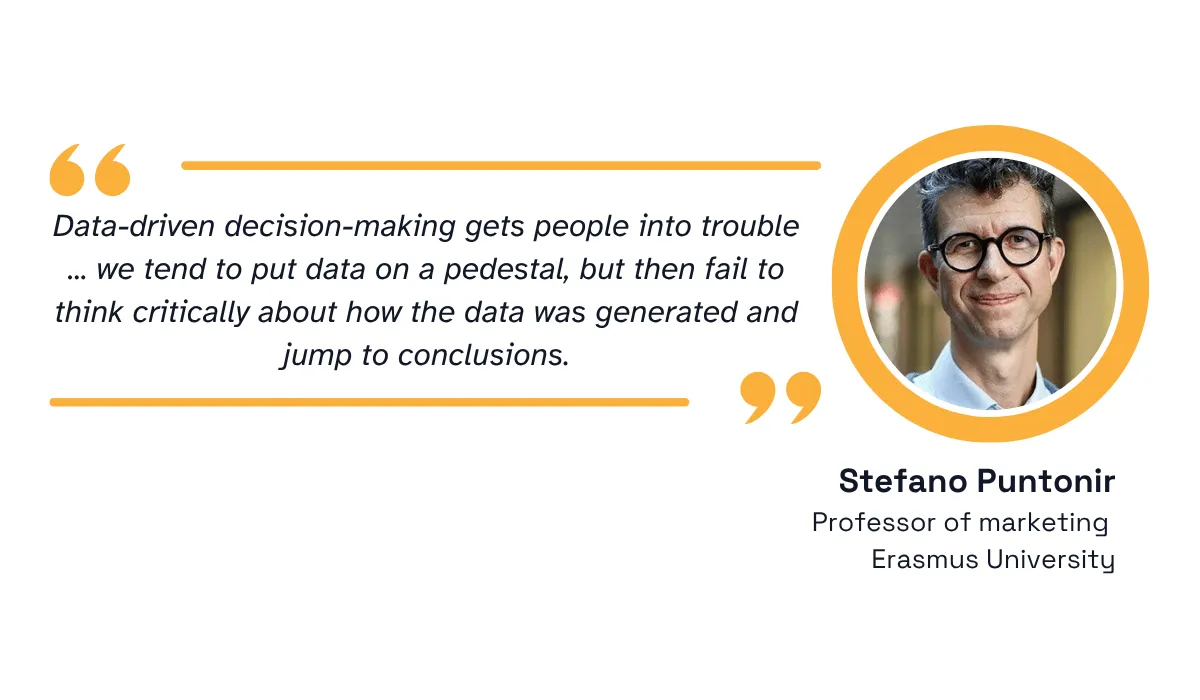
Illustration: Veridion / Quote: Sloan Review
So, do not let the dashboard decide for you. Use it to guide better questions.
5. Develop Actionable Recommendations
The final step is to turn insight into action.
Market intelligence reports are worthless without any recommendations.
It is necessary to provide an action plan that will indicate the actions to be taken, the responsible person for them, the timeline, and metrics.
Data storytelling is the skill that makes this work.
Here's the practical format.
Start with the insight. For example:
"Average listed prices for comparable products rose 8% across key online marketplaces over the past six weeks."
Then explain the implication.
"Our current contracted price remains favorable, but two secondary suppliers show stock constraints. If demand rises, we may lose leverage in Q4."
Then state the action.
"Open renegotiation with the primary supplier now, qualify two backup suppliers, and update the inventory buffer for the top five SKUs."
Then add the expected impact.
"This should protect supply continuity and reduce emergency buying risk."
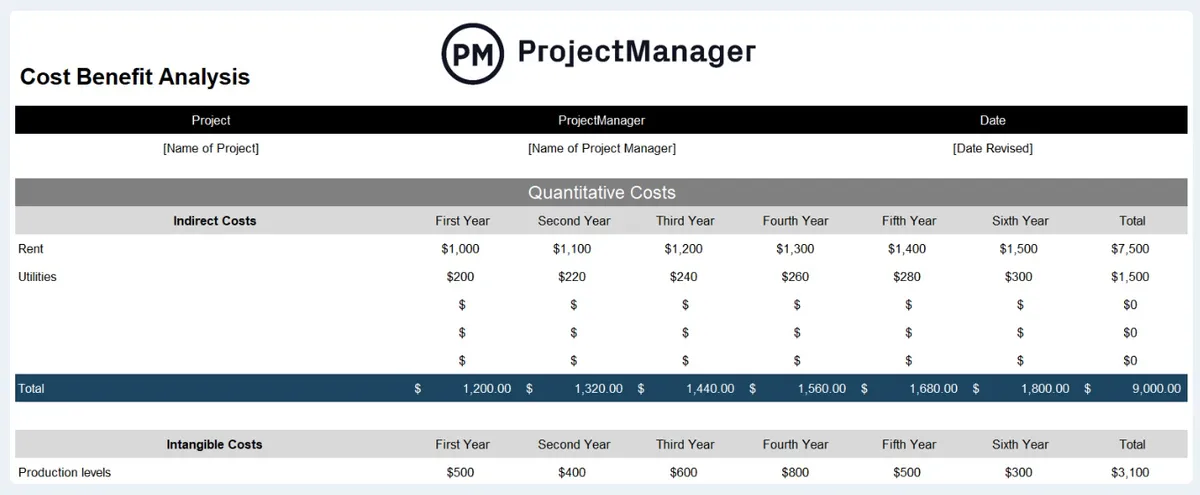
Use cost-benefit analysis for larger recommendations.
Compare the projected value of acting on the recommendation against the implementation cost, transition risk, and the opportunity cost of the required resources.
This is especially relevant for recommendations that involve changing supplier relationships, adjusting inventory strategies, or launching new campaigns.
For example, if switching suppliers saves 4% but increases lead time by 12 days, show that trade-off.
If a campaign could increase demand, show the procurement impact before marketing launches it.
This matters because e-commerce moves across functions.
Pricing, marketing, merchandising, supply chain, and procurement all touch the same market signals.
Your cost-benefit analysis does not need to be elaborate. It needs to be honest.
You can use a cost-benefit analysis template such as the one below to make the process easier.
Source: Project Manager
Also, validate your recommendations before scaling them.
You can do that using A/B testing where possible.
Test a price change in one region. Pilot a new supplier in one category.
Run a limited campaign before adjusting inventory across all markets.
If you cannot test directly, run scenario models.
Finally, build a feedback loop.
After each recommendation, track what happened.
Did supplier performance improve? Did costs fall? Did stockouts decline? Did your forecast become more accurate?
Feed that result back into your data model and decision process.
The goal is simple. Your market intelligence process should help your team act sooner, negotiate with better evidence, and reduce avoidable risk.
The measure of good market intelligence is not the quality of the analysis.
It is the quality of the decisions that follow.
Conclusion
E-commerce market intelligence can do wonders for your business. If done right.
When your team sets the right objective, you collect the right data.
When you collect the right data and have the skills to analyze it, your insights are sharper.
When your insights are sharper, and you communicate them well, your decisions are faster and better than your competitors' decisions.
That process, repeated consistently, is what separates procurement teams that react to markets from those that shape their response before market conditions force their hand.
Articles
Discuss how these trends affect your organization.
Our analysts are available for a short call. Bring a specific question and we will ground it in the data.
Insights
Keep reading
More analysis, research, and outcomes grounded in live company intelligence.
How to Gather Market Intelligence In 5 Steps
In this guide, we're breaking down the five key steps you need to take to gather market intelligence that drives real action.
5 Types of Market Intelligence You Need to Know About
Explore five different types of market intelligence that can shape your competitive edge. Find out which ones your team should prioritize.
How Is AI Revolutionizing Market Intelligence?
Explore the key ways AI is transforming market intelligence workflows and helping businesses stay ahead of the competition.