Insights / Articles
7 Firmographic Attributes to Weight in Your Account Scoring (and How Much Each One Matters)
Tired of inaccurate account scoring? Discover which firmographic data providers offer the 7 crucial attributes that truly matter.

- Employee count and industry anchor a weighting model.
- NAICS codes are accurate only 73% of the time in the first year after registration.
- No firmographic attribute can serve you continually if you only weight it one time.
Not every firmographic attribute deserves the same weight.
Most scoring models treat them as roughly interchangeable. A few points here, a few there, distributed by whoever built the model once and never recalibrated later.
A haphazardly weighted model will send you after leads that score but shouldn’t while omitting real diamonds in the rough. Without sufficient thought put into attribute weight and selection, the underlying logic renders your scoring useless.
This guide covers seven attributes worth scoring on, and how much weight each should carry for your model to routinely generate valuable leads.
1. Employee Count
Employee count is the attribute most B2B scoring models lean on hardest, and for good reason. It does two jobs at once.
The first is budget. Headcount typically scales with spend, so a company’s size tells you roughly what it can afford before you know anything about its finances.
The second is buying complexity, and thus, the overall length of the process.
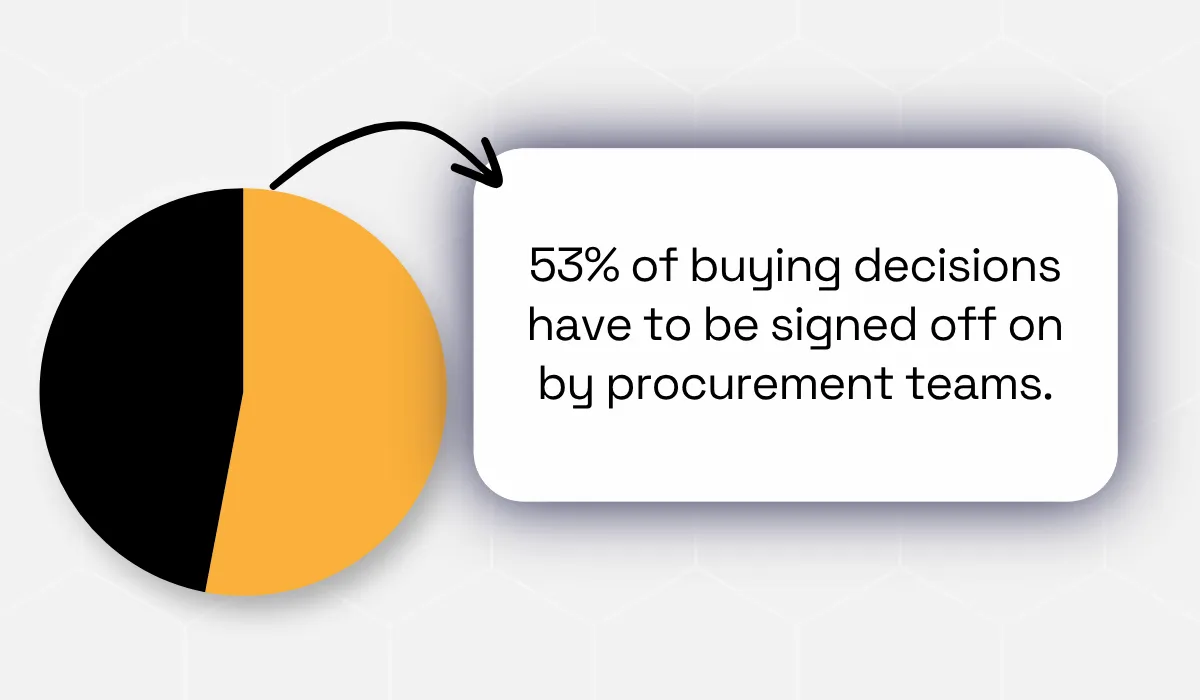
Forrester’s 2026 State of Business Buying report puts the typical B2B purchase decision as including 13 internal stakeholders plus nine external influencers. According to the research agency’s data, procurement teams have risen in importance, and now, they are thedecision-maker in 53% of buying cycles, while also being the most frequent POC in the buying process.
That complexity scales with headcount. Influ2, an Account-Based Marketing platform, surveyed enterprise and mid-market buyers. In the survey, 50% of respondents reported buying groups of just two to four people, but every respondent with a group of ten or more came from a company with over 1,000 employees.
So, employee count can actually reliably predict how many stakeholders will be present in the decision-making process, and thus, how long the close might take.
You should always treat the number with caution, though. A headcount pulled when a lead entered your pipeline says nothing about a business’s direction, which can change radically and fast.
Veridion's data is built to track employee count as one of over 461 attributes per company, refreshed weekly. That means the band you’re scoring against always reflects the company in its current state rather than scraping old, out-of-date forms and reports.
2. Industry Vertical
If employee count tells you whether a company can buy, industry tells you whether it should.
A perfect headcount match in a sector your product doesn’t serve is still a bad account. That’s why industry sits alongside company size at the top of the model.
However, this importance is sabotaged by one simple fact: readily available information about a company’s scope of activity is often barely trustworthy.
Standard Industrial Classification (SIC) and North American Industry Classification System (NAICS) codes are self-reported, and there’s no penalty for getting them wrong. Using them as your North Star could lead you astray, fast.
A peer-reviewed study in Statistics and Public Policy puts it bluntly: because codes are self-reported on tax forms and consequences are often non-existent, their usability can be hit-and-miss.
According to relativity6, a data science platform, NAICS submissions are right only 73% of the time, but that’s just in the first year post-registration.
Across the pond, another data science provider, The Data City, found roughly 740,000 companies (about 15% of the total) in the UK sit in “not elsewhere classified” buckets that describe nothing specific at all.
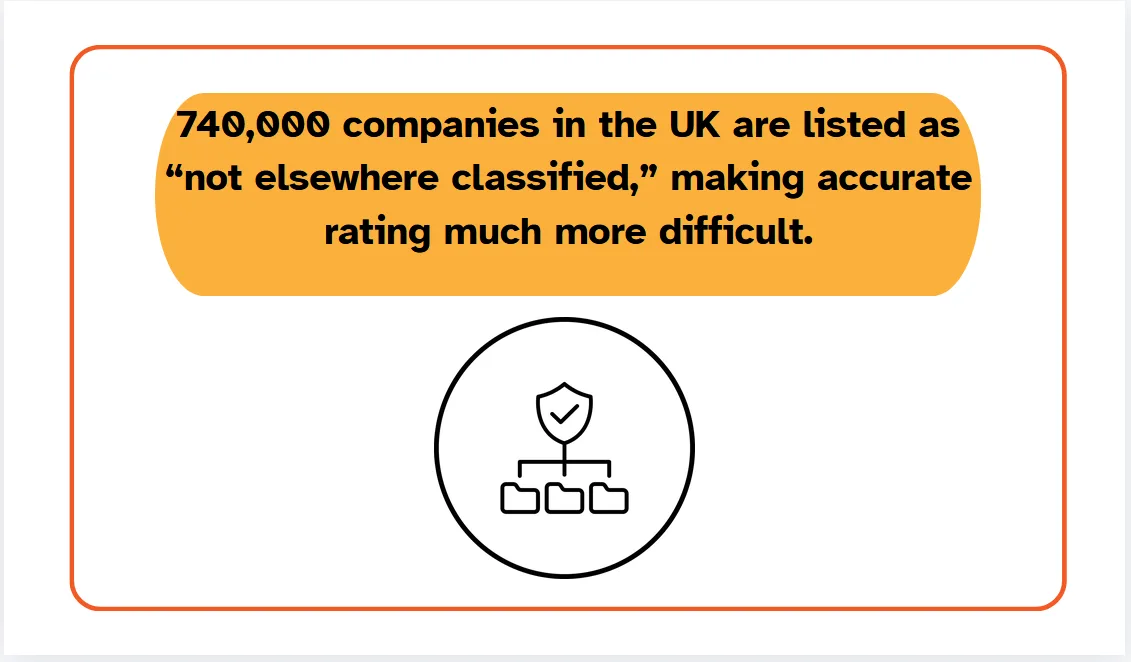
Illustration: Veridion / Data: The Data City
In practice, this coarseness means your model runs into ambiguity all too frequently. If you sell HVAC software and all you have is a sea of companies labeled only as “Contractors,” they all score identically – plumbers and roofers included, none of whom will ever buy.
To counteract this drift and properly match and enrich your data, Veridion classifies companies into roughly 120 industries and 584 business categories from activity-based signals, rather than relying on information submitted in a registry long ago.
3. Revenue Band
We previously mentioned how headcount correlates with budget. Rather than guessing, revenue answers the question of “can this company actually afford you?” directly.
Here, again, these two attributes are almost always weighted together rather than treated as independent signals.
The reason they need each other is that the ratio between them shifts around constantly. Investment company SaaS Capital’s 2025 survey, covering more than 1,000 private SaaS companies, put median revenue per employee at $129,724.
Similarly, market research conducted by Benchmarkit indexed 134 public SaaS firms and put the public median at roughly $395,000, which is three times higher, despite the industry being the same.
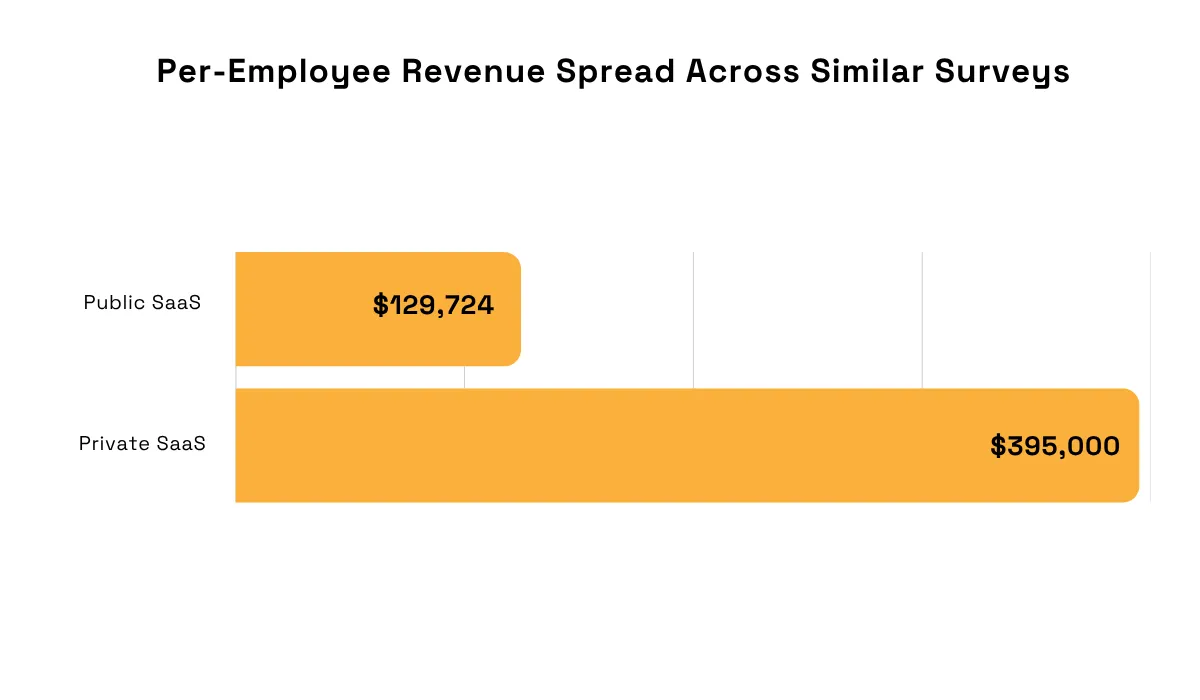
Illustration: Veridion / Data: SaaS Capital and Benchmarkit
This clearly shows that simply inferring revenue from headcount without concrete data means you can be wrong by an order of magnitude.
And even when you find revenue data, it may not be trustworthy enough to score on across the board.
While public companies file audited quarterly figures because they’re required to, private companies don’t share that burden. AI sales platform Apollo analyzed B2B data accuracy and laid out the tiers plainly. To nobody’s surprise, public companies score highest, and private SMBs sit at the very bottom.
You’re left to estimate revenue based on the questionable reliability of proxy signals that are only partially related.
And then, you end up in a situation where two databases list the same company at $15M and $40M. Which one is right?
To answer that question, you need disambiguation. Veridion handles this by supplementing disclosed financials with modeled revenue estimates for private companies, enriching the data and filling the field where most providers simply return blank.
4. Growth Rate
The first three attributes we’ve covered so far tell you whether a company fits the ideal customer profile tag. Its growth rate provides an indicator of readiness and momentum.
Mature businesses may be less inclined to do deals with you, as they’ve been on the market long enough to secure stable relationships with vendors, software providers, and so on. Conversely, fresher entities who are still spreading their wings, posting staggering quarterly numbers, and actively expanding will be more likely to buy from you.
Thus, the data supports treating growth rate as a top-tier signal. Technographic data platform Bloomberry analyzed one million B2B software purchases across companies with 200–1000 employees and ranked buying signals by purchase lift.
Companies that had recent headcount growth of 20% or more made 38% more software purchases, behind only AI tool adoption, and ahead of VP-level hires and recent funding rounds.
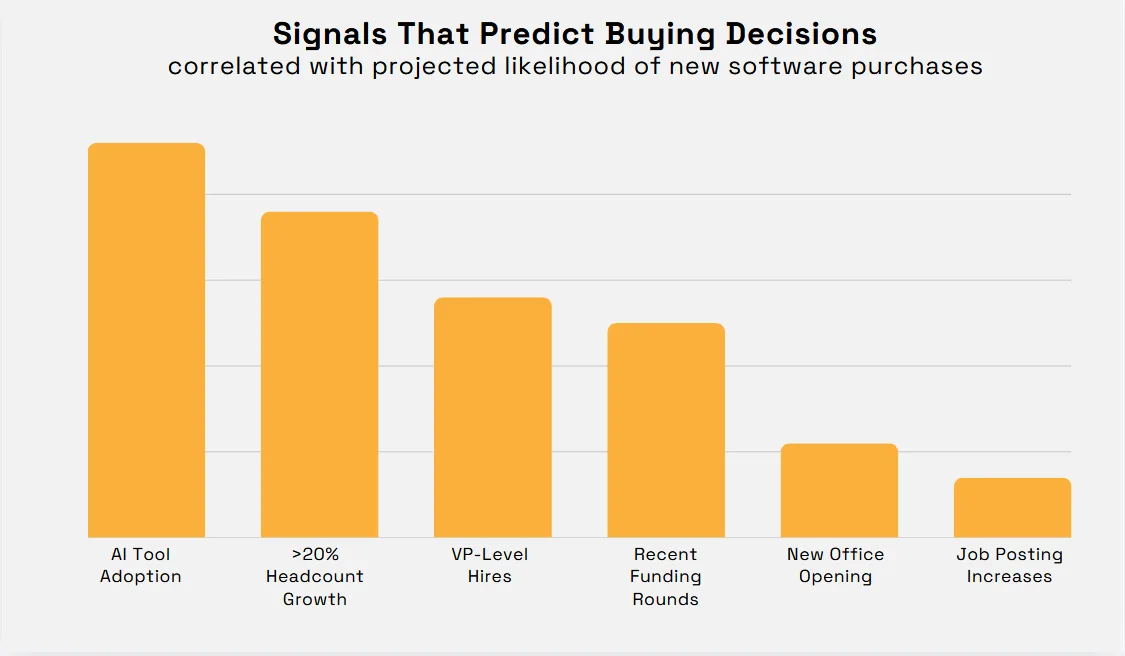
Illustration: Veridion / Data: Bloomberry
However, don’t make the mistake of taking a snapshot of growth and running with it. The rate at which a company develops is meaningful relative to a timeframe, and the window you pick changes what you see:
Quarterly | Mostly noise. Seasonal hiring, a single large onboarding cohort, or one restructuring can swing the number without indicating anything. |
|---|---|
Six-month | Enough to distinguish a genuine trend from a blip, and short enough to still be actionable. |
Twelve-month or year-over-year | The standard for scoring models. Smooths seasonality and captures direction rather than fluctuation. |
Two-year | Useful context for determining a company’s development stage, but too slow to signal timing. |
Keep in mind: what matters within any window isn’t raw volume but deviation from a company’s baseline. A five-person hiring spurt means something very different at a 40-person company than at a 4000-person one.
Whichever timeframe you pick, a single snapshot won’t render a reliable picture. Veridion tracks headcount and operational trends as part of its structured attribute set, so what you’re scoring is a trajectory rather than one number pulled on one day.
5. Funding Stage
A cash injection, as you may imagine, is usually followed by spending.
It stands to reason, then, that a company which passed a fresh round of investing three months ago is on the cusp of allocating its budget with a board of execs expecting visible expansion.
Bloomberry’s analysis from earlier confirms this – note the 25% lift in software purchases for companies that obtained recent funding.
But it’s not a signal that is always reliable in a vacuum.
First, consider that mature or bootstrapped companies won’t be as eager to spend as those who just entered the venture funding.
Second, there are industries where the signal barely exists at all. Venture capital concentrates overwhelmingly in a handful of sectors, like SaaS, biotech, fintech and hardware. Construction, logistics, professional services, or hospitality are virtually nowhere to be seen.
And finally: coverage remains a problem.
The overwhelming majority of companies simply never raise anything meaningful. Kauffman Foundation, a grantmaking organization, surveyed 479 Inc. 5000 companies and found just 6.5% had raised venture capital, while 7.7% had raised from angels.
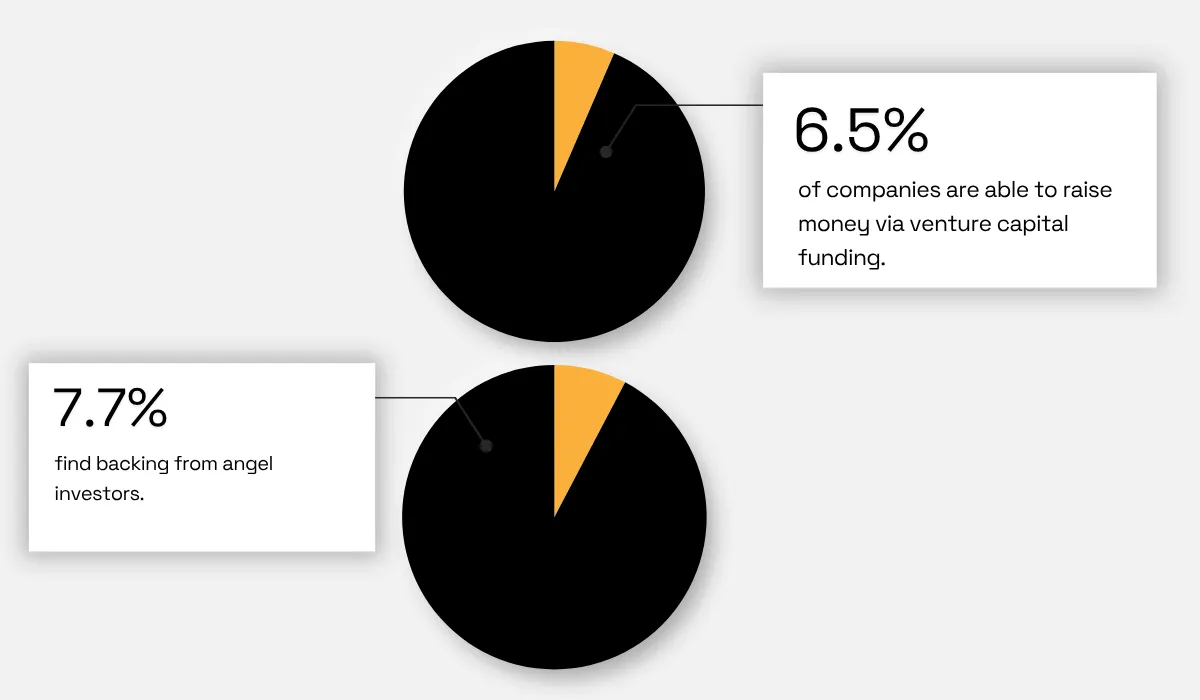
Illustration: Veridion / Source: Kauffman Foundation
Aside from that, the most common sources were personal savings, bank loans, and friends and family.
If even high-growth private companies are overwhelmingly unfunded, a scoring model that weights funding stage heavily is scoring a field that’s going to be predominantly empty.
And then it’s also likely to penalize and downrank small, family-owned manufacturers and established professional services firms that are profitable, but never reach for outside capital.
The takeaway here (and the reason why this is merely number five on our list) is that this is much more of a proxy attribute than one that you can take at face value.
To offset the bias funding triggers in weighting models, Veridion tracks funding activity as one of over 461 structured attributes, so it sits alongside the rest of the firmographic picture, allowing you to count it when it's relevant and ignore it when it isn't.
6. Geographic Proximity
Geography sits a tier below size and industry in most scoring frameworks, and the reason is structural.
Where a company operates rarely determines whether it needs your product. It isn't a demand driver.
But it does decide two things that a scoring model has to get right anyway, and both need far more precision than a medium weighting implies.
The first is routing. A country-level field can’t always accurately assign an account to anyone. “United States” doesn't narrow down to region or state level, and so the lead sits unassigned or lands with a rep who hasn’t got enough information to chase it down.
The second is compliance. If your product touches personal data, different regulations apply in different regions, which is exactly where a country-level field falls apart.
Sticking with the example, “United States” is not one regulatory environment. Bloomberg Law notes that 20 states have enforceable comprehensive privacy laws, with thresholds that vary enormously:
- Rhode Island: Companies that handle data of 35,000 residents or more, no cure period, penalties up to $10,000 per violation.
- Virginia and Connecticut: 100,000 consumers.
- California: 100,000 residents or $25 million in revenue.
- Delaware, Montana, Nevada: No minimum at all.
These are just some examples, but they clearly show the problem. Flagging a prospect “US” just isn’t enough.
Headquarters isn’t the same as operations, either. A company registered in one state may routinely run facilities, staff, and data across several others. For compliance-sensitive sales, all jurisdictions matter.
Veridion maps HQ and branch-level geographies down to the city level, so you see the full scope of jurisdictions a company touches.
7. Tech Stack Overlap
A prospect already running tools that integrate with yours faces less migration work, fewer internal objections, and a shorter path to seeing value. When their tech stack overlaps with what you’re selling by a decent margin, going with your product over a competitor’s might produce meaningful upside.
As a predictor, it’s a more specialized signal than the attributes above, but where it applies, it’s powerful.
The mechanism is straightforward. Most B2B products can’t demonstrate value until customer data is inside them. At the same time, a company’s data will be spread across different elements of their stack, like their CRM, billing tools, support platforms, and so on.
However, if the integration already exists, that data flows in during setup, saving immeasurable time.
Otherwise, value gets delayed, and churn probability rises. Extended implementation timelines increase the probability of early churn, which makes stack overlap a signal about deal quality, not just deal likelihood.
Returning to Bloomberry’s findings again, tech companies of 500–1000 employees that had recently adopted an enterprise AI tool went on to make 46% more software purchases than those that hadn’t. That’s the strongest signal in the study.
As Henley Wing Chiu, CTO at Bloomberry, put it:
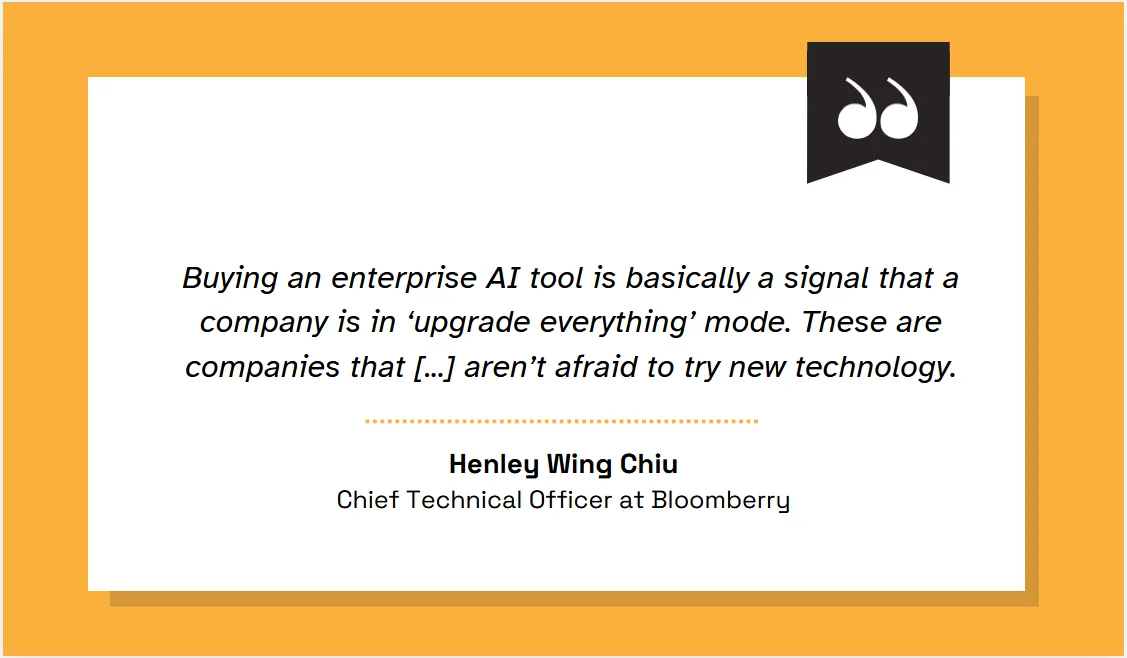
Illustration: Veridion / Quote: Bloomberry
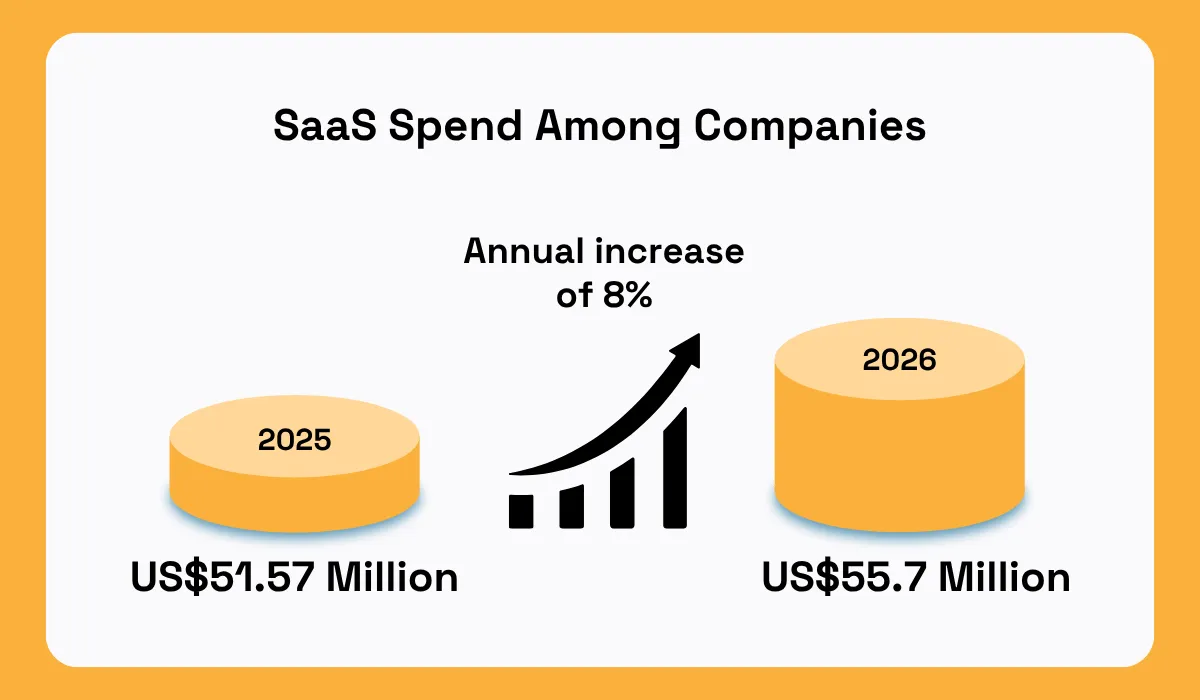
A company that just bought something is a company in buying mode, and the numerical data behind this predictor is strong. SaaS management platform Zylo reports that companies spend $55.7 million on SaaS applications, up 8% YoY.
Don’t discount churn here, though. Tech stacks and solution preferences can change rapidly, so this signal is by no means static. Operating on a stale report can completely distort your idea of a given company’s tech stack.
Veridion’s data includes technographic signals in its structured profiles with a weekly refresh, so what you’re scoring is always the current stack.
Conclusion
So, there you go: seven attributes, each requiring a different type of consideration on account of the unequal weight they carry.
What they do share is a dependency on freshness. They’re only as good as the day they were last verified.
Get the weighting right while keeping the data fresh, and you’ll end up with a model that ranks well indefinitely, not just once after you initially feed it information.
Articles
Discuss how these trends affect your organization.
Our analysts are available for a short call. Bring a specific question and we will ground it in the data.
Insights
Keep reading
More analysis, research, and outcomes grounded in live company intelligence.
What Are the Benefits of Data Enrichment?
Want to understand the benefits of data enrichment? This guide will explain how enriched data supports better decisions and analytics.
A Closer Look at the Top B2B Data Enrichment Companies Businesses Rely On
Struggling to find reliable firmographic data providers? Uncover the top B2B data enrichment companies that businesses trust to fuel growth.
Which Online Business Data Providers Stand Out in Today's Market?
This article will highlight online business data providers that businesses trust for accurate company information and actionable insights.