Insights / Articles
Auditing Supply Chain Scope 3 Emissions Without Surveying Suppliers
Looking into auditing Scope 3 emissions? This guide will explain how companies can assess supply chain emissions without relying on supplier surveys.

- Nearly a third of suppliers provide no emissions data to customers.
- A supplier can be matched to the wrong company even when the match looks correct.
- Suppliers representing 50% of procurement spend account for 75% of supplier-related emissions.
You may need emissions data from hundreds of suppliers to build your Scope 3 inventory.
However, collecting that data from every supplier can be difficult.
Some suppliers may not have the data you need, while others may not respond to your requests. This can leave gaps in your inventory and make it harder to measure your supply chain emissions.
In this guide, you'll learn how to build a supplier-level Scope 3 dataset without surveying every supplier.
Map Your Supply Chain to Real Entities
Before you add a supplier’s emissions data to your inventory, make sure you have identified the right company.
Resolve Suppliers to Their Ultimate Parent
A supplier may use a trading name or share details with another company. So if you match that supplier to the wrong company, you could end up using emissions data that belong to a different business.
This can happen when supplier records contain duplicate or conflicting information. In fact, a 2024 examination by the Office of the Auditor General of Western Australia found duplicate supplier names, business numbers, bank details, and contact information across supplier master files.
That is why you should check the supplier’s name and identifier against a trusted external source before searching for its emissions data.
But even after you identify the right company, you may need to look at its corporate structure to find where its emissions are reported. This is because the supplier could be part of a larger corporate group, with emissions reported by a parent company instead.
GLEIF’s Level 2 data can help you trace the supplier to its direct and ultimate parent. So if the supplier doesn’t publish its own emissions data, you can then check whether its parent has reported the figures.
However, the parent’s disclosure still needs to match the activity you are accounting for.
A parent company may report emissions for its entire group while you are accounting for goods or services purchased from one supplier.
So when you use a parent company’s disclosure, check what the figure covers and the period it represents. If it covers the wider group, make sure the supplier’s activity is included.
Once the supplier, its parent, and the disclosure all match the activity you purchased, you have a solid basis for using that emissions data in your Scope 3 inventory.
Fix Gaps From Poor Entity Matching
You can match a supplier to the wrong company without realizing it.
For example, a supplier can share a name, address, or other details with another business in the same corporate group. This can make it difficult to tell which company the supplier record belongs to.
And if that company also has emissions data, you may have no obvious sign that you linked the supplier to the wrong business.
In fact, a 2024 study of company-data linkage by the ifo Institute, a German economic think tank, found that false positives were almost exclusively cases where researchers matched a company to a related entity within the same corporate group.
The same type of mistake can affect your Scope 3 data.
The company you matched may be real and belong to the same group, yet still be different from the company that supplied the goods or services.
So if you use that company’s emissions data, you could attach the wrong emissions figure to the supplier.
This also explains why the supplier name alone may not be enough to establish the match.
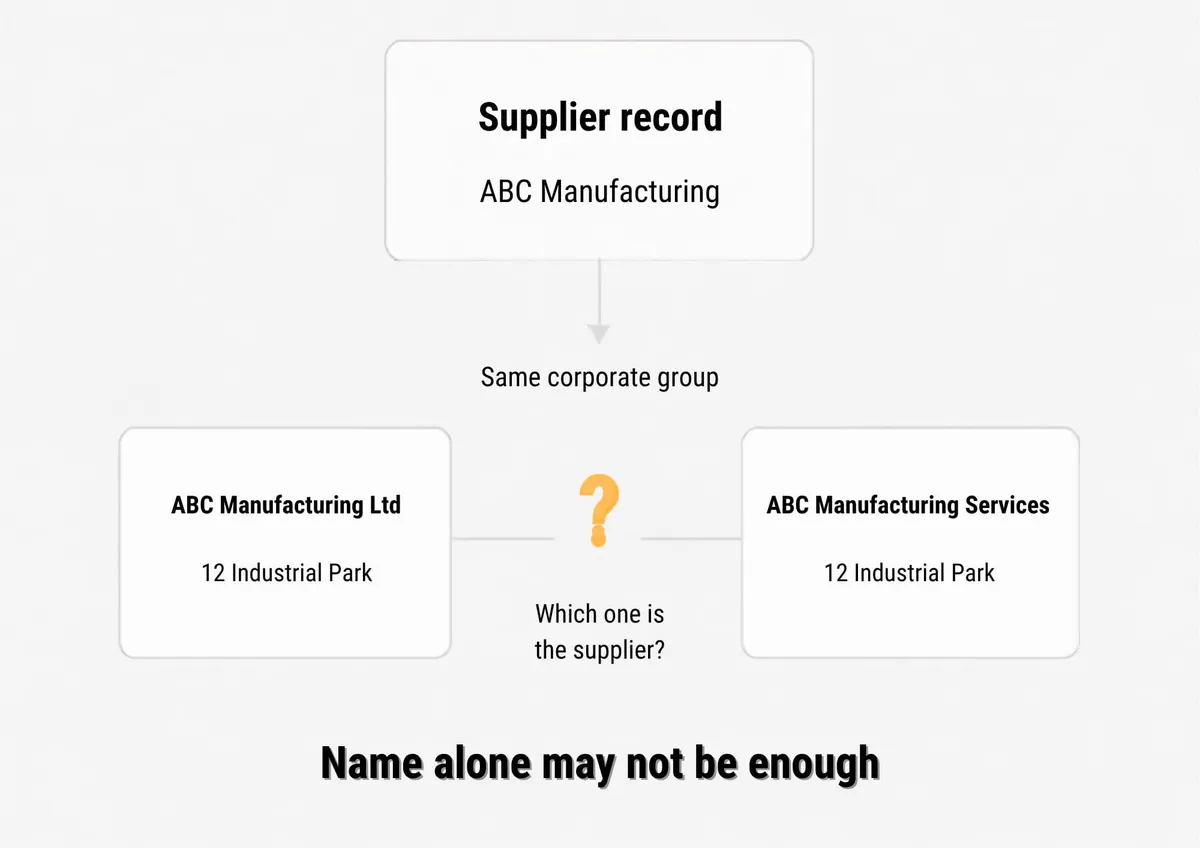
Illustration: Veridion
When several related companies have similar names or addresses, you need more information to confirm which one is the supplier.
The ifo Institute’s linkage process compared company names, addresses, sectors, and contact information when matching records. The process produced a single company match for each record, with manual review used to correct lower-confidence matches.
But some records will still contain conflicting or insufficient information.
In those cases, it’s best to keep the supplier unresolved rather than attach its emissions to a company that the available information doesn’t establish as the supplier.
Pull Machine-Verified Emissions Data Instead of Surveying
Supplier questionnaires can help you collect emissions data, but they can also leave gaps when suppliers don’t respond or can’t provide the data you need. However, you can still fill some of those gaps by using data that companies have already published.
Access Scope 1, 2, and 3 Estimates Directly From a Structured Source
You can ask suppliers for emissions data and still end up with gaps in your dataset.
Sustainability data company EcoVadis and tech consultancy Accenture’s 2026 Sustainable Procurement Barometer found that 30% of surveyed suppliers provided no emissions data to customers. Only 21% provided detailed activity-level carbon data for Scope 1–2 and selected Scope 3 categories.
But that doesn’t always mean the emissions data is unavailable.
Companies also publish emissions figures in sustainability reports, annual reports, carbon reduction plans, and other disclosures.
So when a supplier doesn’t provide the data you need, you can look for its published figures instead.
However, finding an emissions figure doesn’t mean you can add it to your dataset immediately.
You may need to check the reporting year and unit and record the source before adding it to your dataset.
Doing this for hundreds of companies can mean spending hours opening reports, searching for the right figures, and copying them into your dataset. A structured source can reduce that manual work by extracting the figures for you.
Veridion can help with this.
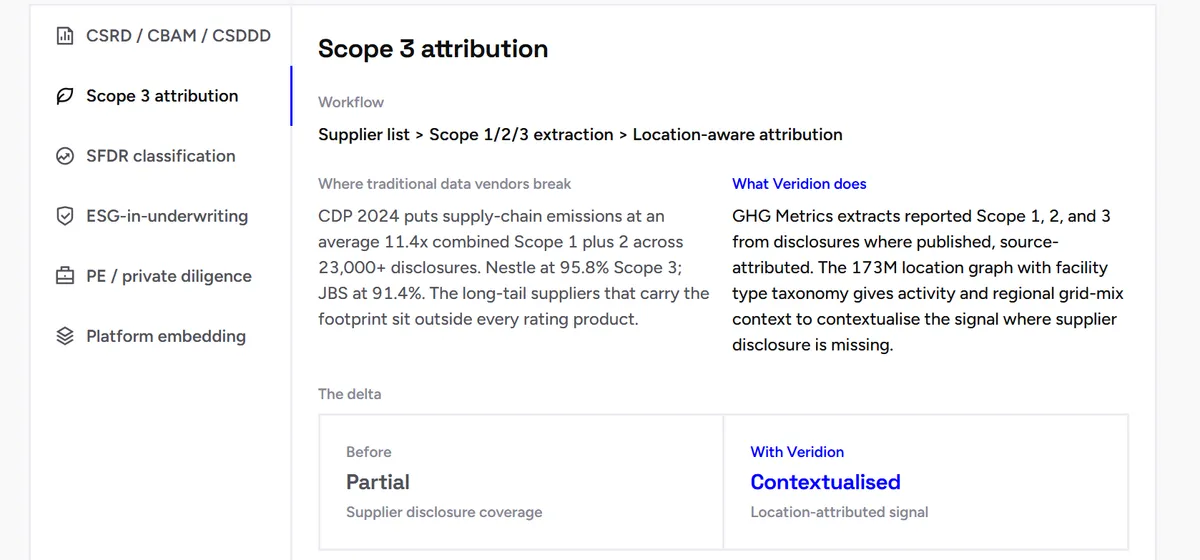
It extracts Scope 1, Scope 2, and Scope 3 emissions from company disclosures and turns them into structured company records, with source attribution for each figure.
Source: Veridion
For example, a credit-data provider needed to bring these metrics into an ESG product without relying on analysts to extract them company by company.
Veridion extracted the metrics from carbon reduction plans and sustainability reports. It then validated the results and linked each set of figures to the correct company in its company knowledge graph.
The resulting records included baseline and current Scope 1, 2, and 3 emissions in metric tonnes of CO₂e, along with reduction targets. The figures were also linked to the correct companies so that the provider could join them to its existing company data.
With a structured source, you can add published emissions data to your supplier records without asking each company to provide it. You can then handle suppliers still missing emissions data separately using estimates.
Understand How Non-Reported Emissions Get Estimated
When a supplier doesn’t report its emissions, you can still estimate its contribution to your Scope 3 inventory from other data it provides about the goods or services you purchased.
For example, the supplier might tell you how much material, fuel, or electricity it used to produce your goods. You can then use those amounts with the relevant emissions factors to calculate the emissions associated with your purchases.
The basic calculation is the amount of activity multiplied by the relevant emissions factor. The GHG Protocol describes this as the hybrid method for Category 1.
For example, if a supplier used 5,000 kWh of electricity to produce your goods and the relevant emissions factor is 0.4 kg CO₂e per kWh, the estimated emissions would be 2,000 kg CO₂e.
You can make the same calculation for other relevant activities, such as materials or fuel, and add the results to estimate the emissions associated with your purchases.
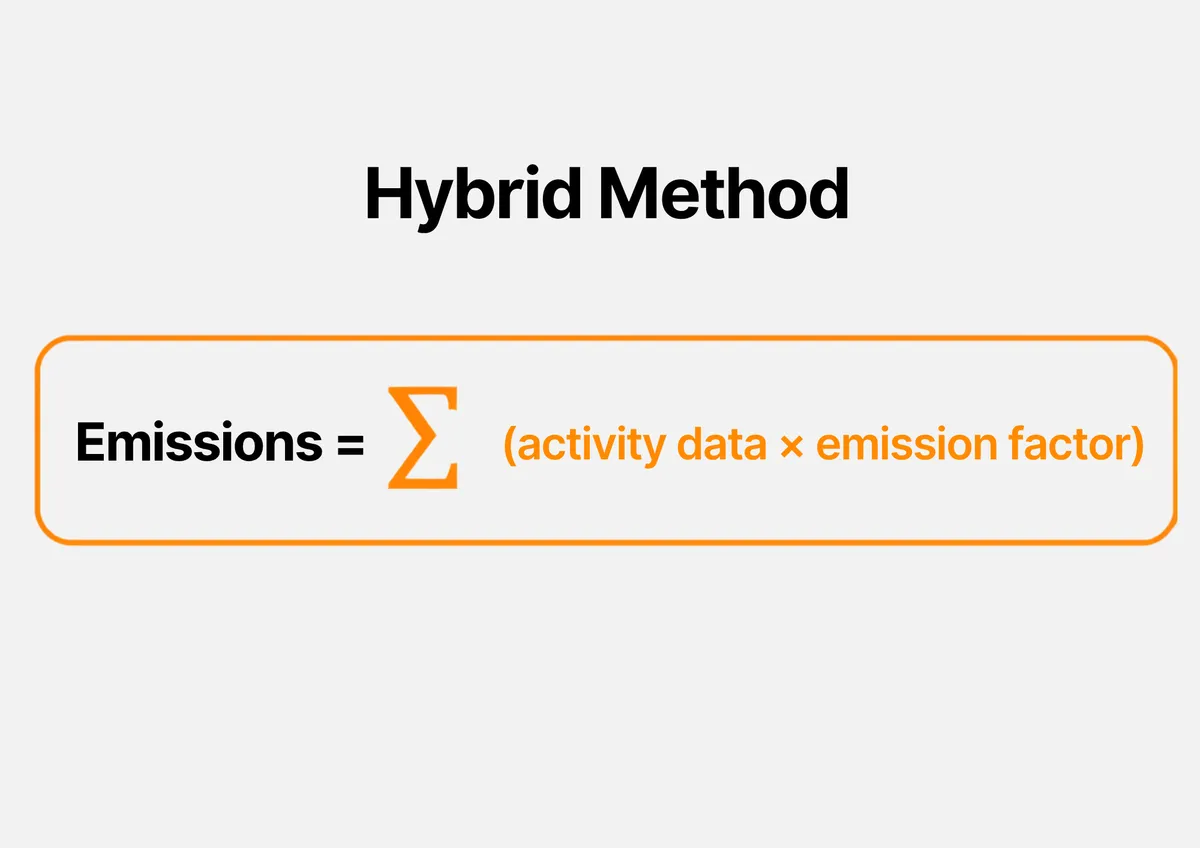
Illustration: Veridion / Data: GHG Protocol
However, sometimes the supplier may not provide those activity figures either.
In that case, you can use the quantity of goods or services you purchased and an industry-average emissions factor for that type of product or service.
For example, if you purchased 10,000 kg of a product and the relevant emissions factor is 2 kg CO₂e per kg, the estimated emissions would be 20,000 kg CO₂e. The GHG Protocol uses this approach in its average-data method for Category 1.
And if you don’t have the quantity you purchased, you can use your spending instead.
For example, $100,000 spent on a product with an emissions factor of 0.5 kg CO₂e per dollar would produce an estimated 50,000 kg CO₂e. The GHG Protocol uses this approach when other methods are not feasible because of data limitations.
These approaches let you estimate emissions even when a supplier has not provided a completed emissions figure. But remember to keep these calculated figures separate from supplier-reported emissions so you can tell which numbers are estimates.
Prioritize Suppliers by Emissions Exposure
When you have hundreds of suppliers, you need a way to narrow the list and decide where to focus first. Spend can help you rank suppliers, but it doesn’t always show which suppliers have the biggest emissions exposure.
Overlay Spend Data With Emissions Intensity
Spend gives you one way to rank suppliers because you can sort them by how much you spend with each one.
In fact, the GHG Protocol recognizes spend as one criterion you can use to prioritize Scope 3 data collection.
However, your highest-spend suppliers are not necessarily the suppliers contributing the most emissions.
Sanofi's 2024 Sustainability Report provides an example of this difference.
Its Supplier Engagement Program covered 205 suppliers representing 50% of procurement spend, but those suppliers accounted for 75% of supplier-related emissions.
This shows why the suppliers you spend the most on may not be the suppliers with the highest emissions.
That’s why emissions intensity gives you another way to compare suppliers. It shows how much emissions are associated with the products or services they provide.
However, you may not have supplier-reported emissions for every supplier.
So for those suppliers, you can use industry averages, input-output data, proxy data, or rough estimates to estimate their potential emissions. The GHG Protocol supports this type of screening.
You can then combine spend and emissions intensity to group suppliers into four simple priority levels:
Supplier Profile | Priority |
|---|---|
High spend + high emissions intensity | Highest priority |
High spend + lower emissions intensity | Monitor |
Lower spend + high emissions intensity | Investigate |
Lower spend + lower emissions intensity | Lower priority |
High-spend, high-intensity suppliers are the clearest priority because they rank high on both measures. You spend a significant amount on these suppliers, and the products or services you buy from them are also associated with relatively high emissions.
However, the low-spend, high-intensity group needs a closer look.
These suppliers may not appear near the top of a spend-based ranking, yet their higher emissions intensity means they could still be important sources of emissions.
Looking at both measures helps you catch suppliers that a spend-only ranking would push down the list.
Focus Full Measurement on the Highest-Exposure Suppliers
A small group of suppliers can account for a large share of your Scope 3 emissions.
McKinsey found this pattern in semiconductor supply chains.
A fab may work with hundreds of suppliers, but six to ten of them can account for half of the emissions linked to chemicals, wafers, and gases. For maintenance, spare parts, and equipment upgrades, just three to five suppliers can account for more than half of the emissions.
McKinsey’s analysis suggests that semiconductor companies can focus their supplier engagement on this small group that accounts for the larger share of upstream emissions.
You may see a similar pattern in your own supplier base.
You may work with hundreds of suppliers, while only a smaller group accounts for a large share of your estimated emissions. Once you know which suppliers fall into that group, you can put more effort into measuring their emissions.
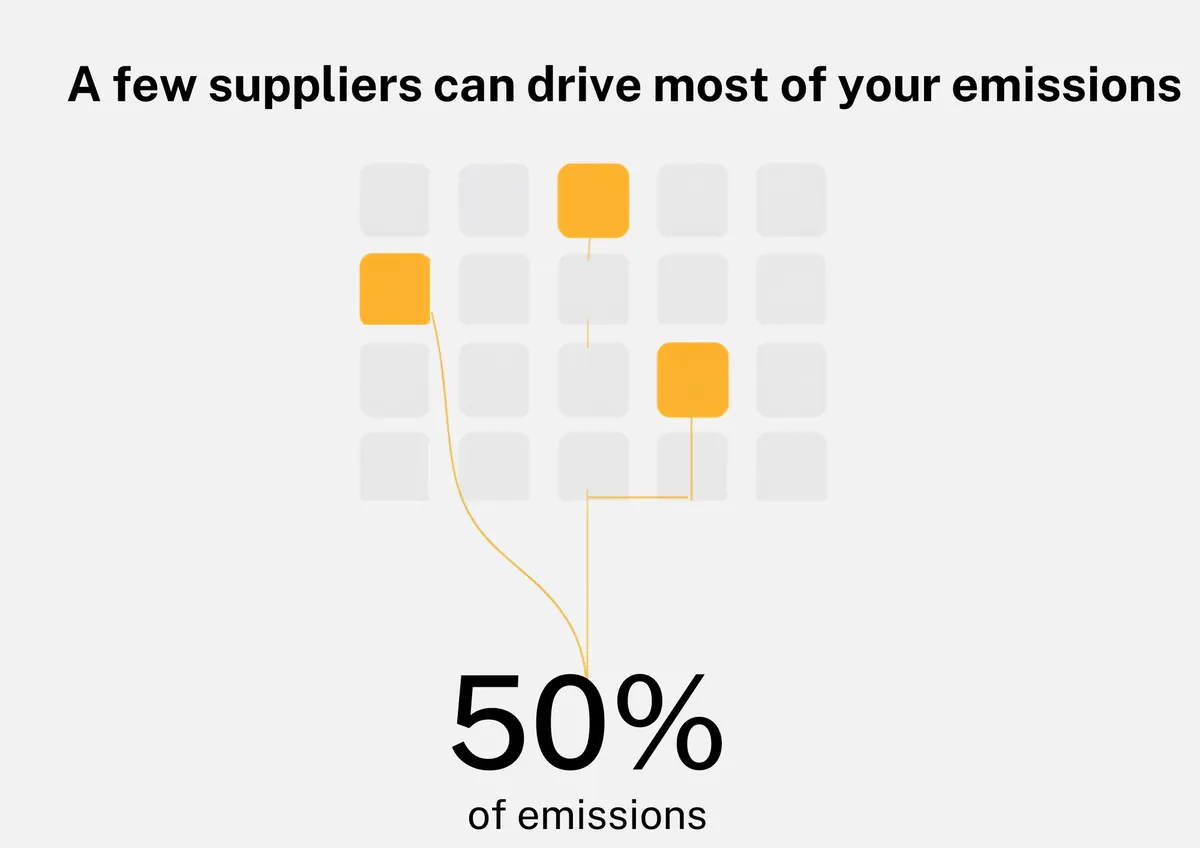
Illustration: Veridion
The estimates you used during screening helped you identify those suppliers. But now you need better data to measure their emissions more closely.
The GHG Protocol recommends prioritizing data collection for activities with the highest expected emissions and using higher-quality data for those activities. Where possible, it also recommends collecting data directly from suppliers to get more specific data for priority Scope 3 activities.
So if a supplier appears near the top of your exposure list, look for supplier-specific emissions or activity data.
You can continue using estimates for suppliers with lower exposure while putting more measurement effort into the suppliers that have the biggest impact on your footprint.
Apply the Data to Portfolio and Investment Risk Analysis
Portfolio emissions can be difficult to assess when the emissions data sits at the individual company level. You need a way to bring those figures together.
Aggregate Supplier-Level Emissions Into Portfolio Exposure
Your portfolio's emissions exposure depends on how much of each company's emissions you assign to your portfolio.
The Partnership for Carbon Accounting Financials (PCAF) provides a standard way to make these calculations. Its Global GHG Accounting and Reporting Standard explains how to calculate the share of emissions linked to different financial activities. The basic calculation is simple. You multiply a company's emissions by the relevant attribution factor.
If a company has one million tCO₂e of emissions and your attribution factor is 5%, you would attribute 50,000 tCO₂e to your portfolio.
You can then repeat the calculation for each company and add those amounts together. This gives you one emissions figure for the portfolio.
ING, the banking and financial services corporation, provides a practical example.
Its 2025 Annual Report says it calculates financed emissions using the PCAF methodology and combines outstanding financial exposures with externally sourced emissions data.
This portfolio-level view also shows which parts of your portfolio account for most emissions.
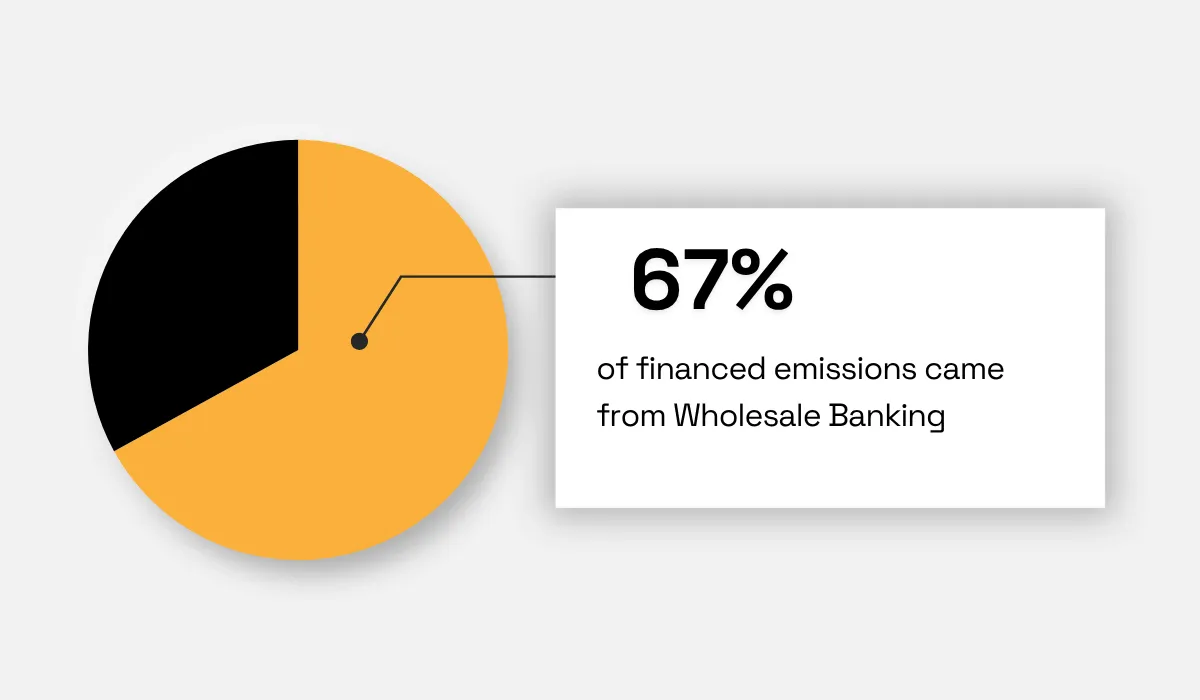
ING, for example, uses its financed-emissions data to see where most of the emissions in its loan book come from. As a result, in 2025, its Wholesale Banking portfolio accounted for more than two-thirds of its total financed emissions.
When reported emissions are unavailable, PCAF allows you to use estimated emissions based on physical or economic activity data. So you can also include companies whose emissions you had to estimate earlier in the process.
ING, for instance, notes that its clients' Scope 3 emissions are often based on proxies and estimates.
This means you can still calculate financed emissions when some company-level figures are estimates. You just need to keep track of where those figures came from and how they were calculated.
Maintain an Auditable Trail for Every Data Point
The GHG Protocol requires companies to document the data sources, activity data, and emission factors used to calculate Scope 3 emissions. They must also describe the methods and assumptions used in the calculation.
You should keep the same information when you build your own emissions dataset.
If a supplier gives you its emissions figure, record where it came from and what period it covers. But if you calculate the figure yourself, record the activity data and emission factor you used.
For example, you may record that Supplier A contributes 8,400 tCO₂e to your inventory. Keep the supporting information so you can later show where the 8,400 tCO₂e figure came from and how you calculated it.
This becomes especially useful when you replace an estimate with supplier-specific data.
A supplier may initially have no emissions data, so you estimate its emissions using spend and an emission factor. Later, the supplier may provide activity data that lets you replace the estimate with a more specific calculation.
The GHG Protocol recognizes this process.
It says companies may start with lower-quality data and should improve it over time by replacing it with higher-quality data as it becomes available.
So when you update a supplier's emissions figure, keep both the old calculation and the new one. That gives you a record of what changed and why.
Conclusion
Supplier data gives you the most specific picture of your supply chain emissions. When that data is missing, you can use figures the company has already published or estimate the emissions using other available data.
However, finding published emissions data for hundreds of suppliers can still be difficult to do manually. A structured source such as Veridion can help you find those figures in company disclosures and connect them to the right company records.
And as suppliers provide more specific data, you can update the figures in your inventory. This means you can build and audit your Scope 3 inventory without surveying every supplier.
Articles
Discuss how these trends affect your organization.
Our analysts are available for a short call. Bring a specific question and we will ground it in the data.
Insights
Keep reading
More analysis, research, and outcomes grounded in live company intelligence.
How Successful Companies Use Market Intelligence for Business Growth
Discover how successful companies use market intelligence to unlock new growth opportunities. Learn more in our latest guide.
5 Types of Market Intelligence You Need to Know About
Explore five different types of market intelligence that can shape your competitive edge. Find out which ones your team should prioritize.
How Is AI Revolutionizing Market Intelligence?
Explore the key ways AI is transforming market intelligence workflows and helping businesses stay ahead of the competition.