Insights / Articles
The Hidden Danger of Shared Facilities: Identifying Co-Located Business Risks in P&C Liability
We will explore co-located business risks in P&C liability and show how identifying businesses at shared facilities can strengthen risk assessment.

- Isolated address and hazard-zone checks miss the real risk.
- One tenant's hazard can become everyone's claim.
- Manual co-tenancy checks are hard to scale across a modern portfolio.
- Co-tenancy risk needs automated ongoing monitoring, not a one-time check.
A fire breaks out inside a Jonesboro, Georgia, dry cleaner at 1:30 a.m. By morning, two unrelated businesses next door are destroyed, and a third is badly damaged.
None of them touched a dry-cleaning machine. This is the reality of shared commercial space.
You underwrite the address in front of you. But the business next door, sharing your applicant's wall, roof, or ventilation system, can decide whether that policy turns into a claim.
Here's why co-tenancy risk is a blind spot in liability underwriting, how that risk materializes, how to spot high-risk neighbors, and keep watch as tenants come and go.
Why "Where" Isn't the Same as "Who Else Is There"
Traditional underwriting evaluates a site in isolation. You look at the applicant's business type, verify the address, run it against flood maps or wildfire zones, and price the policy based on what that one tenant does.
This approach treats the site as a closed system, as if the walls around it were the edge of the risk universe. That assumption breaks down fast in multi-tenant buildings.
A standard address lookup tells you where a property sits. It doesn't tell you that the unit next door houses a commercial kitchen, a nail salon, or a chemical storage operation.
Geocoding tools created by the insurance industry do not solve the problem of occupancy visibility; a precise building-level geocode tells you where a structure is, not who occupies it.
Ecopia AI tested this by running a single rural Illinois address through five separate geocoding platforms. One could not find the address at all. One placed it a mile away on the wrong road. The other three landed inside the correct parcel, in three different spots, and none of them matched the actual structure.
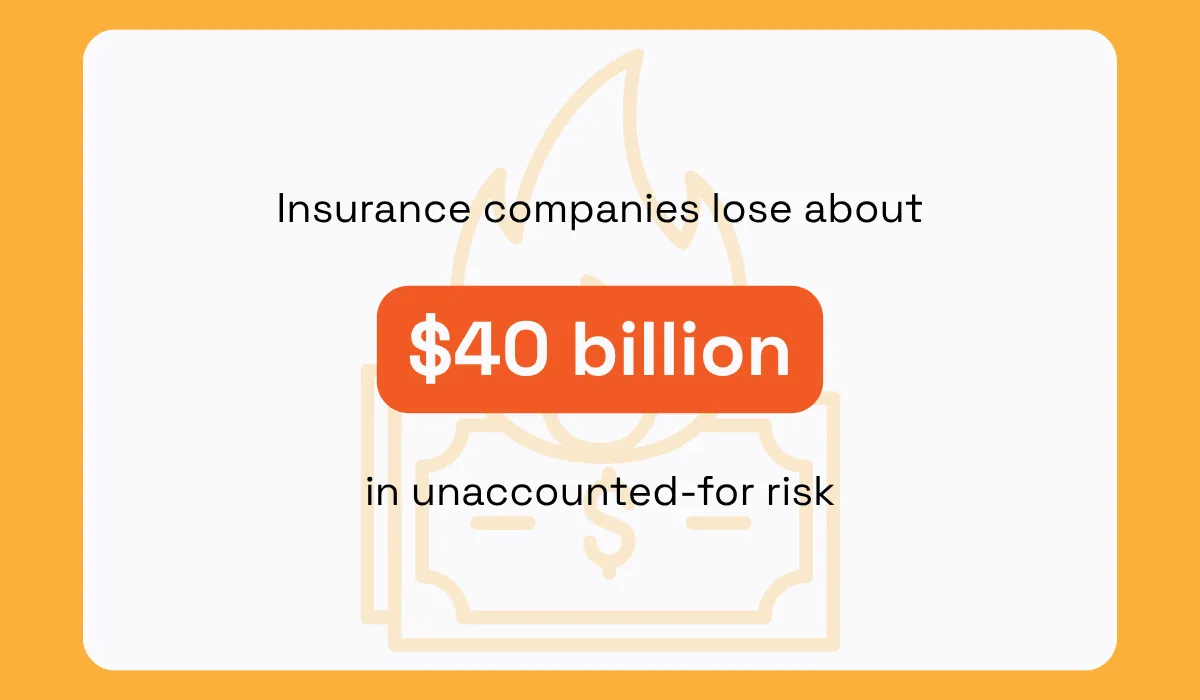
Ecopia has tied this kind of geocoding error to more than a million underpriced flood policies and over $40 billion in unaccounted-for risk.
Precisely, a data provider serving insurance carriers, frames this directly as a distinct category of geographic risk: understanding how many other properties have been insured nearby and which businesses sit in the same building or parcel.
This gap becomes increasingly relevant as buildings grow denser. Strip malls, industrial parks, and multi-tenant complexes are designed to house separate businesses under one roof or with the same electrical box.
A standalone, single-occupant site has one operational profile to underwrite. A shared building, on the other hand, has as many risk profiles as it has tenants, and most underwriting workflows only ever see one of them.
When underwriting a business in a multi-tenant property, ask for a current list of all tenants at the location. Even small tenants (like a cleaning service or home workshop) can pose risk.
The Domino Effect: How One Tenant's Risk Becomes Everyone's
A hazard does not limit itself to the unit of origin; fire spreads through common walls, and smoke spreads through common air ducts. Contaminants spread through common soil and groundwater.
In a multi-tenant building, one tenant's misfortune translates into claims filed by all other tenants.
The Jonesboro dry cleaner fire mentioned earlier is a clean example of the pattern. The fire that began in a dry cleaner's shop tore through a strip mall, destroying a neighboring smoke shop and damaging a Chinese restaurant, with the roof collapsing over both unrelated businesses. The smoke shop and Chinese restaurant had no connection to the fire's source.
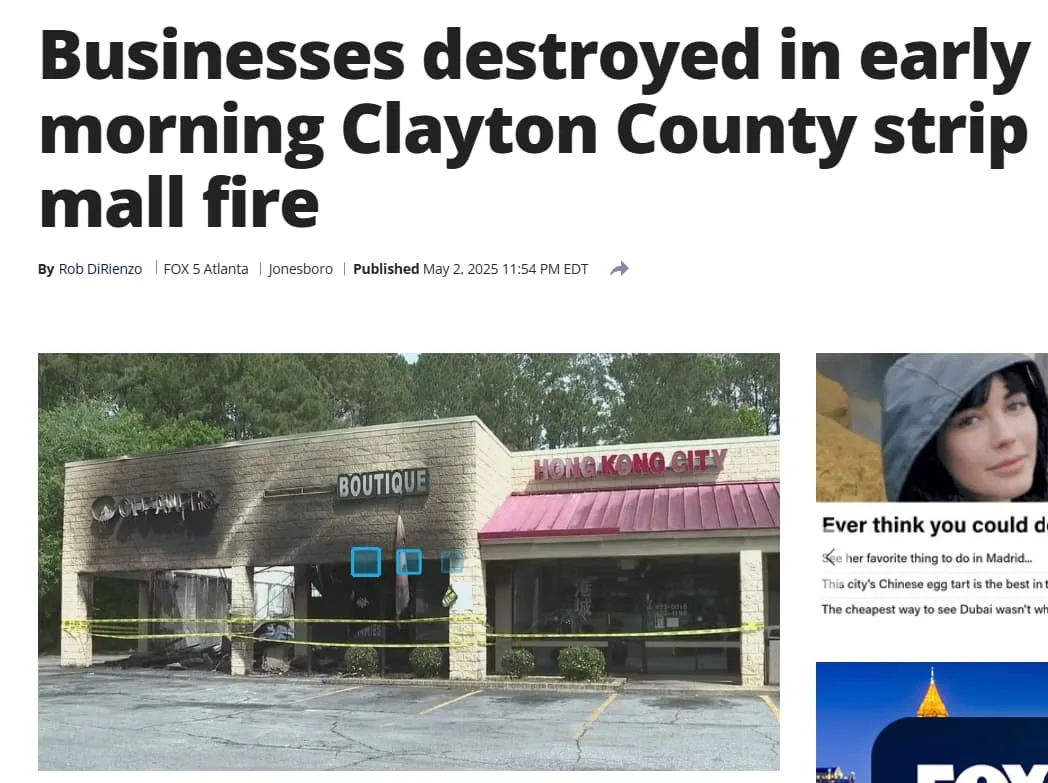
Source: Fox 5 Atlanta
Common infrastructure is often the means of contamination. Common walls spread fire and structural damage, while common HVAC air ducts convey contaminants from unit to unit.
Shared plumbing and electrical systems create additional pathways for water damage and electrical fires to cross tenant lines.
Insurers should treat this as a predictable, recurring pattern of shared commercial environments, not a rare edge case. The physics of shared infrastructure guarantees it will happen again.
In multi-tenant buildings, consider the risk of cross-contamination and identify whether any tenants will be handling flammable substances, fuel, or chemicals. Insist on individual suppression and containment measures (such as a kitchen hood system) per unit.
In policies, consider endorsements or exclusions for off-site damage and make sure your assessment isn't static—think about neighboring tenants on every renovation, since a new tenant could introduce a hazard mid-policy.
Why Manual Co-Tenancy Checks Don't Scale
Underwriters have traditionally used three ways to identify other occupants of a building: inspections, manual investigation, and information provided by the applicant. All of these approaches have limitations, and these limitations become apparent quickly when volumes go up.
Site visits work for individual, high-value accounts, but they don't work across a book of thousands of small commercial policies moving through triage in days, not weeks.
An agent has to visually inspect the site to determine occupancy, and this method is slow, inefficient, and prone to producing inaccurate or incomplete information.
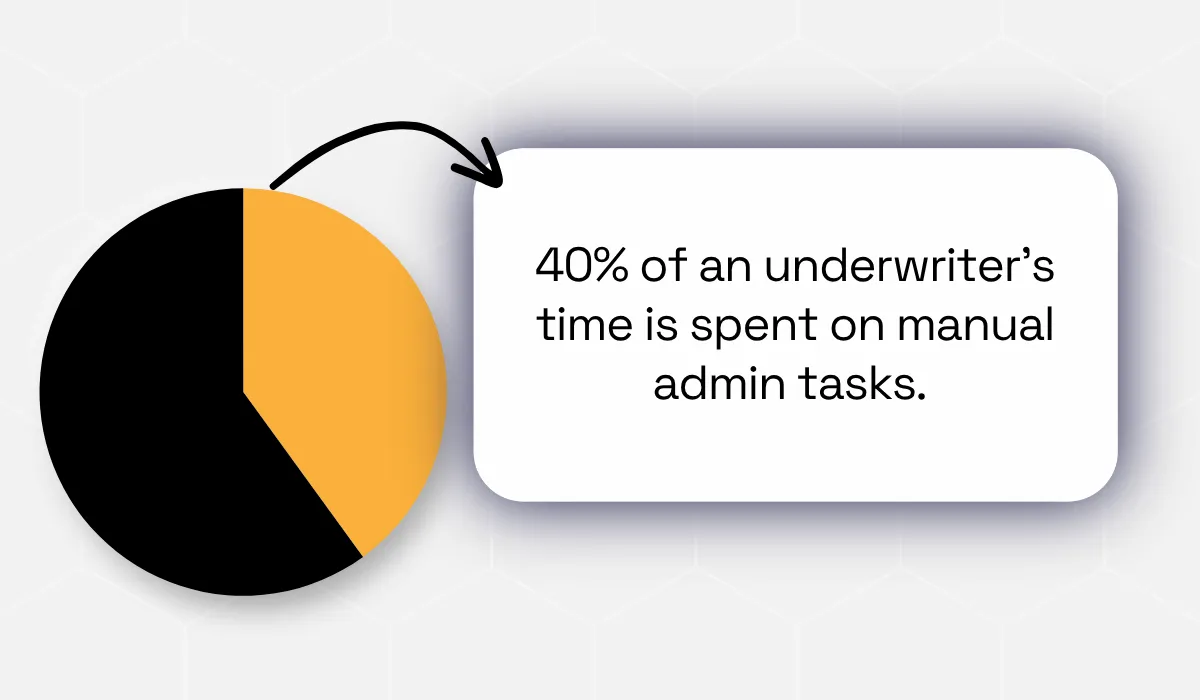
This manual friction adds up fast: McKinsey notes that underwriters spend 30–40% of their time on manual admin tasks. This includes tracking down address details or chasing incomplete applications, tasks ripe for automation.
A commercial portfolio can hold thousands of locations, and each one is a candidate for a tenant change since the last renewal. Site visits do not scale to that volume.
Applicant-disclosed information carries its own blind spot. A prospective tenant applying for coverage may genuinely not know what business operates two doors down. Even if they know, they have no incentive to flag a neighbor that could raise their own premium, so asking them to self-report a neighbor's hazard profile puts the burden on the wrong party.
General-purpose mapping tools do not close this gap either. They plot an address on a map and can show you a building outline, but they can't tell you what happens inside the unit next door.
You get geographic placement without operational context, which is the piece that actually matters for liability pricing.
An underwriter checking three different tools can end up with three different pictures of who occupies a shared site, and none of them may be current.
Wherever possible, replace manual research with technology. Use an underwriting workbench or data service that ties in business registries and AI crawling to reveal all tenants at a site instantly.
Additionally, follow up with public business directory checks. Without such automation, you'll miss things, and incomplete disclosure by applicants and manual reviews overlook critical data points.
What "Automatically Mapping" a Building Actually Means
Moving from a single address to a full picture of a shared site takes three technical building blocks working together.
First, you need precise building footprint and parcel identification, pinpointing the exact structure rather than a rough centroid on the land parcel. So businesses genuinely inside the same building get grouped together instead of lumped in with neighbors on an adjacent lot.
For example, a recent ZestyAI analysis of 1 million U.S. properties revealed that 45% of parcels contained more than one structure. If you only knew the parcel centroid, you'd miss that there's a rear warehouse behind the storefront.
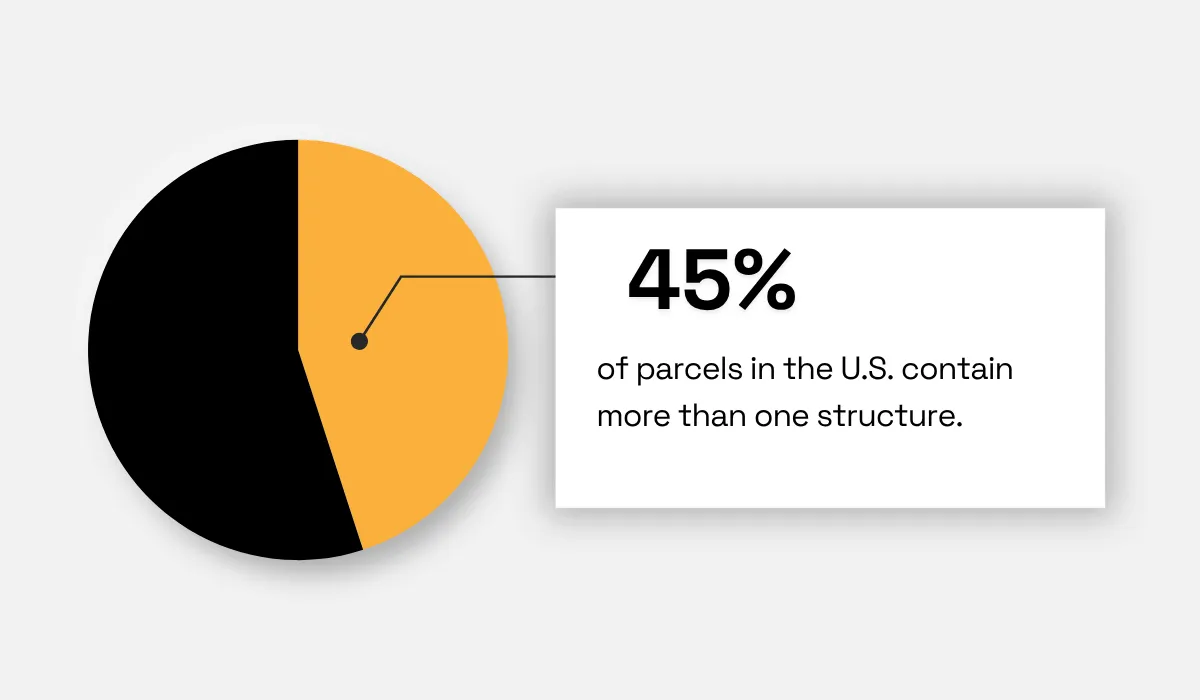
By contrast, using building footprints (the true extent of each structure) leads you to much more accurate location-based risk assessment.
In practice, this means you see that two buildings share one address, and treat them separately.
Second, you need business-to-location matching, resolving every active business operating at or near that footprint. In doing so, you are combining vector data for the physical structure with attribute data describing what actually happens inside it.
Third, you need functional classification of each co-located business, determining what each tenant actually does day to day.
That third step is the one that carries the underwriting weight. Knowing that three businesses exist at an address tells you almost nothing. Knowing that one of them is a nail salon, one is a dry cleaner, and one stores flammable solvents tells you everything about how risk could move between them.
A nail salon beside a dry cleaner carries a materially different hazard profile than the same nail salon beside an accounting office, even though both scenarios look identical on a map.
A map answers a geography question while risk mapping answers which businesses share infrastructure that a hazard could travel through (walls, ventilation, plumbing), and which of them could pull your insured into a claim they had no part in causing.
Two businesses can sit fifty feet apart on the same parcel with no shared systems, while two others share a single firewall that offers minimal protection against heat transfer.
The goal of building-level mapping is identifying which tenants are physically connected in ways that let hazards travel, not just which tenants happen to be nearby.
From Adjacency to Underwriting Decision: Flagging High-Risk Neighbors
Not all neighbors' businesses will add to your risk. But some operations present a greater risk than others.
Shared walls with a commercial kitchen with a lot of grease and open flames, a dry cleaner that uses solvents, and fuel-dependent operations like an auto repair shop or a laboratory working with reactive materials are likely to affect your risk, and these are the types of operations that underwriting treats as co-tenancy risks.
In cases where there is a flagged neighbor, underwriters usually undertake certain actions; they may demand:
- endorsements or exclusions (for example, an exclusion for losses from pollution if the neighbor is a battery recycler)
- additional loss control measures (sprinklers, special ventilation, firewalls)
In case of serious risks posed by the neighbor, the underwriter may choose to decline.
Veridion's commercial insurance solution is built to make this process easier. It maps active business locations at and around a given site, including businesses that traditional registries and databases often miss, and classifies what each one actually does operationally.
Source: Veridion
With such data, underwriters can see exactly which neighboring tenants carry elevated hazard potential, before a policy binds rather than after a claim arrives.
This check delivers the most value early. At triage, it helps decide whether an application needs a closer look.
At quoting, it feeds directly into rate and endorsement decisions. At binding, it serves as a final gate, confirming that nothing changed about the surrounding tenancy between quote and issuance.
Skipping the check at any of these three stages leaves a blind spot that carries through the life of the policy.
Keeping Co-Tenancy Awareness Current Over Time
Co-tenancy risk shifts when there are changes in the tenant population, in ownership, and in business operations. The co-tenancy check performed at binding only indicates who occupies a property at that moment. It doesn't tell you who will occupy the property six months from now. A property that was safe at the time of binding can turn out to be very risky six months down the road.
Studies reveal that turnover rate in commercial leases is quite significant. On average, commercial and retail lease agreements last between three and ten years, with five years being the standard term. However, turnover in this period occurs quite frequently, particularly in strip centers and multi-tenant buildings, where smaller tenants change locations much more often than larger "anchor" tenants.
Commercial tenant turnover has been reported to go to 19.4%, meaning roughly one in five units in a given building can change hands within a single year. For the retail sector, tenant retention has been measured at around 73.8%, which means over a quarter of retail tenants don't stick around from one year to the next.
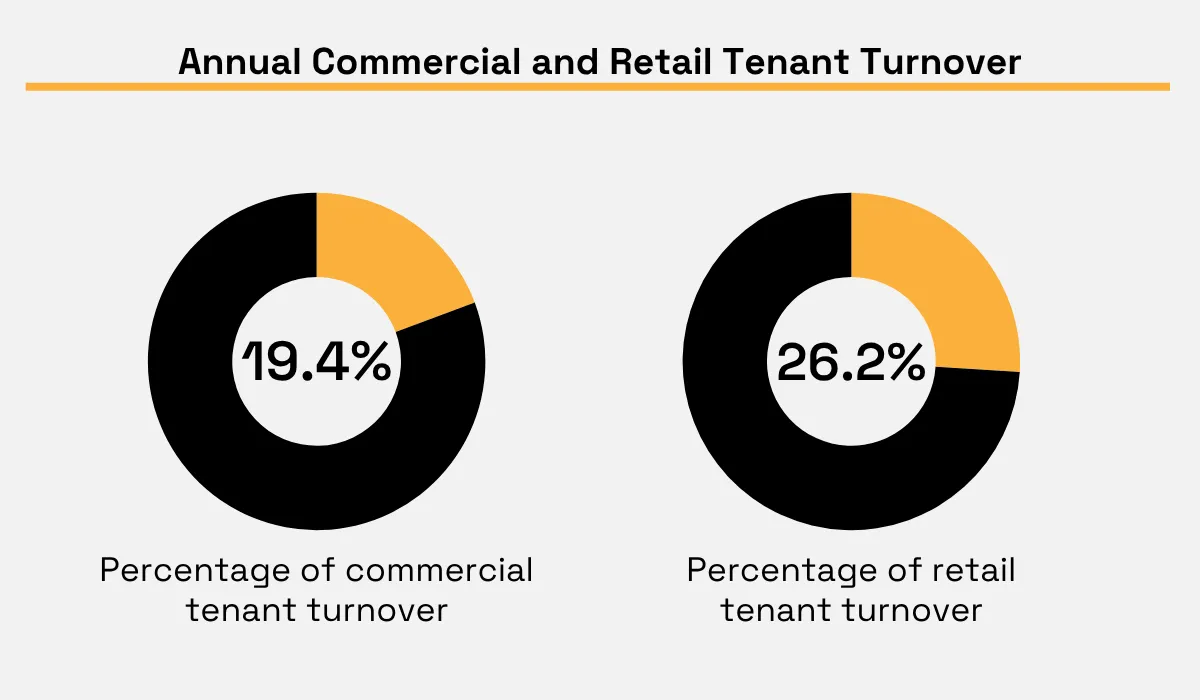
Illustration: Veridion / Data: Federal Reserve Bank of St. Louis & Re-Leased
What does this mean for you? Even after binding a policy, you need periodic re-checks. Otherwise, your data goes stale.
A low-hazard office might suddenly find a high-risk lab moved in next door. Without a refresh, you won't know until claim time.
This matters even more at the portfolio level. If the same hazardous tenant type, a chemical distributor, moves into buildings next to several of your insureds across different policies, you are carrying accumulation risk you may not know you have.
The presence of a new tenant in a single property might appear to be an insignificant event. The same tenant type popping up next to a dozen of your insureds is a much bigger exposure.
Continuous co-tenancy monitoring, along with overall commercial insurance data management practices, is what will turn such an isolated occupancy check into an ongoing protection against accumulation exposure.
Many insurers now subscribe to data feeds or use platforms that flag changes—new permits, new Google listings, news of occupancy changes—against insured locations.
If a hazardous permit pops up at an insured site, the system can alert your underwriting team. On renewals, the address gets reprocessed through the mapping engine to spot new neighbors.
Conclusion
Shared buildings will keep housing unrelated businesses, and hazards will continue to sneak through various communal structures.
Insurance carriers, who consistently track what is next door, price according to reality and discover accumulations before they result in a communal loss.
Treat co-tenancy as a dynamic data point, not a static box to be checked once, and your underwriting will last far beyond the ink on the page.
Articles
Discuss how these trends affect your organization.
Our analysts are available for a short call. Bring a specific question and we will ground it in the data.
Insights
Keep reading
More analysis, research, and outcomes grounded in live company intelligence.
Data Requirements for Underwriting Liability in Shared Commercial Properties
From usage types to maintenance responsibilities, find out which data matters most when underwriting shared property risks.
Market Intelligence vs Market Research: What's the Difference?
Not sure whether you need market research or intelligence? Learn the key differences and when to use each.
6 Mistakes to Avoid when Gathering Market Intelligence
Think your market intelligence is on point? Check out these five frequent mistakes and how to avoid them before it’s too late.