Insights / Articles
Data Attributes That Make Risk Models Smarter Than Basic Firmographics
Tired of basic firmographics? See how advanced data attributes help you identify emerging market risks and build smarter, more resilient risk models.

- Firmographics say who a company is, not how it is behaving.
- Nearly a quarter of organizations suffered a third-party security incident in 2024.
- Scattered attribute data significantly slows down risk modelling.
A supplier checks every box from the right industry code, headcount, to the right region.
Six months later, you miss a delivery. Then another, and their credit rating slips.
By the time your risk score catches up, the damage is already done.
That's because firmographic data tells you who a company is, not what it's doing now or where it's headed.
This article covers five attribute types that give risk models a sharper signal, and shows how to bring them together into a single structured source.
Beyond Firmographics: The Attributes That Matter
The gap left by firmographics is measurable.
RiskRecon, a cybersecurity ratings firm, found in its 2024 State of TPRM study that nearly a quarter of organizations suffered a third-party security incident.
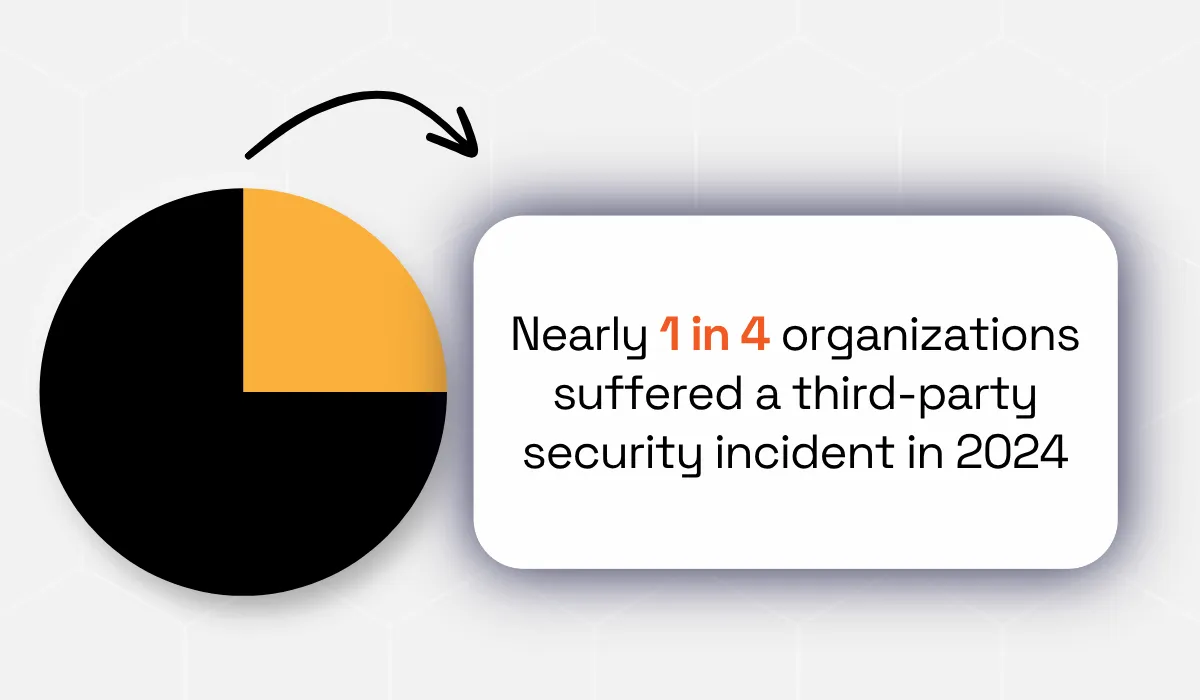
That's up from just 9% in 2020, a jump that industry classification codes like the North American Industry Classification System (NAICS) were never built to capture. It’s exactly why third-party risk management programs keep widening the data they look at.
Five attribute types close the gap. Each carries an early warning signal that basic firmographic data cannot produce.
The first is closest to the systems that attackers spend the most time in.
Technographic Signals
A company's technology stack shows what could break, which vendors it depends on, and where its cybersecurity exposure sits.
None of that shows up on a firmographic profile. So when a vendor becomes a liability, most risk teams find out only after the breach.
Technographic data covers the software a company uses, its cloud platforms, its deployment model, and its security setup. Attackers concentrate on this layer.
SecurityScorecard, a cybersecurity firm, found in its 2025 Global Third-Party Breach Report that 35.5% of all breaches in 2024 came through a third party.
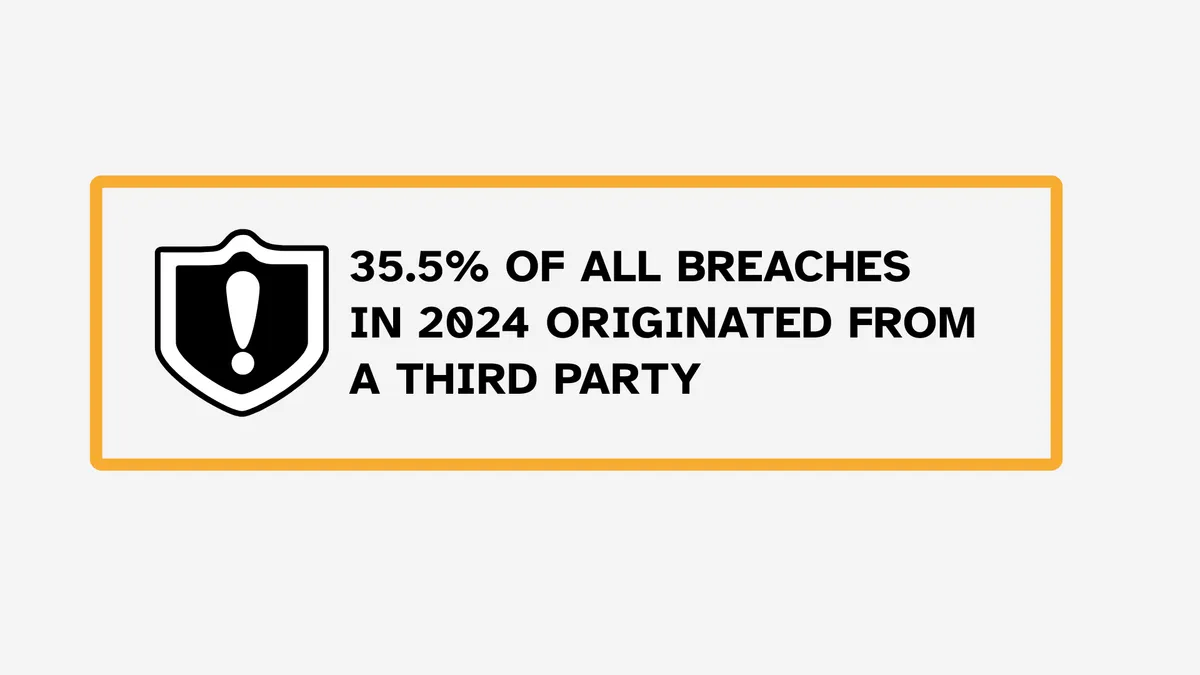
Illustration: Veridion / Data: SecurityScorecard
An industry code will not tell you which of your vendors runs a legacy remote-access portal without multi-factor authentication.
The Change Healthcare ransomware attack made that concrete in early 2024.
On February 12, attackers used stolen credentials to log into a Citrix remote-access portal at Change Healthcare. It’s a UnitedHealth Group subsidiary that processes claims for roughly a third of US patients.
The portal had no multi-factor authentication.
Attackers moved through the network undetected for nine days, then deployed ransomware on February 21.
They had already pulled out roughly six terabytes of data. Pharmacy claims, prior authorizations, and payment processing froze across two-thirds of US pharmacies.
UnitedHealth Group CEO Andrew Witty later confirmed to the Senate Finance Committee that the missing multi-factor authentication was what let the attackers move through the network so freely.
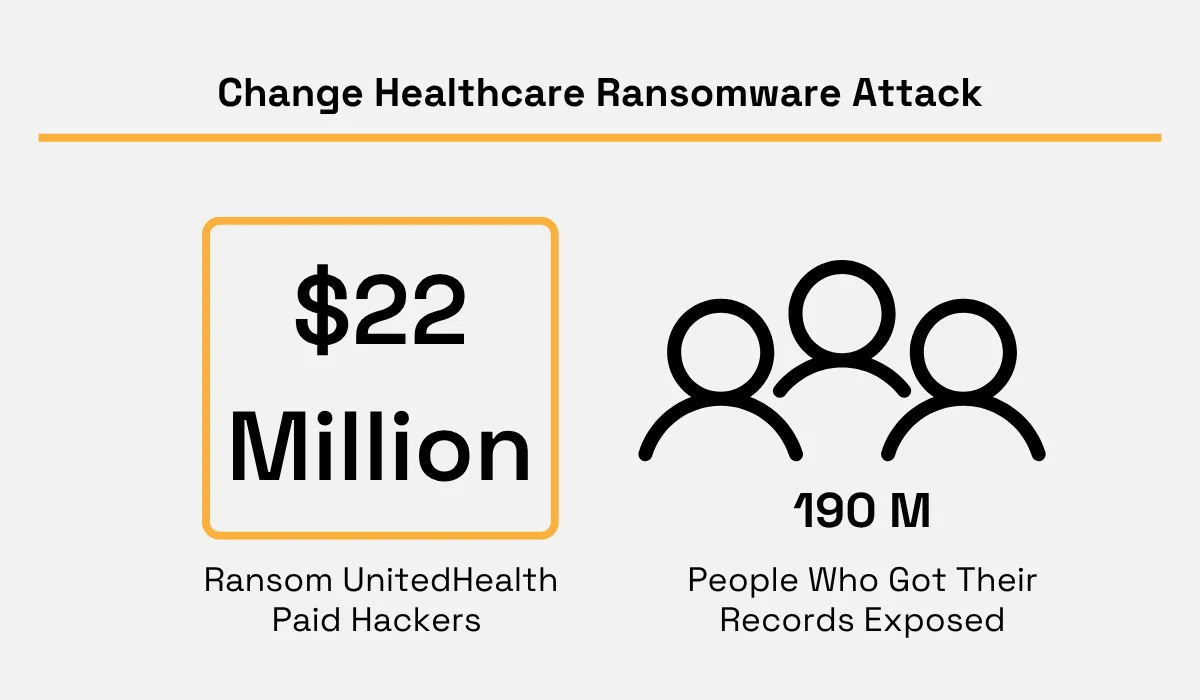
Illustration: Veridion / Data: UnitedHealth
UnitedHealth paid hackers a $22 million ransom. The total cost of the 2024 attack reached $3.1 billion and around 190 million people had their records exposed.
A risk model watching for that one weak spot, a Citrix login with no extra password step, could have caught it early. Instead, it turned into a nationwide healthcare payment crisis.
Technographic exposure sits at the software layer. The next attribute type sits closer to the people and policies behind those systems.
ESG Practice Indicators
A company's environmental, social, and governance practices include its policies, certifications, and any recorded controversies. These practices flag reputational, regulatory, and supply chain risk months or years before they show up in financial statements.
ESG signals include:
- Modern slavery statements
- Certifications like ISO 14001 or B Corp
A modern slavery statement tells you what a supplier has committed to on paper. Controversy records tell you what happened afterwards.
Analysts log those records to track labor violations, environmental fines, and human rights complaints. Certifications and controversy records answer different questions, so risk teams read them side by side.
Jurisdiction is the third layer. Teams map each supplier site against countries where forced labor or corruption is documented. A supplier with valid certifications and no logged controversies scores differently from one missing both.
The problem is scale.
Adelante SCM, a supply chain research firm, ran a survey for the software provider Infor. Its report on ESG readiness across supplier tiers surveyed executives in manufacturing, retail, and distribution.
They found that 44% had ESG visibility into only their Tier 1 trading partners. Another 30% reported no structured visibility at all.
Most enterprise supply chains stay blind to ESG risk below the first tier. A risk model can only score what its data covers. The gap in the supply chain becomes a gap in the model.
Company-level ESG and TPRM data covers certifications, controversies, and where a company operates. This kind of data can provide a clear picture for your risk assessments.
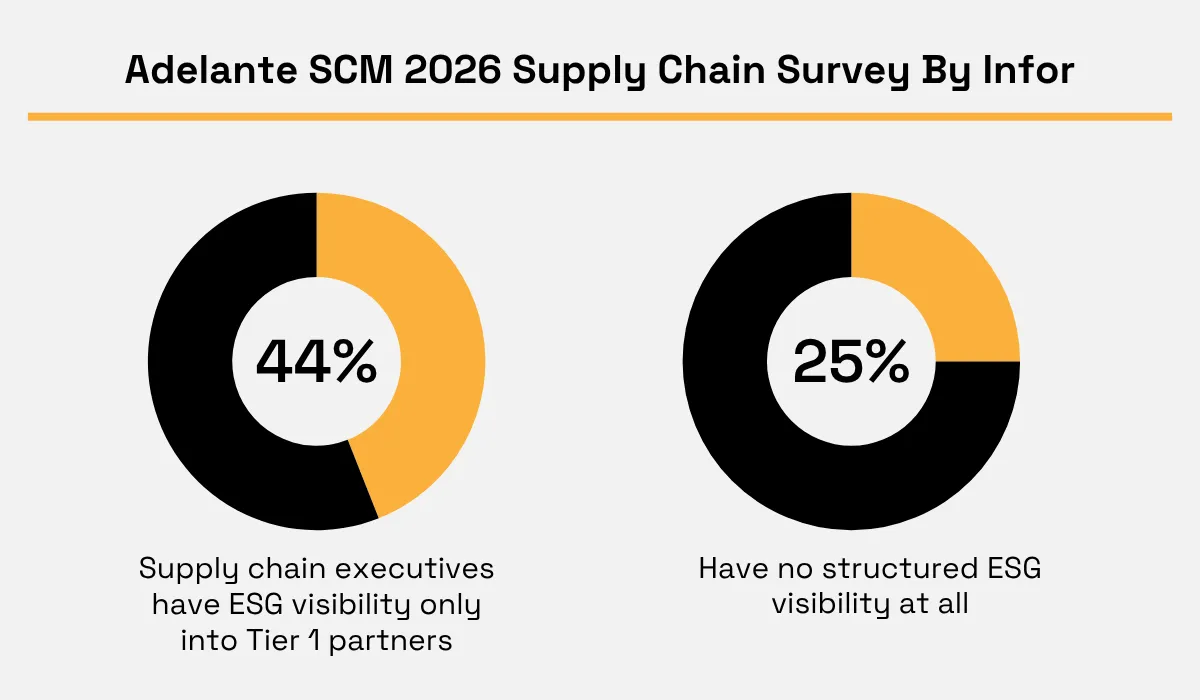
Illustration: Veridion / Data: Adelante SCM 2026 supply chain survey
Three ESG attributes were already scoreable before the Volkswagen case broke. Jurisdiction, controversy filings, and audit coverage each carried a readable value.
In June 2023, the European Center for Constitutional and Human Rights filed complaints against three German carmakers. The targets were Volkswagen, BMW, and Mercedes-Benz.
The complaints went to Germany's export control regulator under the Supply Chain Due Diligence Act. Each one alleged inadequate measures against state-imposed forced labor in Xinjiang supplier factories.
Volkswagen felt the financial effect first. US Customs detained thousands of its imported Porsche, Bentley, and Audi vehicles in February 2024.
The trigger was one small electronic component from a supplier linked to Uyghur forced labor. Volkswagen replaced the part and told regulators its earlier audits had lacked full supply chain transparency.
Read as data, every one of those attributes held a value beforehand. Jurisdiction marked Xinjiang as high risk for aluminum, cotton, and electronics.
Audit coverage showed nothing below the first tier, which is where the component came from. Controversy records already held the Sheffield Hallam University report behind the ECCHR case.
The report had been public since December 2022. None of it showed up on a balance sheet.
The same attributes also work in a supplier's favor. Documented audit coverage, clean controversy records, and low-risk sites make a supplier faster to approve. Buyers use those scores to shortlist suppliers as well as to reject them.
ESG data sits at the policy and practice layer, not the financial one. For most private suppliers, that data is never disclosed. Even the balance sheet stays hidden, and that hidden balance sheet is its own risk blind spot.
Financial Proxy Data
Most private companies do not publish their financials.
Risk models built on published balance sheets miss most of what's in a modern supply chain.
Financial proxy data closes that gap.
Risk models read three substitutes: hiring pace, funding activity, and public statements. Each one moves before an audited figure ever appears.
Headcount is the easiest to track. Job posts across a supplier's own listings often reveal expansion or contraction quarters before it shows up in a balance sheet.
Funding activity is the second signal. Announced rounds, new credit facilities, and refinancing dates show whether a supplier can still raise money.
Public statements close the set. Price increases, plant closures, and lead-time notices reach customers before they reach accounts. Risk teams date each statement and watch how the language shifts.
The gap those proxies fill is wide. Traditional credit ratings cover a small slice of the counterparties a risk model has to score.
Credit Benchmark, a consensus-credit intelligence provider, tracks financial counterparties for its subscribers. In its 2024 data set, 82% of asset managers carry no traditional agency rating.
A model waiting on agency ratings would score four in five of those firms as unknown. Proxy attributes give risk teams supplier financial health metrics where no rating exists.
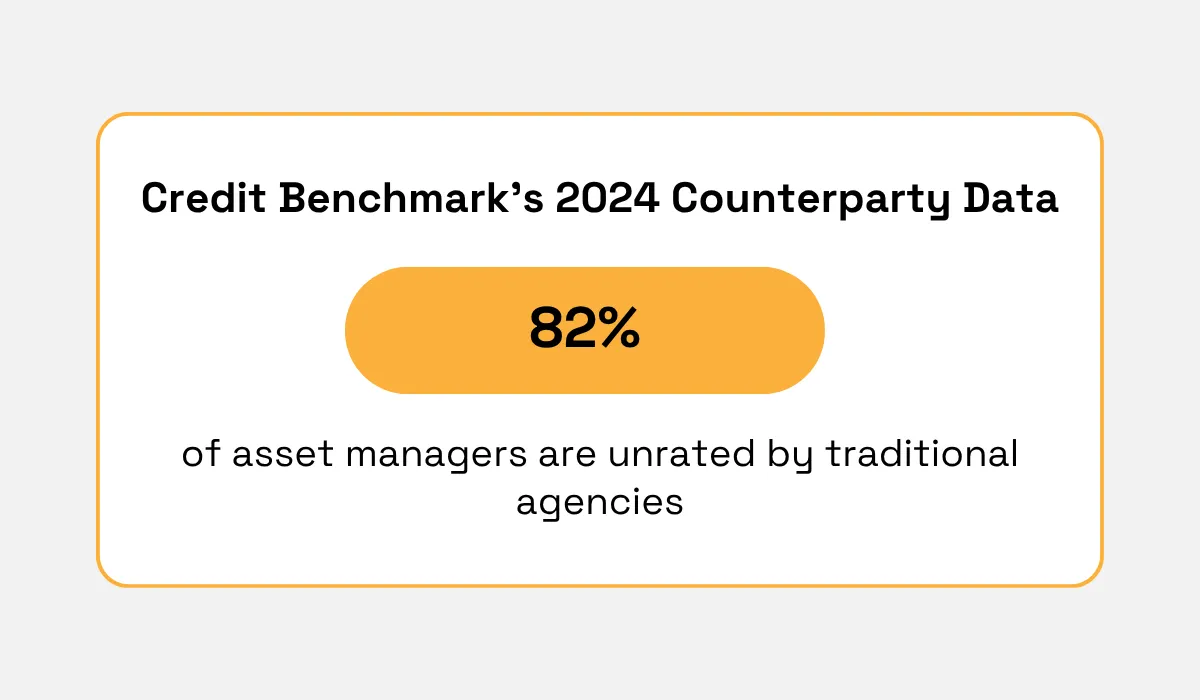
Illustration: Veridion / Data: Credit Benchmark
Fortune Brands Innovations, a home and security products manufacturer, put that approach to work. Its private suppliers publish no accounts, so the company went after the statements directly.
The company partnered with RapidRatings to collect financial statements straight from those suppliers. Income statements, balance sheets, and cash flow statements came in directly. The provider gathers private financials on a client's behalf, which removes the disclosure problem.
Those statements feed a 0 to 100 Financial Health Rating built from 73 ratios. Half the score measures efficiency, competitiveness, and profitability.
The other half measures leverage, liquidity, and earnings performance. Each ratio is weighted by how it behaved across 12 million company-years of data.
Fortune Brands ran the rating across its global private supplier base. Scores that trended downward flagged suppliers months before deliveries slipped.
Procurement used the lead time to open financial conversations while options were still open. RapidRatings publishes that the rating detects instability around 12 months before it disrupts a client.
Every input there is a data attribute, and none of it sits on a firmographic profile. A model reading ratio-level financials scores a private supplier the way agencies score public ones.
Financial proxies show how a supplier is doing. But money alone doesn't show where the risk is. Operational footprint data shows where the company actually works.
Operational Footprint Signals
Operational footprint covers where a company works, how it is structured, and who runs it. An industry code carries none of the three.
Operational footprint data covers headquarters, secondary sites, headcount changes, and leadership changes. Moves to expand or contract belong in the same set.
Operational shifts surface earlier than financial ones. A site move or a leadership change is visible months before it reaches a statement.
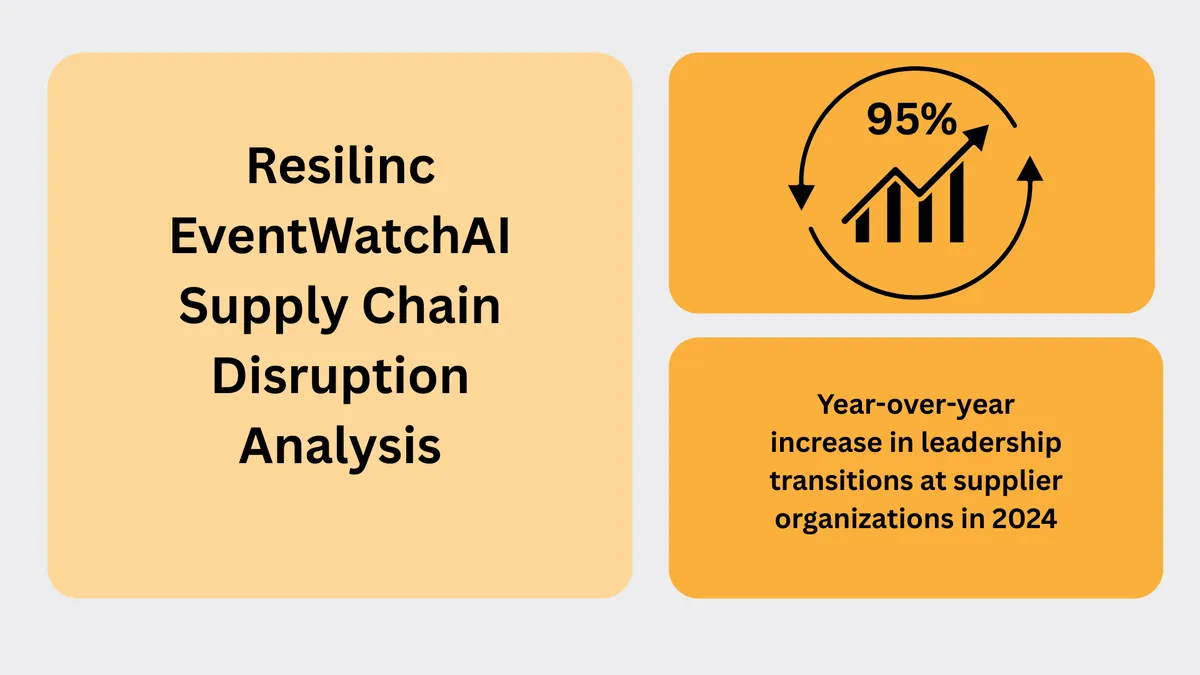
Resilinc, a supply chain resiliency platform, reports that leadership transitions surged 95% year over year in 2024 in its EventWatchAI risk monitoring database.
The surge was driven by changes at Boeing, Nestlé, Pfizer, and Intel. A new operations leader often resets sourcing terms and supplier lists within a quarter.
Combined with business sales and mergers and acquisitions, these were three of the top five drivers of supply chain disruption.
None of those signals were visible on a firmographic profile a month before they hit. That is one of the common mistakes third-party risk programs still make.
Boeing's 2024 move on Spirit AeroSystems shows how fast operational attributes can change. Spirit is a Wichita, Kansas aerostructures manufacturer that Boeing spun off in 2005.
It built fuselages for the 737, 747, 767, and 787 programs. Spirit was Boeing's exclusive fuselage supplier on all four.
In January 2024, a door plug blew off an Alaska Airlines 737 Max mid-flight.
The National Transportation Safety Board traced the fault to work performed at Spirit's Wichita plant and then completed at Boeing's Renton, Washington facility.
The four bolts securing the door plug had not been reinstalled after a repair.
Spirit had a history of quality problems. A six-week FAA audit that spring found mechanics using a hotel key card to check a door seal, and dish soap as lubricant.
On March 2, 2024, Boeing announced it would stop accepting Spirit shipments that required out-of-sequence assembly or quality rework.
A new product verification process was put in place at Spirit's Wichita factory.
Spirit's cash flows suffered. Its 10-Q for the period disclosed the impact plainly.
On July 1, 2024, Boeing announced a $4.7 billion all-stock deal to reintegrate Spirit AeroSystems, ending a two-decade outsourcing strategy.
No data attribute would have predicted four missing bolts. What the attributes carried was everything around them.
Spirit's site-level quality events and FAA audit outcome were recorded and dated. So were its cash position and its change of ownership. A model tracking those four fields watched a supplier reclassify itself inside six months.
Firmographic profiles of Spirit as “aerostructures manufacturer, 15,000 employees, Wichita HQ” carried none of that information.
Geography decides which regulators, ports, and labor rules apply to a supplier. Organizational position decides who absorbs the cost when a site stops working.
Both questions cover where the risk sits. One question is left over: whether a regulator has already acted.
Compliance records answer it. They arrive dated, jurisdictional, and tied to a named entity.
You need compliance data to tell where regulators have already flagged it.
Compliance Indicators
Certifications, licenses, regulatory filings, and enforcement actions all carry risk signals. Firmographic data misses these completely.
These are some of the areas compliance data covers:
ISO certifications | ISO 9001 (quality), ISO 14001 (environmental management), ISO 27001 (information security), ISO 45001 (occupational health and safety) |
|---|---|
Industry-specific licenses | FDA registrations, EPA permits, financial services registrations |
Regulatory filings | SEC 10-Ks, tax filings, sanctions screening lists |
Public enforcement actions | Fines, consent decrees, import alerts, warning letters |
All of these are countable, dateable, and jurisdictional.
The volume is not small.
Corlytics, a regulatory intelligence platform, tracked $19.3 billion in global regulatory fines during 2024. The figure counts penalties above $1 million issued by major regulators worldwide.
A single crypto exchange case accounts for $12.7 billion of that total. Concentration like that is why the headline amount tells a risk team almost nothing.
The signal a risk model needs is the enforcement action itself, not the fine amount. What matters is which supplier got hit, when, and where.
FDA inspection records show how compliance data travels down a supply chain. Each record attaches to a named facility, with a date and an outcome.
The agency runs close to 15,000 inspections a year. Drug and biologics work alone produced nearly 1,800 citations in 2024.
A citation against one foreign facility can reach every customer that facility serves. Those customers rarely appear in the citation itself.
In September 2025, FDA inspectors cited Hetero Labs over a warehouse in Visakhapatnam, India. The site had not been disclosed to the agency as an API storage location.
Inspectors issued a six-observation Form 483 covering storage conditions and missing documentation. The drums held active pharmaceutical ingredients bound for US-registered facilities.
The same facility makes nirmatrelvir for Pfizer's Paxlovid and diclofenac sodium for Novartis's Voltaren. Both companies source those ingredients from several manufacturers, so neither faced a shortage.
Every piece of that record is a data attribute. The facility identifier, the inspection date, the observation count, and the registration status are all structured fields.
A model reading FDA warning letters, import alerts, and certification lapses picks the event up on publication. EPA registrations and ISO lapses feed the same field.
Publication runs weeks ahead of most trade coverage. Risk teams get that window for free.
A basic profile of Hetero as a Hyderabad pharmaceutical manufacturer carries no compliance signal. Anyone who wants one goes looking in a separate register.
Checking by hand works for ten suppliers and fails at ten thousand. Compliance attributes earn their place by arriving already matched to the supplier record.
The next step is bringing all five attribute types into one place, a risk model can pull from directly.
Company Data for Risk Monitoring in One Place
Stitching technographic, ESG, financial, operational, and compliance data together from separate providers is where most enterprise risk programs stall.
Most teams bring together five separate tools, one each for cyber posture, ESG, credit, supply chain footprint, and regulatory activity.
Each tool uses its own format, its own update schedule, and its own way of identifying a company.
Reconciliation and de-duplication become the risk team's job, ahead of any modeling.
That is the problem enrichment tools were built to address.
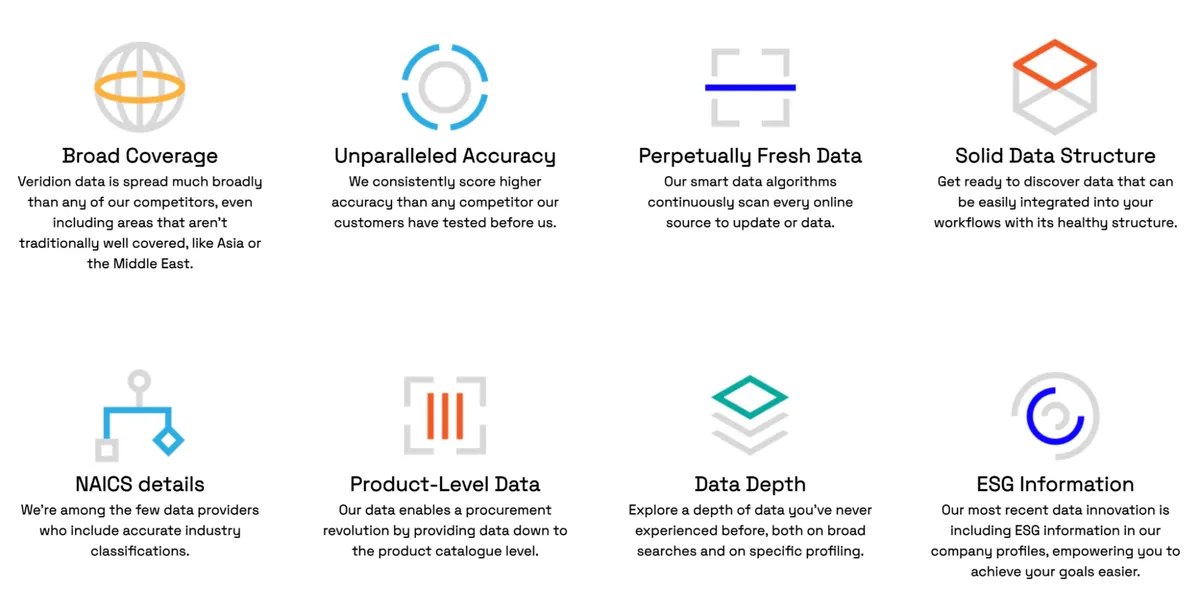
Veridion structures over 461 attributes per company profile.
Those attributes include technographics, ESG practices, financial proxies, operational footprint, and compliance indicators.
Source: Veridion
Veridion database spans 693M companies across 250 countries and territories, continuously updated as new evidence comes in.
Its delivery is via API. The data flows directly into risk models, an approach built specifically for market intelligence teams.
One query returns technographic detail, ESG activity, financial proxy scores, operational footprint changes, and compliance events, all for the same company and under the same entity ID.
Model builders can spend their time building the model, not matching up data. That's what the full data catalog offers: five types of data in one place, with no extra work needed to connect them.
The Bottom Line
Risk modeling has moved on from when industry code, size, and location did the work.
The real signal comes from several places. The systems a company runs, its behavior, its ability to pay, its location, and any regulatory flags, and so on.
Teams that build with risk models that bring those five attribute types together find themselves ahead of the next incident.
Articles
Discuss how these trends affect your organization.
Our analysts are available for a short call. Bring a specific question and we will ground it in the data.
Insights
Keep reading
More analysis, research, and outcomes grounded in live company intelligence.
What is Third Party Risk Management (TPRM)
How to protect your business from vendor-related risks? This guide on third party risk management will walk you through the essentials.
Third Party Risk Management: 6 Metrics to Track
Discover 6 key metrics to track in third party risk management to better monitor vendors, reduce exposure, and strengthen compliance.
5 Mistakes to Avoid when Managing Third Party Risk
Third party risk can break your business if mismanaged. Learn the top mistakes to avoid and how to reduce your exposure.