Insights / Articles
How to Use Company Data Signals to Find Whitespace and Expansion Markets
Tired of guessing where to expand? Uncover hidden opportunities and untapped markets using powerful company data signals.

- Whitespace is what remains when you subtract the companies already served from the companies that exist.
- Whitespace is often hidden because nobody assembles data signals at a large-enough scale.
- Whitespace could mean either opportunity or that nobody is buying, and only real buyers can tell you which it is.
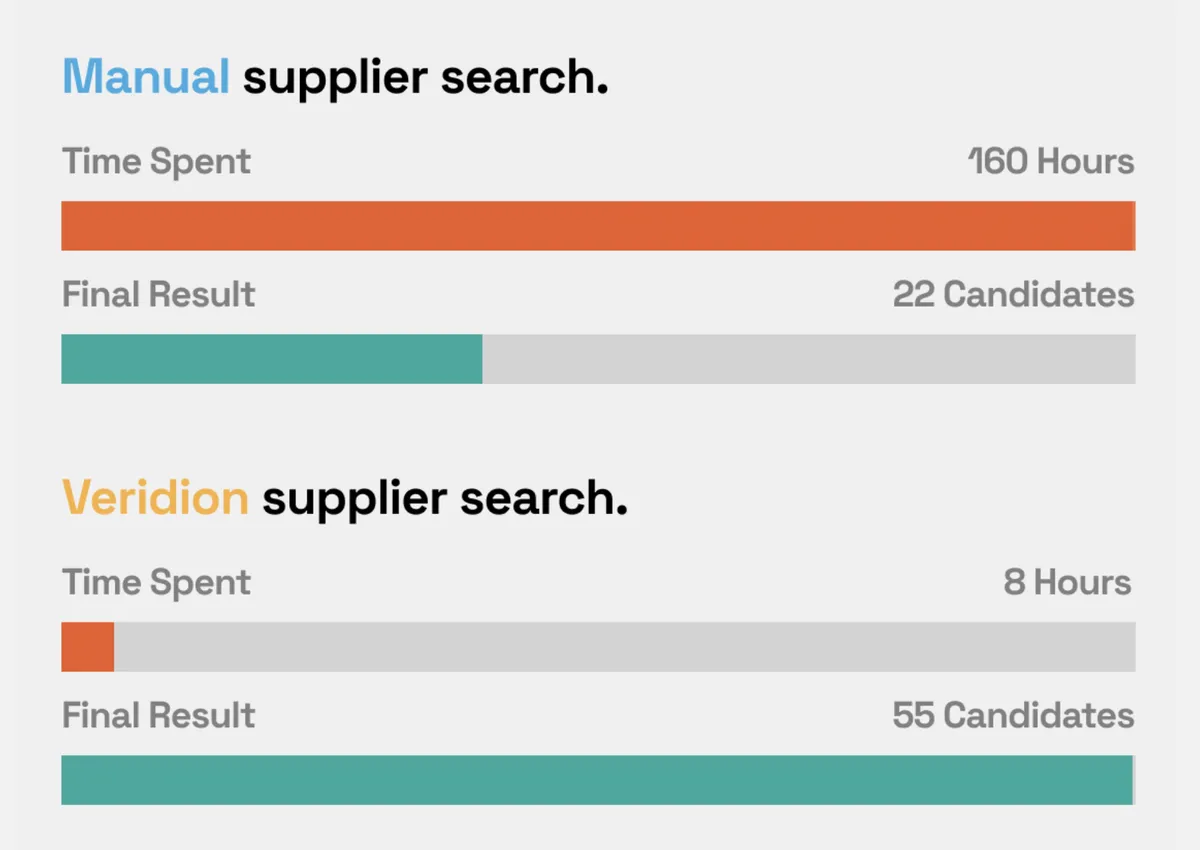
Two analysts at a global consulting firm went hunting for suppliers of Class 2 electrical transformers. They spent two weeks searching Central America and Mexico. They came back with 22 candidates.
However, the actual number of suppliers available was 55. More than half of that supplier market stayed invisible to a team paid to engage with it.
The signals were all public. Nobody had assembled them at the scale the question required.
Your next expansion market is hiding for the same reason. Here are five steps to surface it before your competitors do.
1. Define Your Expansion Goals
First, know what your expansion goal is before you look at any data. Writing your objectives down shows which markets are worth a closer look and which aren't.
If you skip that step, every market looks attractive on its own terms. One place looks great because it's growing fast while another looks great because it's big.
Every market has a growth story. Every market has a champion in your building.
Written objectives settle those arguments before they start, because a market either meets the criteria you agreed on or it doesn't.
Two terms are worth understanding before you start: whitespace and expansion market. Whitespace means the gap between what buyers need and what suppliers really offer. An expansion market is a place where closing that gap is worth the investment.
The choice of where to grow matters more than teams often realize.
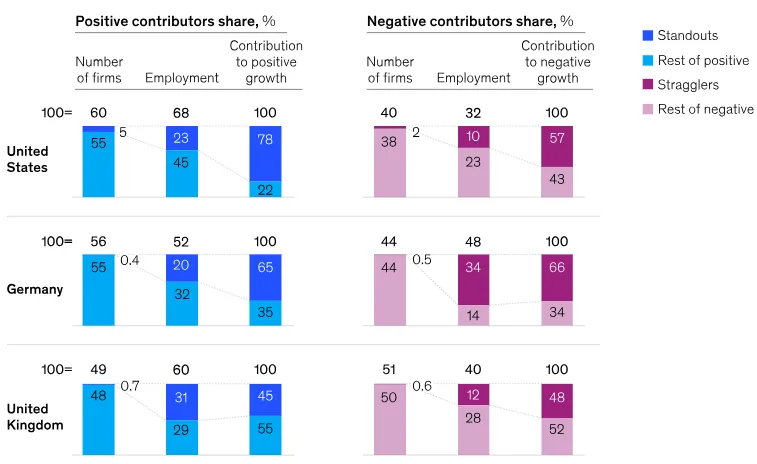
The McKinsey Global Institute studied 8,300 large firms across three economies. Fewer than 100 of these firms accounted for two-thirds of all productivity growth in the study.
Source: McKinsey Global Institute
Those standout firms weren't the most efficient in their industries. They just made bold moves instead. One of those moves is shifting portfolios toward the most productive parts of the business.
For an expansion team, that is the same decision in different words: moving money out of markets that have stopped paying and into the ones that still can.
That kind of move only happens when a company knows exactly what it's trying to achieve. So, before anything else, be clear on what expansion actually means.
Business expansion means growing a company's reach, resources, and revenue. The aim is always a bigger footprint and a stronger position in the market.
This can look like:
- Entering a new market
- Launching a new product or service
- Growing into new regions
- Acquiring another business
It can also mean scaling up operations, growing the team, or widening what you offer to reach more customers.
Expansion keeps a company relevant and competitive over time, bringing in more revenue. It also builds a stronger brand and helps lower costs as the company grows.
Once you learn why you're expanding, the next step is knowing what to look at. That's where company data signals come in.
2. Identify the Company Data Signals That Matter
Company data signals are real facts about companies in a market. They show what's happening right now. Forecasts only show what an analyst expects to happen later.
Not every data point deserves your attention. Some tell you a market is worth a closer look. Others don't really tell you anything useful.
Here are the signals worth tracking before you evaluate a new market:
Signal | What They Tell You |
|---|---|
Firmographic data | Company size, industry, and revenue show you who operates in a market and how big the opportunity really is. |
Geographic data | Where companies are based and where they operate shows you where demand is concentrated. |
Product portfolio data | What companies sell reveals gaps in the market and where competitors overlap. |
Hiring trends | A surge in job postings in a region often signals a company is investing there. |
Funding announcements | Fresh funding shows where investors see growth potential. |
Partnerships and acquisitions | These moves show where established players expect the market to grow next. |
No single signal tells the full story.
Read them in order of commitment. Funding and hiring show intent, partnerships and acquisitions show conviction, and product portfolio data shows what has already been built and sold.
Let’s take hiring data, for instance. A company builds its team before it announces a new office, launches a product, or enters a market. By the time a press release goes out, the hiring that made it possible happened months earlier.
Bain's global job market data shows that hiring patterns can shift. AI-related hiring swung from decline to double-digit monthly growth in early 2026.
Hiring volumes also vary sharply by country, with drops as steep as 25% in France and 23% in the US, while the UK and Canada saw declines of only 7%.
These are job postings, not headcount, and that gap is the point. A company advertises roles months before those people appear in any employment figure, which is what makes postings a leading signal rather than a lagging one.
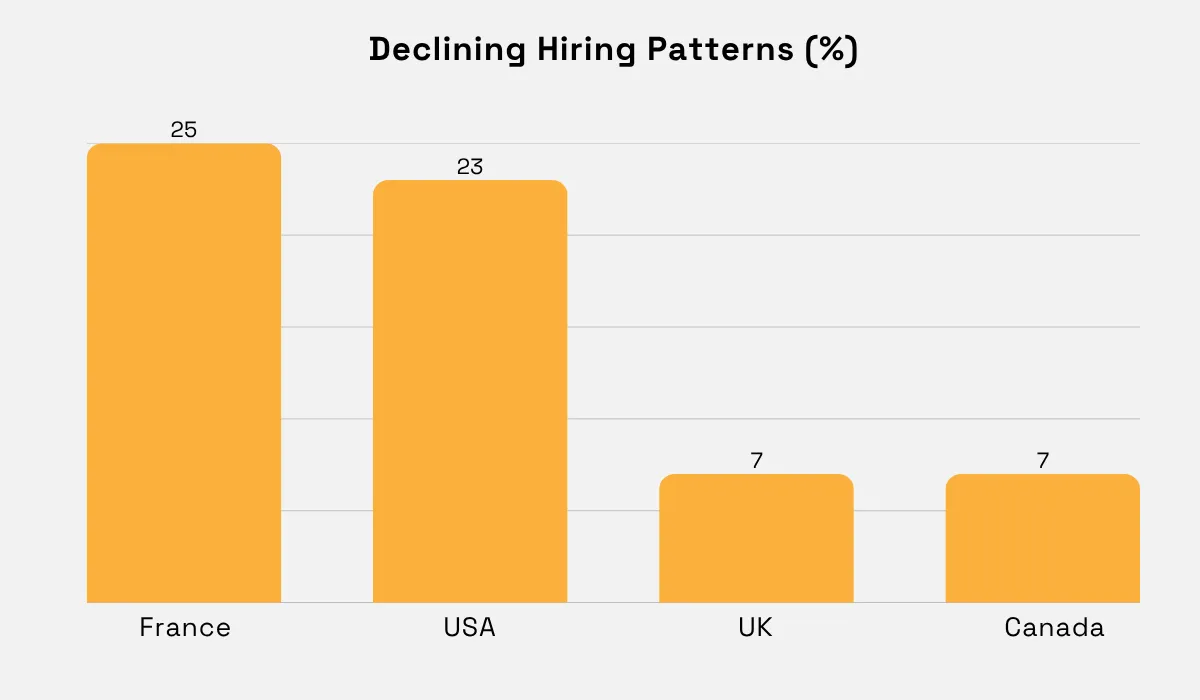
That kind of variance matters.
If hiring holds steady or grows in one region while falling everywhere else, it tells you where companies still see enough opportunity to keep investing.
No single signal tells the whole story on its own, though. The real value comes from layering hiring data with firmographic, geographic, and funding signals to see where they line up.
3. Combine Multiple Signals to Find Whitespace Opportunities
A market can look wide open in one dataset and fully saturated in another. The real picture only emerges when you put signals side by side.
Firmographic data tells you how many companies exist in a market. It does not show how many of them are already served.
Hiring data shows you where a company is investing, but not whether that market has room for another supplier.
The answer comes from looking at these signals together instead of one at a time. This is called cross-signal analysis. It layers different data points until a clear picture forms.
Starting with firmographic data, you get the total number of companies that could be your customers. Product data tells you how many of them are already buying from someone else.
Subtract one from the other, and you get your competitor coverage showing how much of the market is still open.
If a region holds 4,000 companies that fit your customer profile and 2,600 of them already buy an equivalent product, your whitespace is the remaining 1,400. Every one of them has a name.
Doing this by hand means pulling firmographic data from one source and product data from another, then reconciling the two yourself.
Most teams either skip this step or take too long to act on what they find.
Combining signals isn't just a theory.
A data-as-a-service platform does that assembly work continuously instead.
Veridion covers 693M companies across 250 countries and territories, along with 1.3B products and services indexed.
Source: Veridion
This means a competitor coverage gap doesn't stay a rough guess. It turns into an actual list of named companies you can act on.
Each piece of information in a company profile comes with three things:
- Confidence score showing reliability.
- A link to where it came from.
- Date showing when it was last checked.
A confidence score is the platform's own estimate of how likely an attribute is to be correct, based on how many independent sources agree on it.
This lets you assess the origins of the data before you trust it. You no longer have to just hope the numbers are still accurate; you can make your own judgment.
This matters because investment committees will almost certainly ask "how old is this number?"
More expansion plans fail over that one unanswered question than over bad execution.
Rich data helps you narrow down the list of markets worth considering. But it's the validation step that decides which markets actually hold up under scrutiny.
4. Validate Expansion Opportunities
An empty spot on your whitespace chart could mean opportunity. It could also mean nobody wants what you're selling there.
Before you invest, you need to know which one it is.
A proper way to start is by asking why the demand looks low. There are two reasons competitor coverage might be low. Either no one has spotted the need yet, or someone tried, and it wasn't profitable enough.
Telling those two apart is the whole job here, because the first is an opening and the second is a warning.
Talking to customers answers this faster than any data ever will. Ten honest conversations with real buyers are usually enough. They'll tell you if the problem you solve is one they'd pay to fix.
Ask each buyer what they use right now and what it costs them when that solution fails. If a buyer describes a detailed workaround, that's a sign of real demand.
If they just shrug, that's a sign the gap has stayed empty for a reason. Firmographic counts and competitor coverage can show you that a gap exists. Only real conversations with people in that market can show you if it's worth money.
When startups skip this step, they run into the top reason new businesses fail.
Company intelligence firm CB Insights studied 431 startups that shut down since 2023 and found that 43% of them failed because of poor product-market fit.
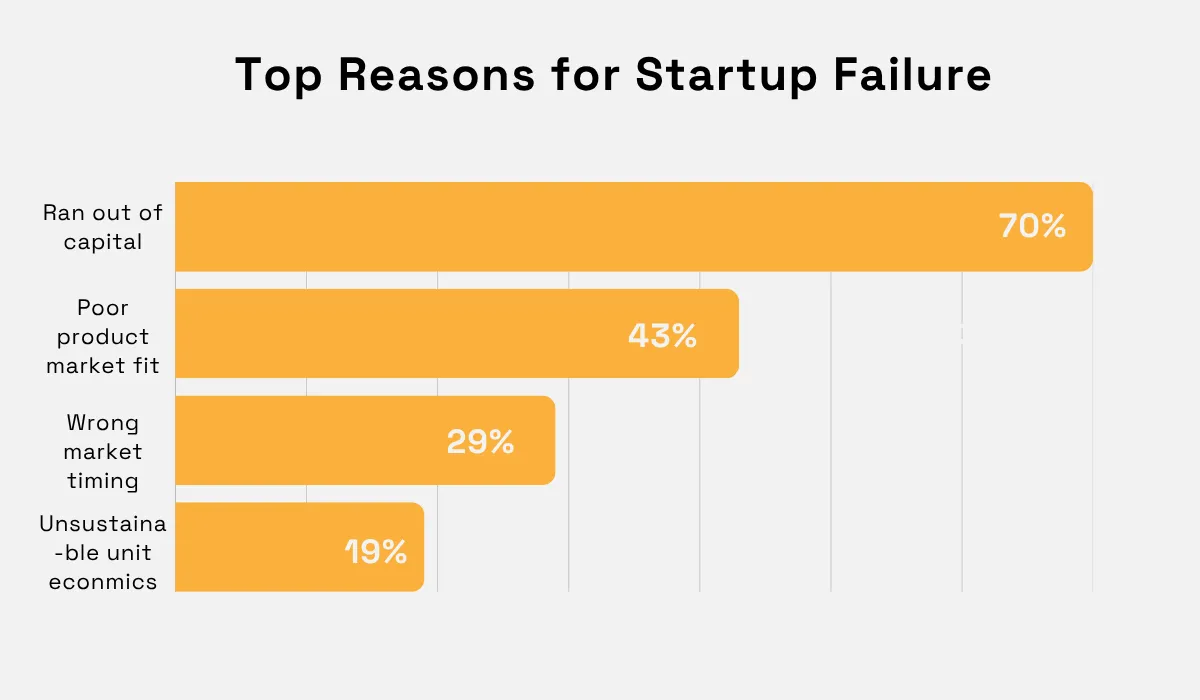
Illustration: Veridion / Data: CBINSIGHTS
These founders didn't fail because of bad code or weak marketing. They failed because they saw an empty space on a competitor matrix and assumed it meant real demand.
They spent months, sometimes millions of dollars, building a solution for that gap. Then they launched it. Their target buyers looked at it, shrugged, and went back to whatever they were doing before.
As well as checking how many competitors there are, you can also analyze how deeply those present are settled in.
A market with one competitor who owns every customer relationship can be harder to break into than a market with six competitors splitting the business.
Larger economic trends matter here too.
The World Economic Forum asked more than 11,000 executives worldwide about growth for its 2026 report. The results show which industries expect growth and which expect a harder time.
Across regions and income levels, executives pointed to high energy costs and policy instability as the two barriers holding growth back. Looking to 2030, they expect frontier technologies and the energy transition to drive it.
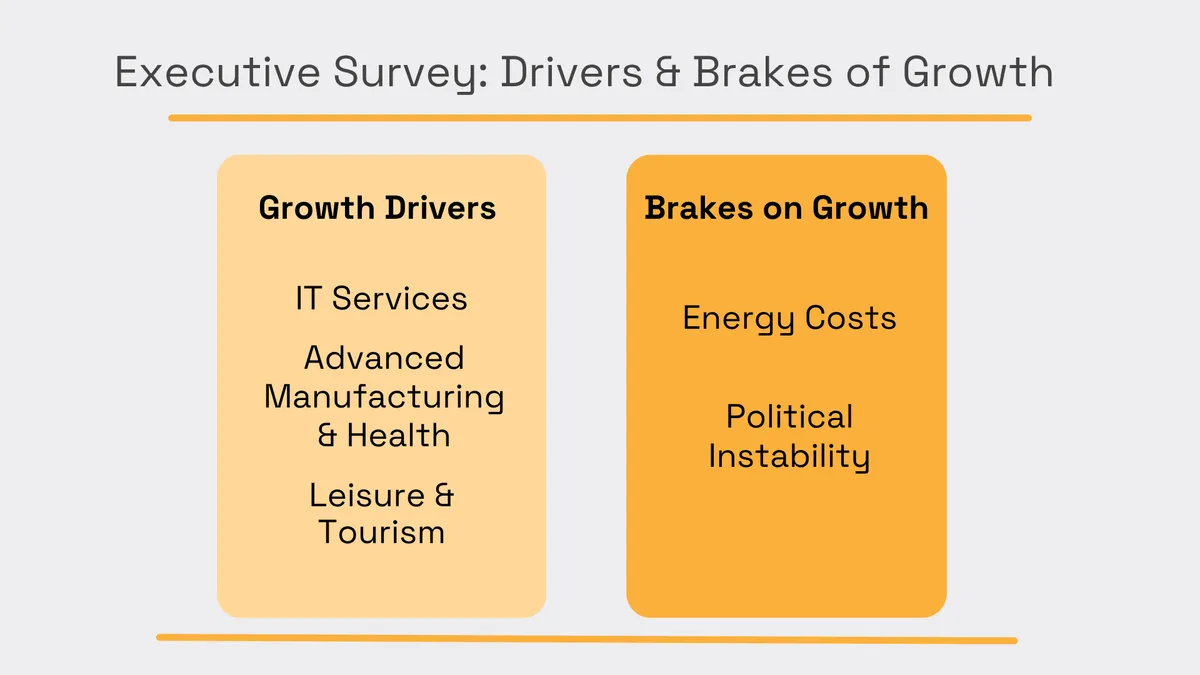
Illustration: Veridion / Data: World Economic Forum
It’s also worth bearing in mind things like currency risk and political stability. A local market can look perfect on paper and still fail because of country- or region-level issues.
Dropping weak markets early is ideal as it costs little to walk away after six weeks of research. It costs a lot more in time, money, and trust to walk away after two years of investment.
5. Prioritize Markets and Build Your Expansion Strategy
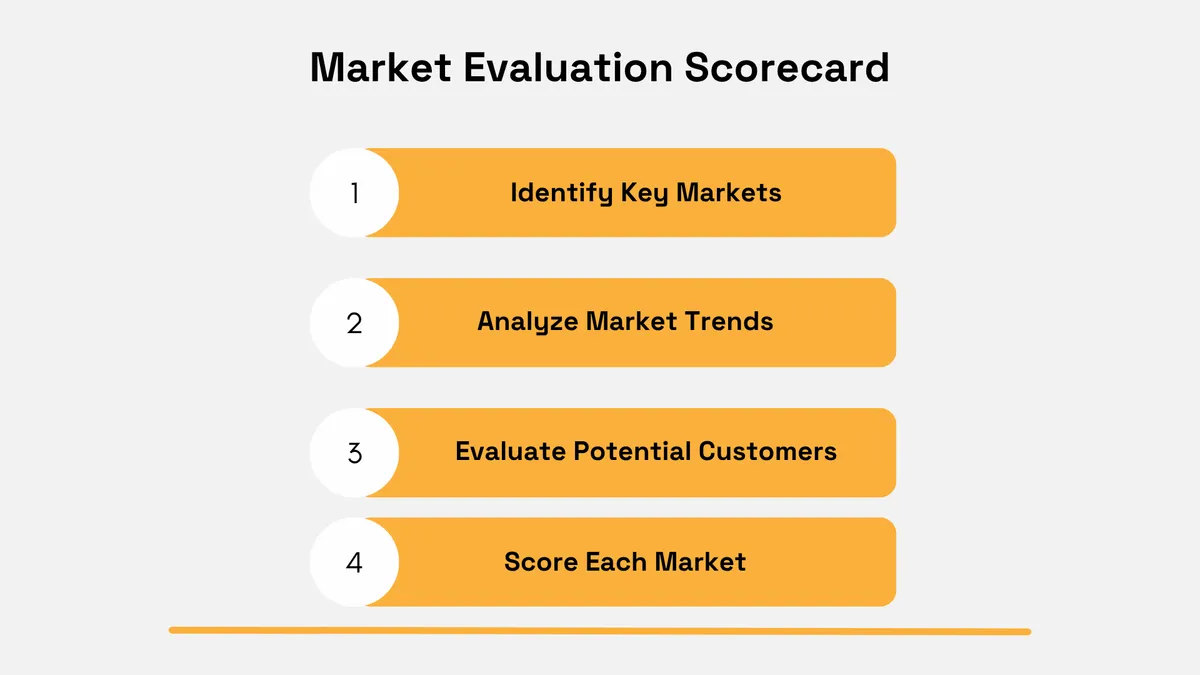
Once you have a shortlist of possible markets, you need to decide which one to pursue first. Doing some opportunity scoring helps.
You can rank markets by how well each one matches what you're looking for. Ensure the same criteria apply to every market, so the comparison stays fair.
Now, go back to the goals you set in step one: your target customer profile, your priority regions, and what counts as a good fit for your business.
Turn those into a scorecard.
Give each criterion the same weight for every market, then score every market still in the running against that same scorecard.
Source: Veridion
A market might look great on one measure, like size. But it could fail on another, like how hard it is to reach. Scoring every market the same way stops one good number from hiding a bad one.
Lock the weights before you score anything, and write down why you chose them. Any later change then has to be argued on the record instead of made quietly in a spreadsheet.
Think about things like the barriers to entry, and note how they don't all work the same way. Some come from regulations and some from how the industry is structured.
But the hardest barrier to break is trust. Incumbent companies often spend many years building trust with buyers. A better product alone won't undo that in a few months. Is trying to break up a monopoly worth the investment for you?
Illustration: Veridion / Quote: McKinsey & Company
Once your ranking holds up, turn it into a real plan. Decide the order you'll enter each market and put one person in charge of each.
After setting up the budget, decide in advance what would make you stop investing in a market; a mediocre market can eat up years of budget.
The final piece is watching your markets over time. Your scores were accurate on the day you made them, but markets change with new suppliers showing up.
Check your ranking again every few months using fresh company data. Pick three signals per market that would change its ranking if they shifted and set alerts for those.
Veridion updates its company data continuously, which means rechecking your ranking becomes routine instead of doing it once a year.
That's what makes your ranking useful long term. A market ranked fourth in January could be first by July. Expansion isn't a one-time decision. It's something you keep managing.
Conclusion
Whitespace isn't hidden. It sits right there in public company data, waiting for someone to pull it together properly.
That's why obvious markets stay crowded, while good ones stay open for the teams who actually look.
Set your goals, read the signals, test them with real buyers, and rank what's left. With this, you'll stop guessing and start choosing.
Your next market is already out there, described in the data. Read it before your competitors do.
Articles
Discuss how these trends affect your organization.
Our analysts are available for a short call. Bring a specific question and we will ground it in the data.
Insights
Keep reading
More analysis, research, and outcomes grounded in live company intelligence.
What Are the Benefits of Data Enrichment?
Want to understand the benefits of data enrichment? This guide will explain how enriched data supports better decisions and analytics.
Market Intelligence vs Market Research: What's the Difference?
Not sure whether you need market research or intelligence? Learn the key differences and when to use each.
9 Essential Sources of Market Intelligence
Want to boost your market knowledge? These 9 market intelligence sources will show you where to look and how to apply the insights.