Insights / Articles
12 Firmographic Variables That Actually Matter for B2B Targeting
In this article, you will learn which firmographic variables for B2B targeting matter most and how they help identify better-fit companies.

- Broad firmographics can hide important customer details.
- Standard firmographics like industry, size, and location miss the operational reality of a company.
- Next-gen signals like products, certifications, and ESG sharpen targeting.
- Efficient target lists never rely on a single variable working alone.
Most B2B teams still segment accounts by industry, size, and location, then wonder why conversion rates stay flat.
Firmographic data has evolved far beyond those three fields, and the companies winning enterprise deals now use a much richer set of variables.
To sharpen your B2B targeting, you need a more detailed view. These 12 firmographic variables help you identify the right accounts, understand how they operate, and align your outreach with what they are likely to need.
1. Industry & Vertical Classification
Industry classification criteria divide companies by what they do through NAICS and SIC classifications, among others. It is one of the oldest and most widely used firmographic variables, serving as a basis for almost all ideal customer profiles.
NAICS divides the economy into 20 broad sectors, then narrows down to six-digit codes for specific activities.
Here's the catch: broad categories rarely work as a targeting segment on their own. "Software" or "Manufacturing" covers thousands of companies with almost nothing in common beyond the label.
For example, one code might label a company simply as "Software," which could include anything from HR systems to cybersecurity tools.
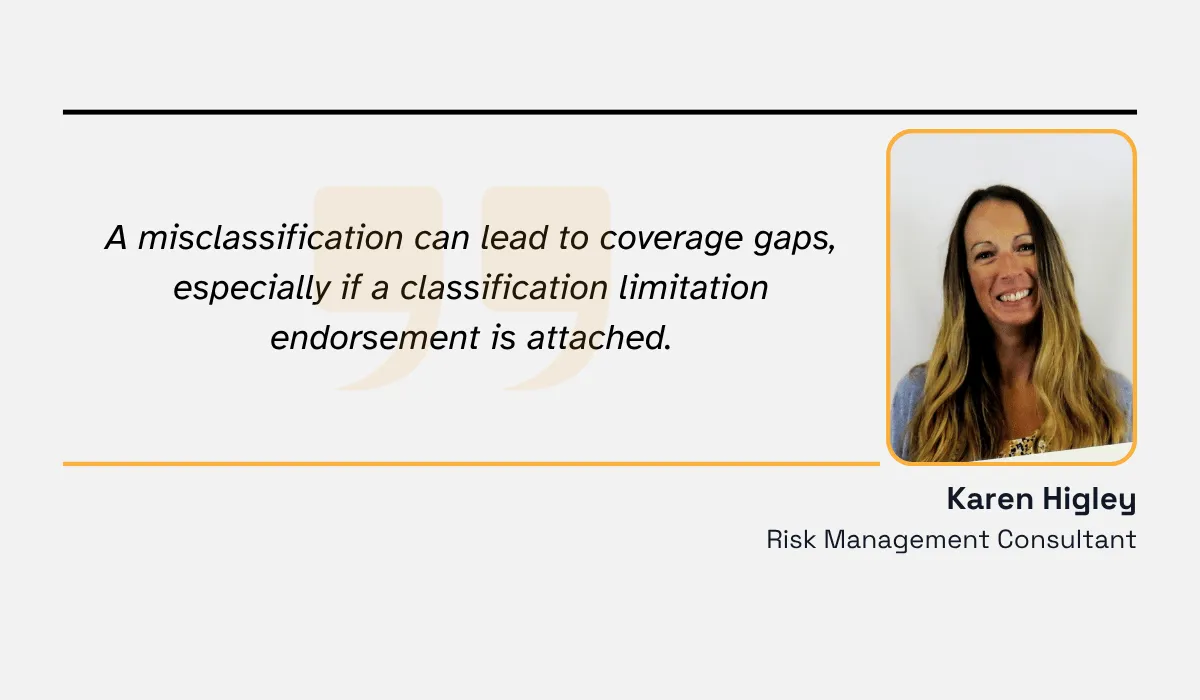
If you rely on NAICS or SIC codes only, you may end up misclassifying your entries. Misclassification leaves gaps when qualifying leads, as Risk Management Consultant Karen Higley notes:
To avoid falling into the trap, match the industry codes with other sources of information about a company (its website, news, technographic information), along with applying other filters like company size/revenue.
2. Company Size (Headcount)
Employee headcount is the traditional method of measuring company size. Standard ranges (such as 1-10, 11-50, 51-200, 201-1,000, 1,000+, and so on) are frequently used.
However, suppose two companies each have 500 employees; one has 400 engineers and 100 sales representatives, and the other has 50 engineers and 450 support people. In terms of headcount, these companies will be equal, yet their needs will differ dramatically.
The former likely needs engineering tools; the latter might need customer service solutions. In short, headcount without context can mislead.
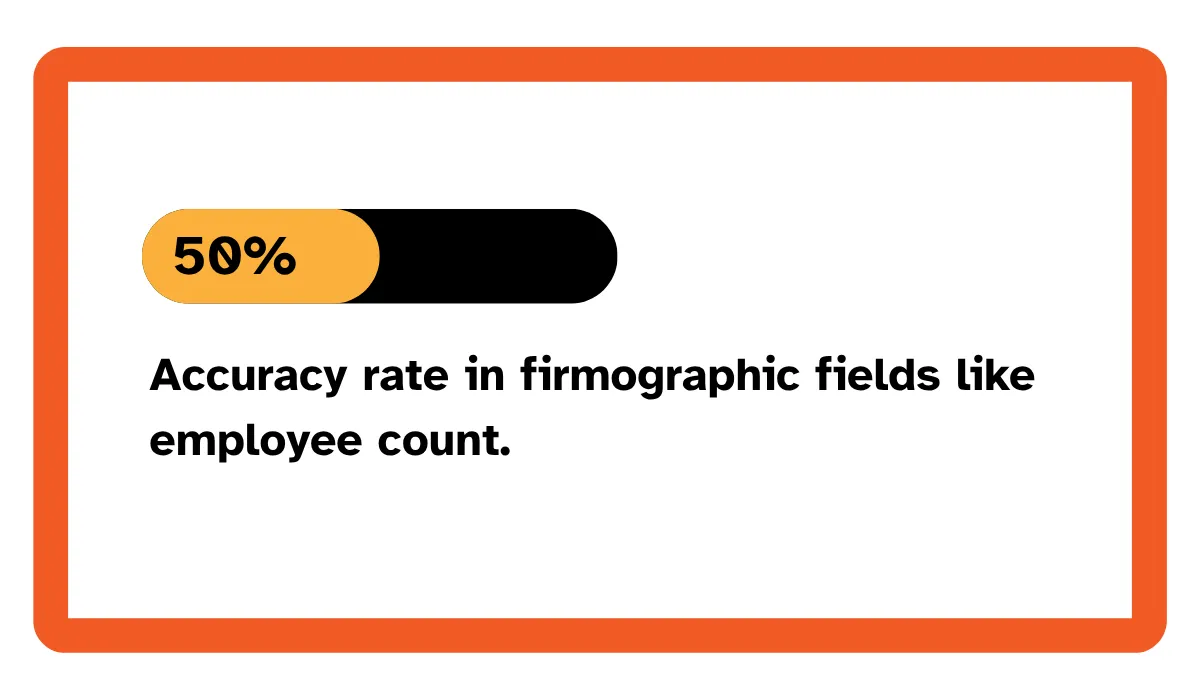
Headcount data also carries real accuracy risk. Apollo's research on B2B data platforms found that firmographic fields like employee count are modeled estimates with confidence bands, not verified facts, and accuracy rates for these fields average only around 50% depending on the source and refresh cadence.
Moreover, employee counts become outdated very rapidly due to the constant hiring/laying off process. So information obtained half a year ago may differ significantly from the current figures.
When analyzing headcount, make sure that the provider shows the last verification date and whether the number provided refers to the company as a whole or to its geographic/function unit.
3. Annual Revenue
Revenue reflects what a business can really afford. It goes together with budget authority in a way that headcount sometimes doesn't. A lean but profitable firm outspends a fat but unprofitable one.
While revenue is a powerful variable, the problem is verification. Public companies disclose revenue in SEC filings, so the number is auditable. Private companies, which make up the vast majority of any B2B total addressable market, do not have to disclose anything.
87% of US companies generating over $100 million in revenue are privately held, which means most of the revenue figures you're using to target are estimates, built from hiring data, funding history, or web signals.
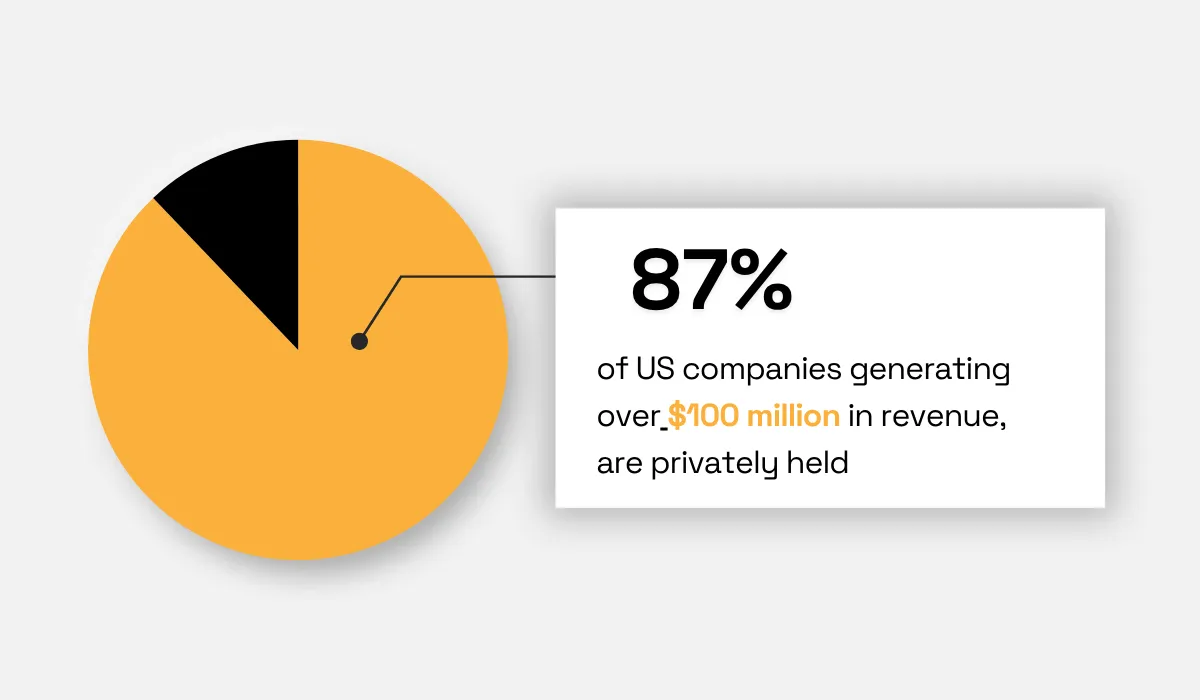
Illustration: Veridion / Data: Apollo Academy
Unfortunately, estimates from different providers routinely disagree with each other.
Cross-reference at least two independent revenue estimates, and if they differ greatly, treat revenue as a variable instead of as a fixed qualification criterion.
Pairing revenue bands with headcount will also help you see mismatches. A company with a high headcount but low estimated revenue, or vice versa, often signals a data error worth investigating.
4. Geographic Location
Location indicates where a firm is incorporated, and every list usually starts with it. But the firm's HQ is quite a poor indicator by itself because it does not say anything about its presence in dozens of other regions where it operates offices, warehouses, or sales teams.
Location matters for compliance reasons that headcount and revenue can't capture, but it should include office footprint, regional presence, and distance from your own sales territories.
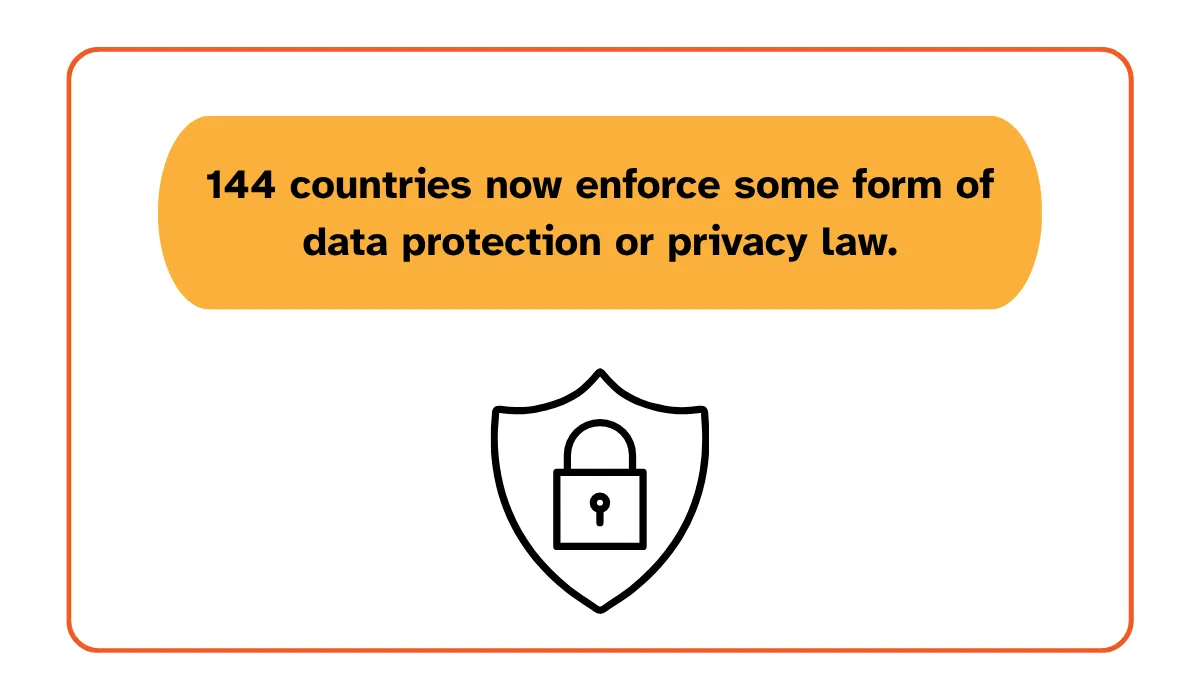
Geography also carries legal weight. Any organization that processes EU residents' data must adhere to GDPR regardless of where that organization is based.
144 countries now enforce some form of data protection or privacy law, so a company headquartered outside Europe can easily fall under compliance requirements it doesn't expect.
Territory planning that only looks at HQ location misses both the compliance angle and the real footprint.
Map both office and facility locations, not just the official address, before assigning territory or designing a region-based campaign.
5. Funding Status & Stage
The level of funding determines what the company can afford to do and how it uses the funds. At the seed and Series A stage, the firm will invest in product development, hiring, and setting up initial infrastructure.
For later-stage and publicly traded firms, the focus shifts to efficiency and infrastructure for compliance purposes.
That is why there is high value in approaching these types of companies soon after they make a new funding announcement, because the budget is still fresh and the urgency to purchase is high.
But funding alone isn't a green light. Only 48% of seed-funded startups go on to raise a follow-on round, so stage has to be read alongside trajectory, not as a standalone signal of momentum.
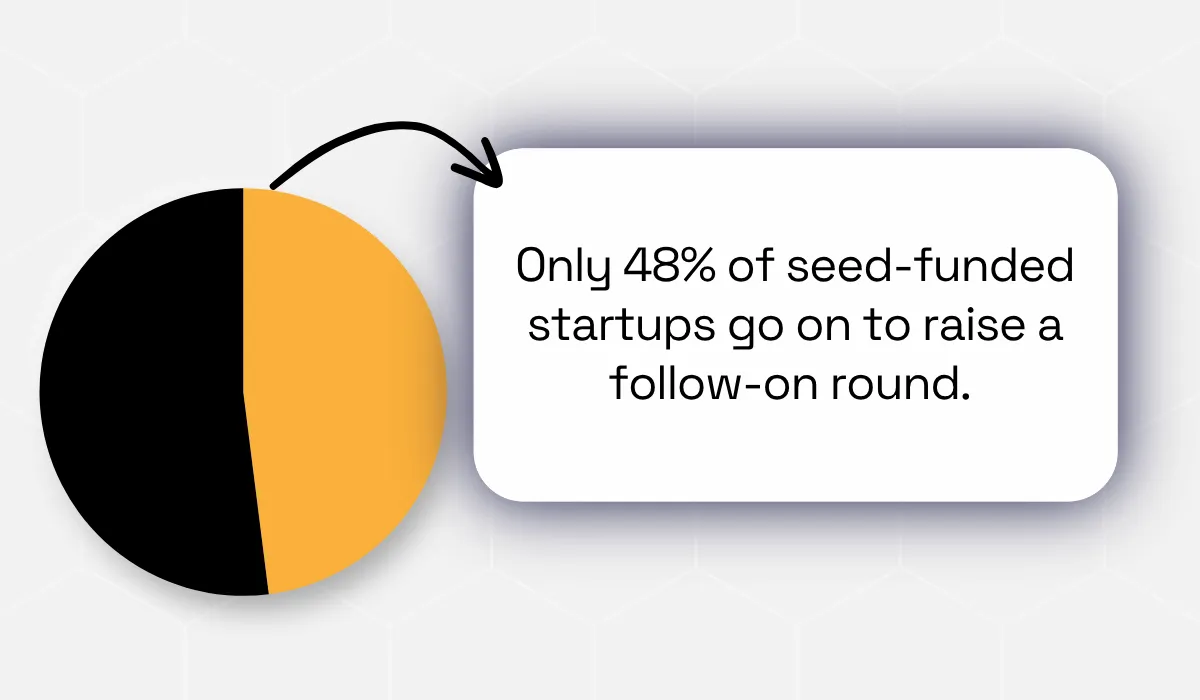
Illustration: Veridion / Data: CB Insights
Hence, funding recency matters more than the total amount raised historically for timing purposes.
A company that raised a large round two years ago has likely already deployed that capital into existing vendor relationships, while a company that just closed a round is actively shopping.
Monitor funding events not only as a classification but as a trigger in real time. Also, monitor employee count to prove that the firm is scaling into the new funds.
6. Ownership Structure
Ownership type—public, private, VC-backed, PE-backed, family-owned, or government and nonprofit—shapes who actually holds budget authority and how long decisions take to make.
For example, public companies face pressure from quarterly reporting and follow formal procurement processes, while nonprofits operate according to board-approved budgets.
PE firms can capture 20 to 30% of full potential procurement savings within the first 90 days of closing a deal.
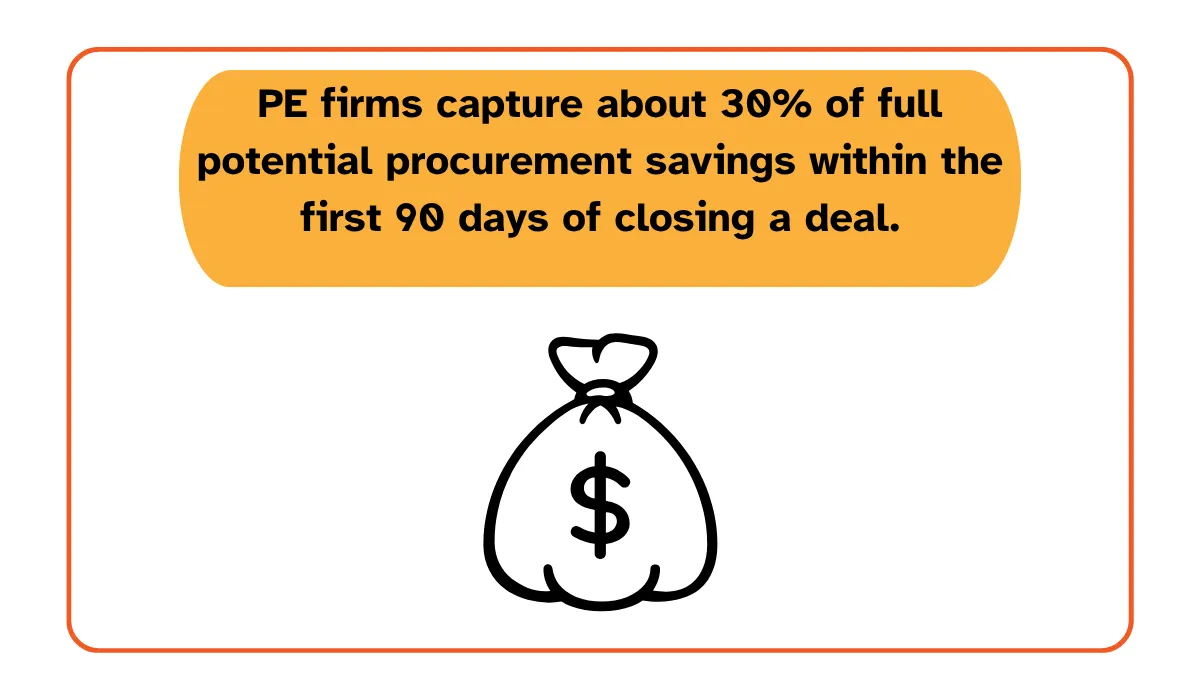
That speed only happens because sourcing decisions get centralized at the firm level fast, sometimes before the portfolio company's own team has settled into the new ownership.
Corporate hierarchy makes things even trickier: a subsidiary's organizational structure can differ completely from the parent’s. Navigating that gap to find the actual decision-maker is often what separates a good deal from a wasted sales cycle.
Before you build outreach sequences by ownership type, confirm you're looking at the ownership structure of the actual buying entity, not just the top of its corporate tree.
7. Growth Trajectory
Growth trajectory describes the direction a company is heading, startup, scale-up, mature, or declining, rather than a fixed point in time the way size or revenue does.
This distinction matters because raw size doesn't tell you what a company needs next. A business with 500 employees could either be an aggressive scalper or already in the mature growth stage, and the employee headcount alone can't tell you which.
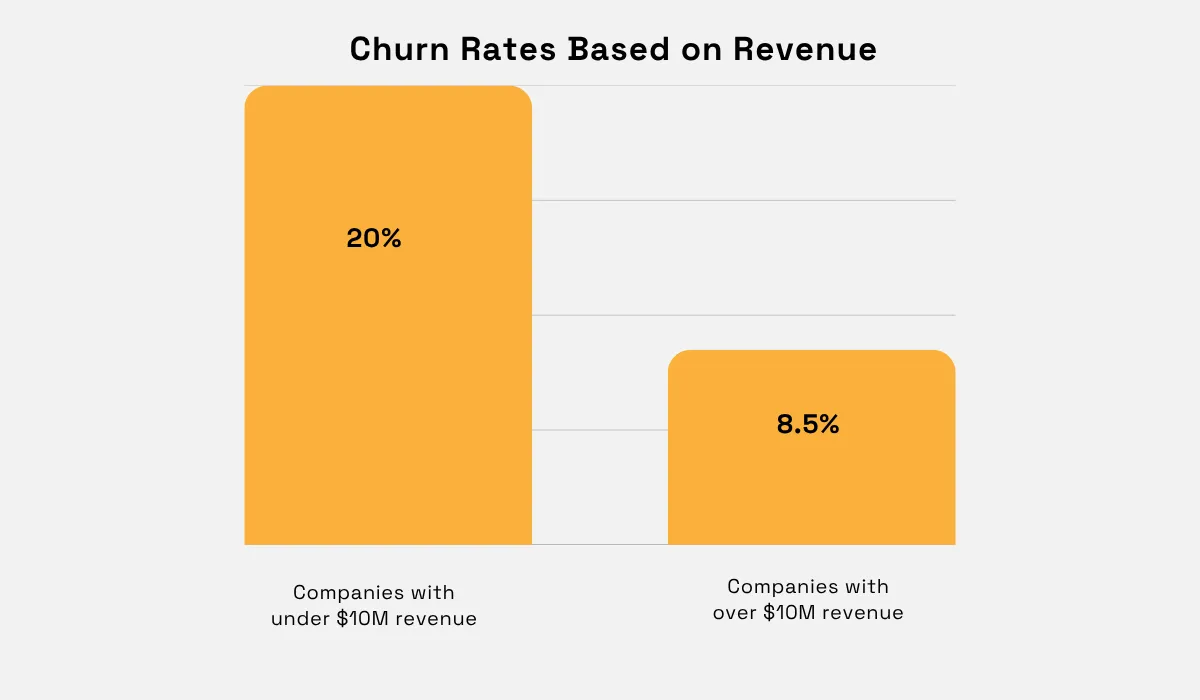
Vendor churn is a great indicator of the buying behavior gap. Companies under $10 million in revenue churn software at more than double the rate of larger, more established companies, which tracks with what you'd expect: earlier-stage, faster-growing companies outgrow tools quickly and swap vendors far more often than mature ones.
Businesses scaling up focus on software that is built for quick onboarding and self-service adoption, and requires very little implementation effort.
The growth trajectory signal should always be used in conjunction with other real-time signals such as the hiring pace and recent funding rounds.
Monitor these signals over a rolling period such as quarter-over-quarter change in the employee headcount.
8. Corporate & Legal Structure
A company can operate as a standalone business, a subsidiary, a franchise location, or a holding company, and each structure changes who actually has buying authority.
For example, knowing a customer is a division of a larger group means many things: procurement may be centralized, deal size may roll up to the parent, and risk for each unit differs.
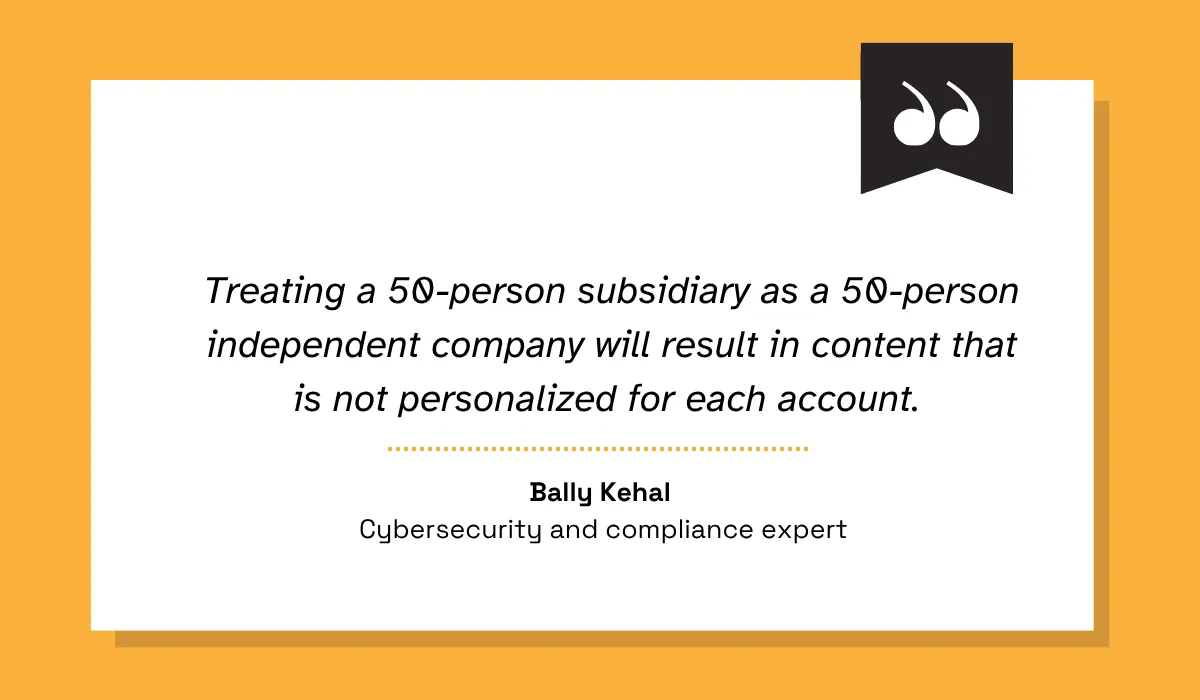
Treating a subsidiary as an independent target, without understanding its relationship to a parent company, routinely leads to miscategorized deal size or outreach that never reaches the person who can say yes.
As Bally Kehal, a cybersecurity and compliance expert, explains:
Similarly, franchise locations usually have less autonomy. A single franchise location can have very different purchasing authority than a corporate-owned one in the same chain, even under the identical brand name on the sign outside.
Apply account classifications according to the corporate structure. For example, if the targeted account is a subsidiary, then its parents must be accounted for in the ICP. In case it's a franchise, collaborate with the national office.
9. Products & Services Portfolio
What a company actually makes or sells—down to specific product lines, materials, or service offerings—reveals operational needs that an industry code alone simply cannot capture.
Two companies can share the exact same NAICS code and have almost nothing in common commercially.
Product-level data reveals a company's real specialization within a broad industry, telling you not just that a company manufactures chemicals, but which specific chemicals, in what quantities, and for which end markets.
Changing product mixes are also outrunning classification systems. According to McKinsey, SKU counts among North American manufacturers grew 66% in just three years.
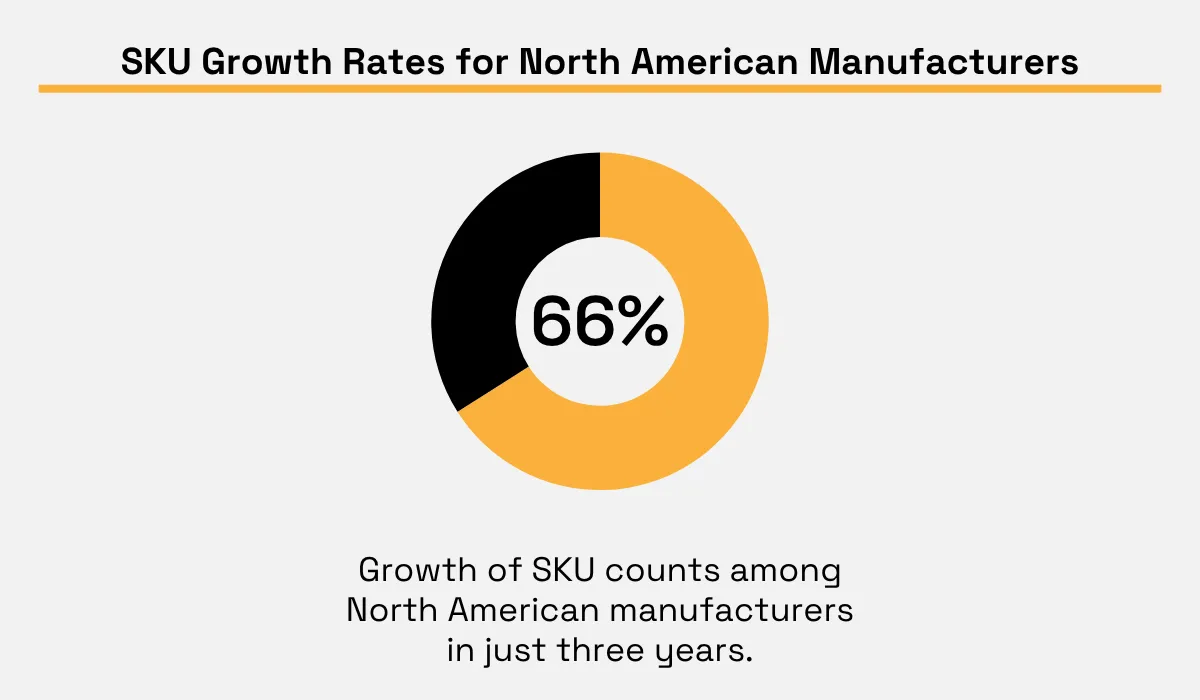
This means a company's real specialization today may already look different from what its industry code or last year's product line suggested.
It's therefore vital to watch for product portfolio changes the same way you'd watch for a funding event. Such changes often predict new categories of spend before headcount or revenue data catches up.
10. Certifications & Compliance Signals
Any certification (quality, safety, environment, industry, etc.) serves as firmographic data by itself, which shows the company's operational maturity and the requirements it upholds.
Certifications can be a stronger predictor of vendor readiness than company size alone. A company that has already gone through ISO 9001 certification has, by definition, built a formal quality management system with documented supplier evaluation processes, which means it's more likely to already have a structured procurement workflow ready to evaluate you as a vendor.
Survey data from China's national accreditation body found that 93% of surveyed buyers treat ISO 9001 certification as an important factor in supplier selection, and 98% of certified suppliers said the investment in certification was worthwhile.
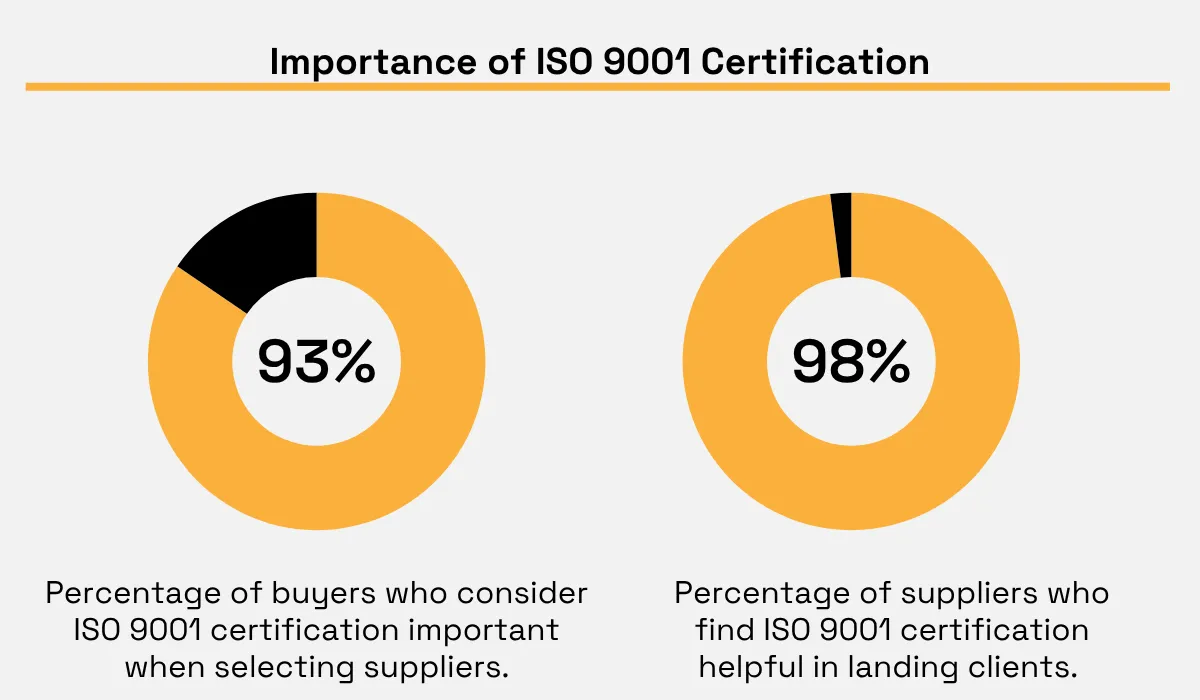
That level of buyer reliance on certification status makes it a meaningful filter for B2B teams selling into procurement-heavy industries like manufacturing, aerospace, and industrial services.
Filter for relevant certifications as a proxy for procurement sophistication, not just as a compliance checkbox. It often predicts how smoothly a deal moves through evaluation.
11. ESG Risk Signals
ESG attributes have now become firmographic data in their own right. They are mainly used by procurement, financial services, and insurance teams when evaluating a company's ESG posture before starting work with it.
The problem is coverage. Small and midsize businesses make up roughly 90% of companies worldwide but account for only about 10% of the reports in major sustainability disclosure databases.
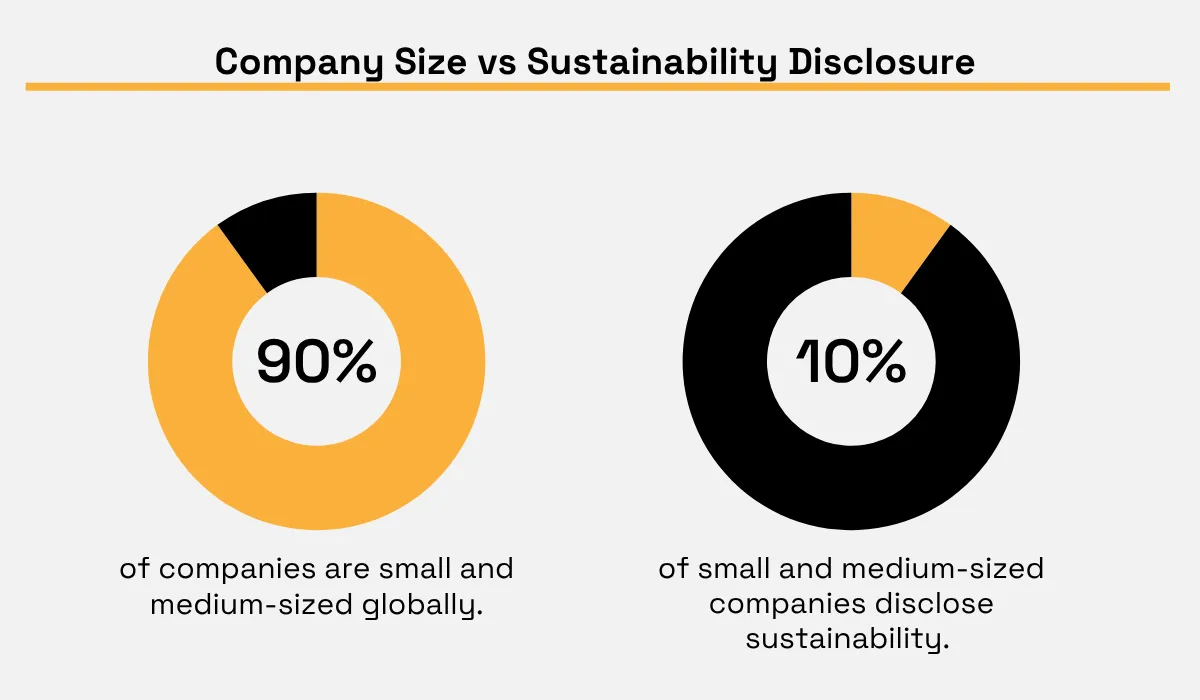
Illustration: Veridion / Data: Conservice ESG
Most ESG data infrastructure was built for the largest, most visible companies, which is exactly the segment least likely to be a typical mid-market B2B target.
An aggregated ESG metric, as a single number, tells a lot less than you may think. The disaggregated ESG data by criterion makes filtering possible based on the single requirement that's important for your particular use case, e.g., labor practices for a supply chain assessment, as opposed to a black-box overall ESG score.
When requesting ESG data at a criterion level, do so whenever it is used to meet the particular compliance or supplier qualification requirement.
12. Operational Footprint & Facility Data
A company's operational footprint (number, type, and function of its physical locations) reveals complexity that headcount or revenue can't show on their own.
Roughly 2 million of the 8.5 million business establishments the Census Bureau tracks belong to multi-unit enterprises.
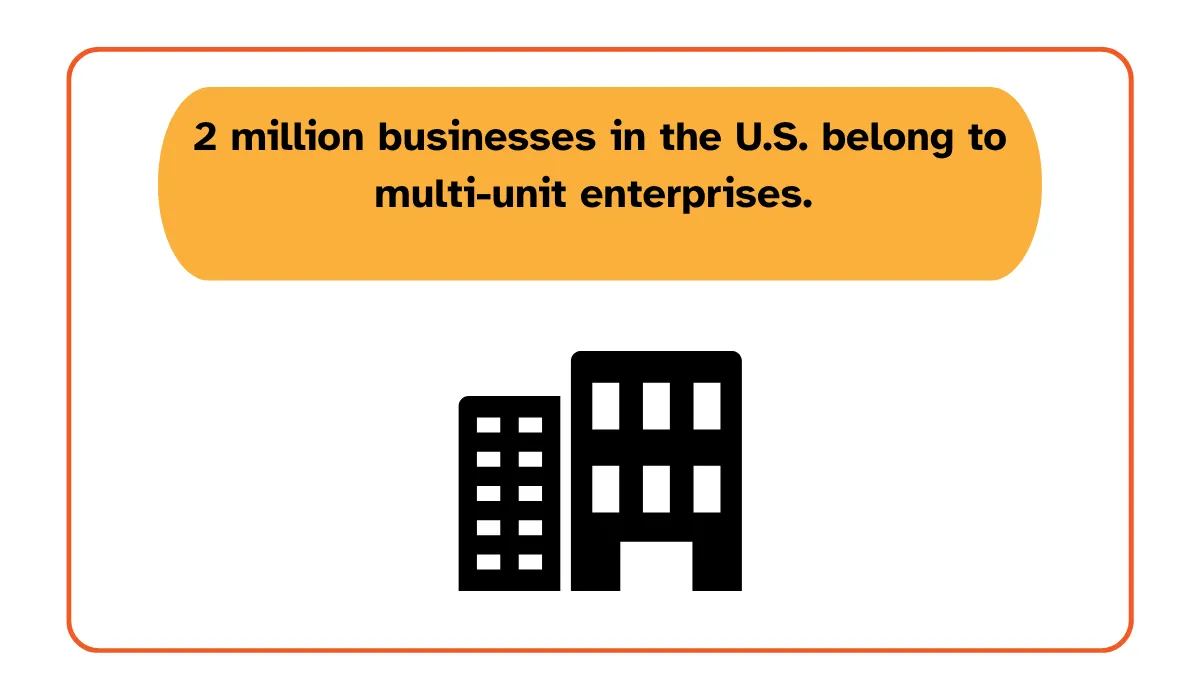
Illustration: Veridion / Data: U.S. Census Bureau
This means that a considerable share of businesses you'll target operate across more than one physical site, whether or not that shows up on the account record.
In industries where physical presence is the decisive factor in the risk assessment, it is particularly important. Two companies with identical revenue can have completely different operational risk profiles depending on their facility mix.
A software company operating out of a single office in its headquarters is fundamentally different from an industrial company running a dozen manufacturing facilities in different countries in terms of operational risk and complexity, despite having an identical annual revenue reported.
So, when operational complexity matters to your ICP, include facility count, facility type, geographic distribution, and site function alongside traditional company-level variables.
Veridion: A Reliable Source of Next-Gen Firmographics
Traditional firmographics (industry, size, revenue, location, funding, ownership, growth, and corporate structure) give you useful starting points. Modern B2B targeting often requires considerably more detail.
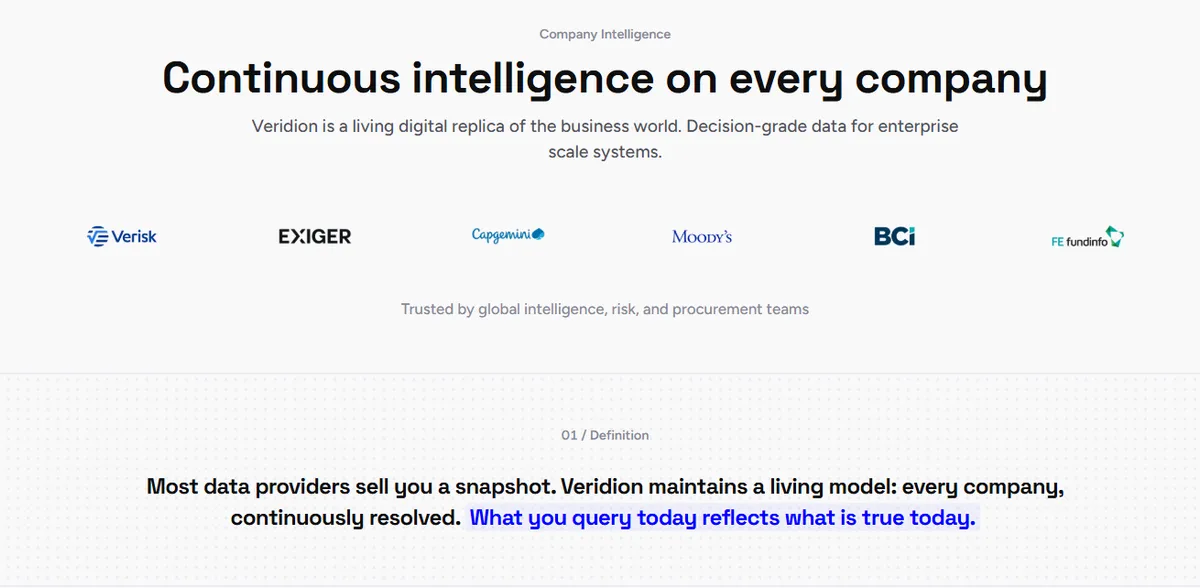
Veridion combines traditional company attributes with deeper information about products, services, corporate relationships, certifications, ESG characteristics, and physical locations.
Source: Veridion
The platform's data comes from hundreds of registries and continuous web sourcing, refreshed on an ongoing basis rather than a quarterly or annual cycle. As a result, a search reflects the market as it stands today, not a snapshot from months ago.
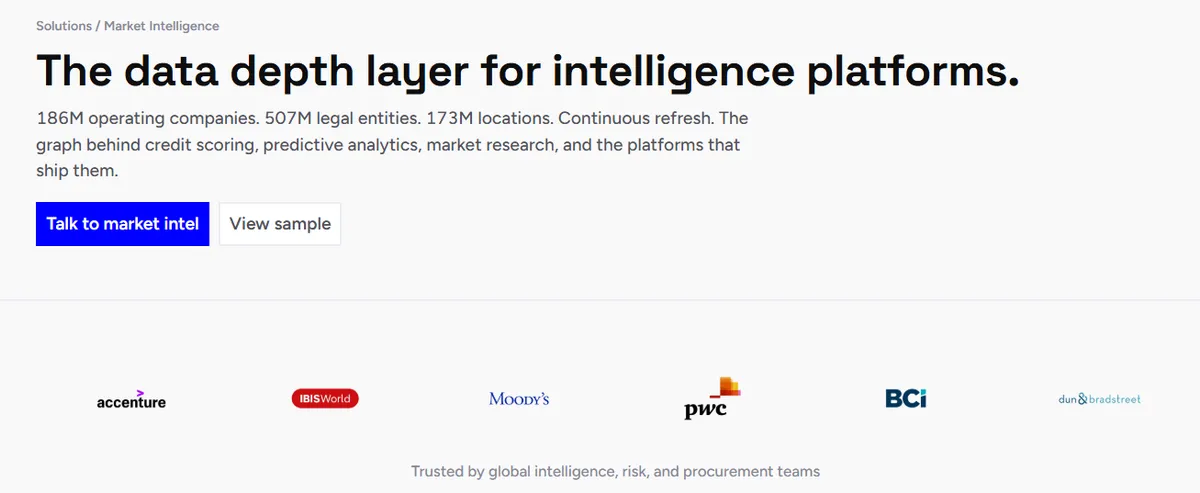
The data collection approach also differs from manual company research. Veridion’s AI and proprietary machine learning models continuously scan websites, news outlets, reports, and other digital sources and transform the information into structured company data.
Source: Veridion
That makes it possible to go beyond the standard firmographic variables. Instead of stopping at industry, employee count, revenue, and headquarters, you can evaluate what a company sells, where it operates, which standards it follows, and how it fits into a wider corporate group.
Conclusion
Firmographic targeting becomes truly useful when used in combination with several metrics.
Revenue, size, and industry get you a basic list. However, certifications, products, ownership, and operational footprint distinguish an actual qualified target account from an illusion created by a spreadsheet.
Build your ICP around the combination of signals that actually predicts conversion for your business, keep your data fresh, and you'll spend far less time chasing accounts that were never a real fit.
Articles
Discuss how these trends affect your organization.
Our analysts are available for a short call. Bring a specific question and we will ground it in the data.
Insights
Keep reading
More analysis, research, and outcomes grounded in live company intelligence.
Looking for a Global Data Collection Partner? These Companies are Worth Considering
Looking for a global data collection partner? This guide will introduce companies worth considering and explain what sets them apart.
Which Online Business Data Providers Stand Out in Today's Market?
This article will highlight online business data providers that businesses trust for accurate company information and actionable insights.
A Closer Look at the Data Enrichment Providers Businesses Trust Most
We will take a closer look at data enrichment providers and show how they help organizations build more accurate and complete datasets.