Insights / Articles
Sizing the Opportunity: How Bottom-Up Company Data Sharpens TAM and Market Sizing
Struggling with inaccurate market sizing? Learn how bottom-up company data reveals crucial market signals for strategic planning.

- Top-down sizing produces results quickly, but it relies on assumed percentages.
- Bottom-up sizing starts from a countable list of companies, which makes it far easier to defend in front of stakeholders.
- Nearly 80% of data teams are stuck on data preparation.
Most market size slides start with a figure pulled from an industry report and end with a percentage nobody can explain.
It looks convincing until someone asks where the data came from.
In this article, we'll cover why top-down estimates fall apart under questioning, and how to build a market size from real companies instead.
Why Top-Down Estimates Fall Short
Top-down sizing is still the default process, mostly because it's quick.
You take a published market figure, apply a share you assume is yours, and you have an impressive number worth putting on a slide, all without touching proprietary data.
As we'll see next, that convenience comes with some real limitations.
Built on Broad Industry Averages
The first problem shows up in how the number gets built.
Top-down sizing starts with a large published market figure, usually from an industry report, and then applies a share you assume you can win.
With this approach, the whole estimate rests on assumptions.
Sramana Mitra, founder of the 1Mby1M accelerator, has reviewed thousands of these models, and she's blunt about what she keeps seeing.
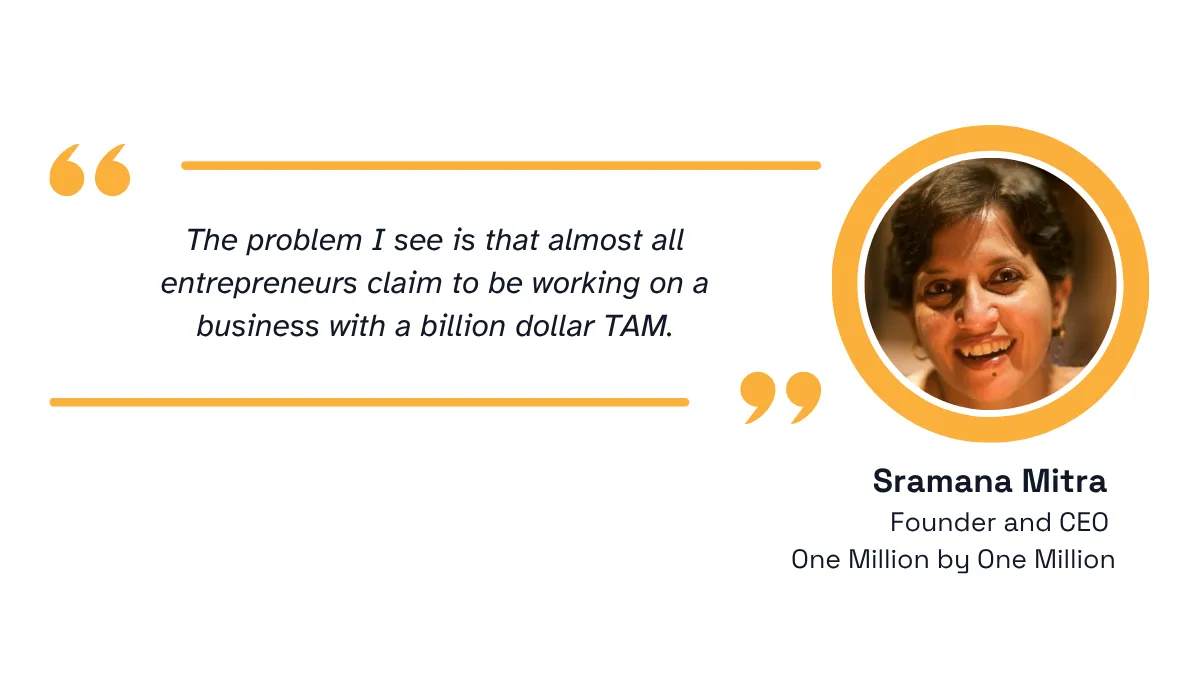
Illustration: Veridion / Quote: Sramana Mitra
Total addressable market (TAM) is meant to describe the full revenue opportunity if you won every possible customer.
Mitra's point is that these figures get bloated when founders haven't defined an ideal customer profile (ICP) or segmented the market properly.
Without that work, the number ends up describing an industry instead of a business.
The TechCrunch team ran into exactly this while reviewing Vori's pitch deck.
Their full analysis is worth reading, but the takeaways are shown below.
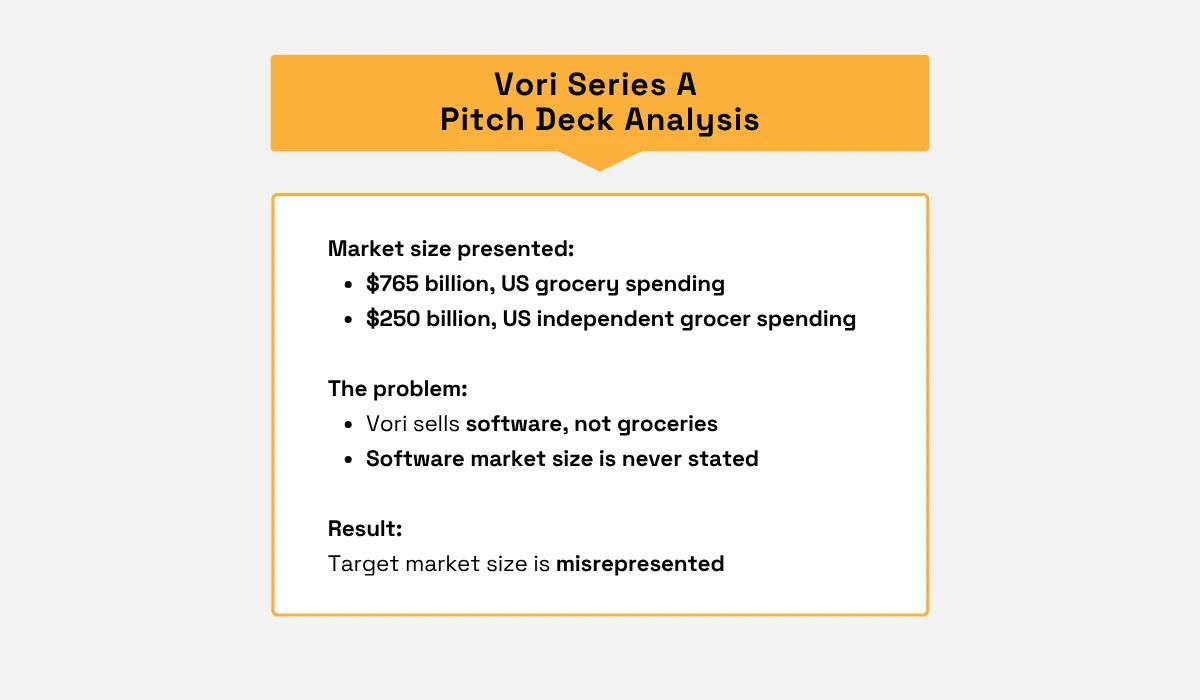
Illustration: Veridion / Data: TechCrunch
Vori builds software for grocery stores.
The deck presented the entire value of US grocery spending as the market, which is what shoppers hand over at checkout counters.
What grocers spend on software is a completely different figure, and the deck never gave it.
You'll see the same pattern anywhere an industry figure gets mistaken for a product's market.
The real market is very often just a fraction of those numbers, and the data is rarely presented in a way to show which fraction.
Blind to Segment-Level Reality
A single industry-wide percentage also treats every company in that industry as an equally good customer.
In practice, most of them aren't.
Some are too small to buy anything, some sit in the wrong country, and some don't run the systems your product depends on.
HG Insights worked through a useful example of this using their own data.
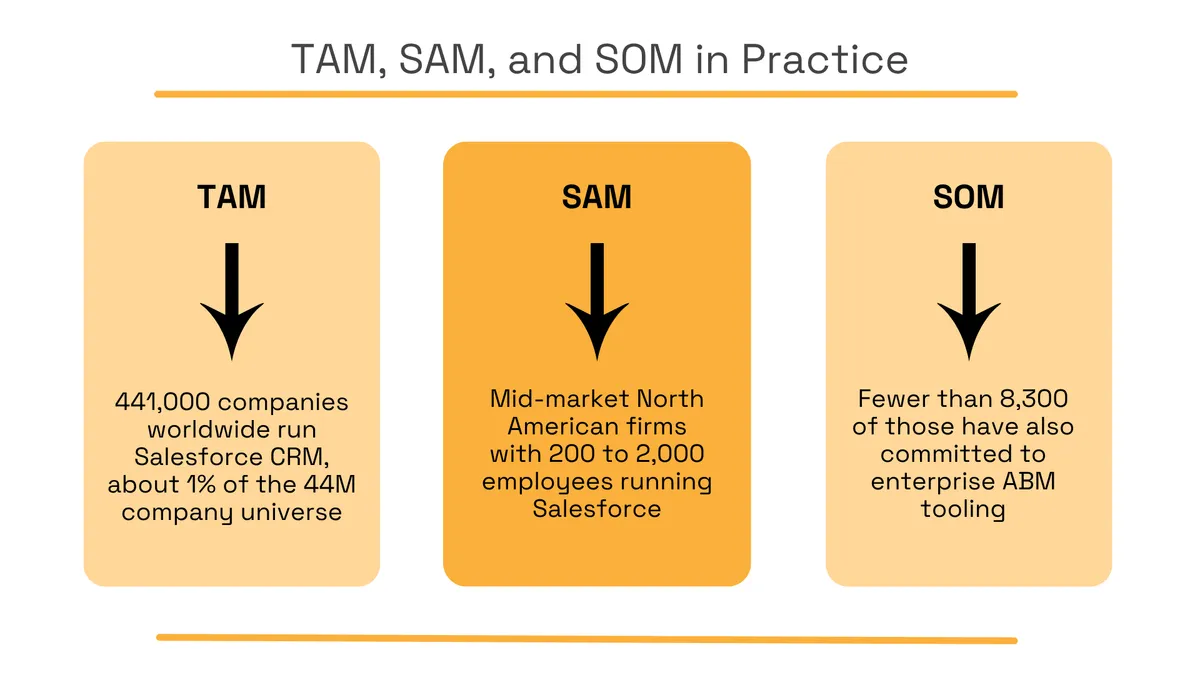
Illustration: Veridion / Data: HGInsights
They started from every company running a particular CRM, which sounds like a sensible universe to work with.
But, once they narrowed the companies by location and size, the figure dropped to reveal a more specific Serviceable Addressable Market (SAM).
Finally, the Serviceable Obtainable Market (SOM) figure of around 8,300 companies is the one worth planning against, and a top-down estimate never surfaces it.
Getting these realistic estimations means accounting for criteria like the following:
- Company size and employee count
- Geography and regulatory market
- Sub-industry within the broader sector
- Technology already deployed
- Buying model, whether direct or through partners
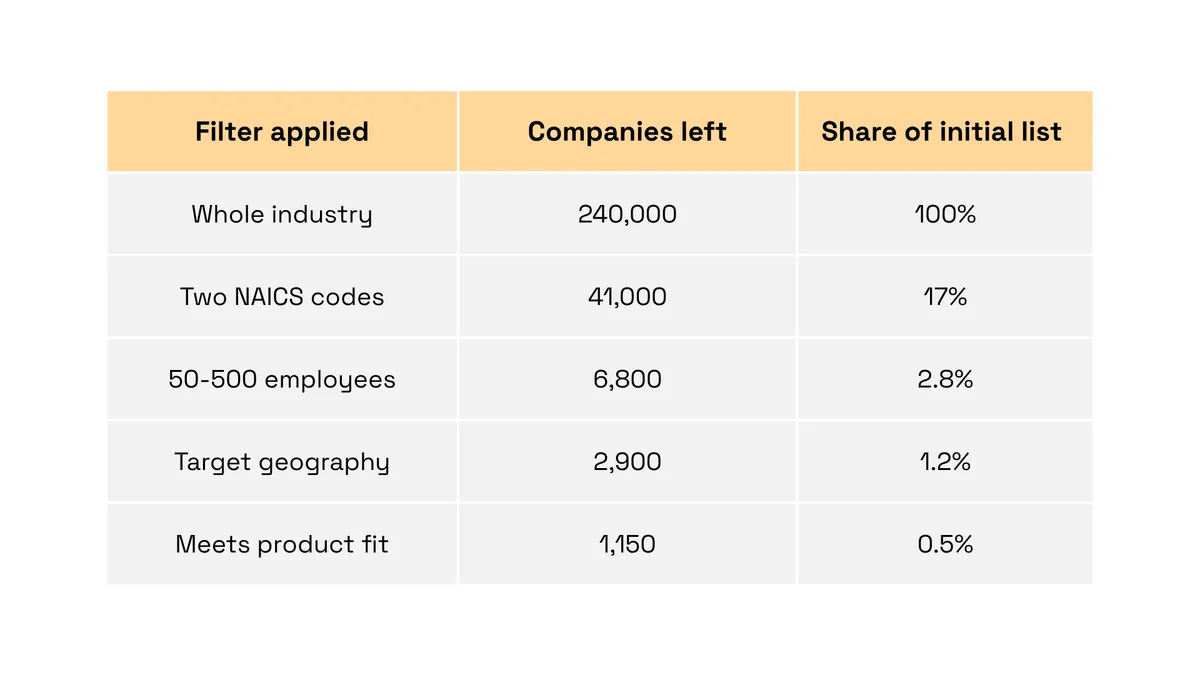
Applying these one at a time changes the picture fast, as the hypothetical example below shows.
Source: Veridion
Every filter removes companies that were never going to buy, so what's left is smaller and considerably more useful.
The drop is steepest at the first two filters, which is usually where teams stop looking.
Overall, skipping segmentation both inflates your numbers and points your sales team at accounts that were never a fit.
Hard to Defend With Stakeholders
Then there's what happens when someone senior starts asking questions.
A market size rarely sits on its own.
It supports a budget request, an investment case, or a decision to enter a new region, so it gets examined by people whose job is to find the weak spot.
That scrutiny is reasonable, since the number is about to involve money.
Sid Trivedi, Partner at Foundation Capital, put this well in DocSend's research on what investors look at.
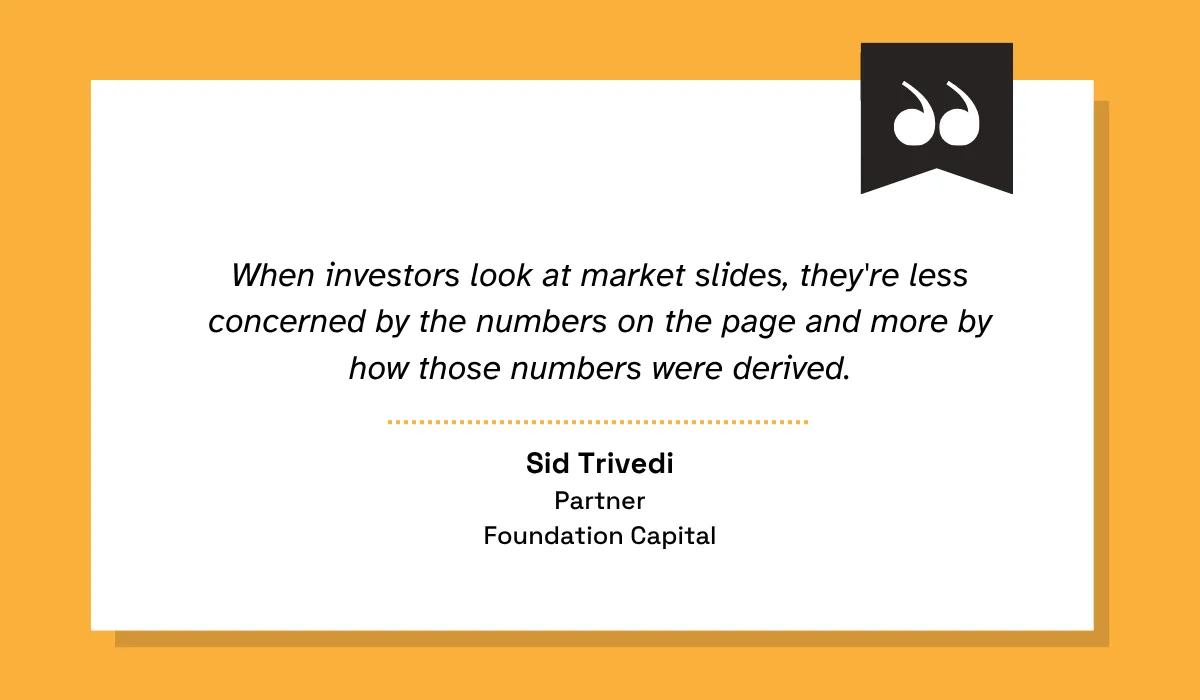
As Trivedi explains, the method behind the figure matters more than the figure itself.
A top-down estimate has very little to show in this regard.
When someone asks why you assumed a certain percentage, there's usually no answer beyond the fact that it felt reasonable.
And once one assumption looks arbitrary, everything built on top of it comes into question, including the parts you did carefully.
The questions tend to follow a pattern.
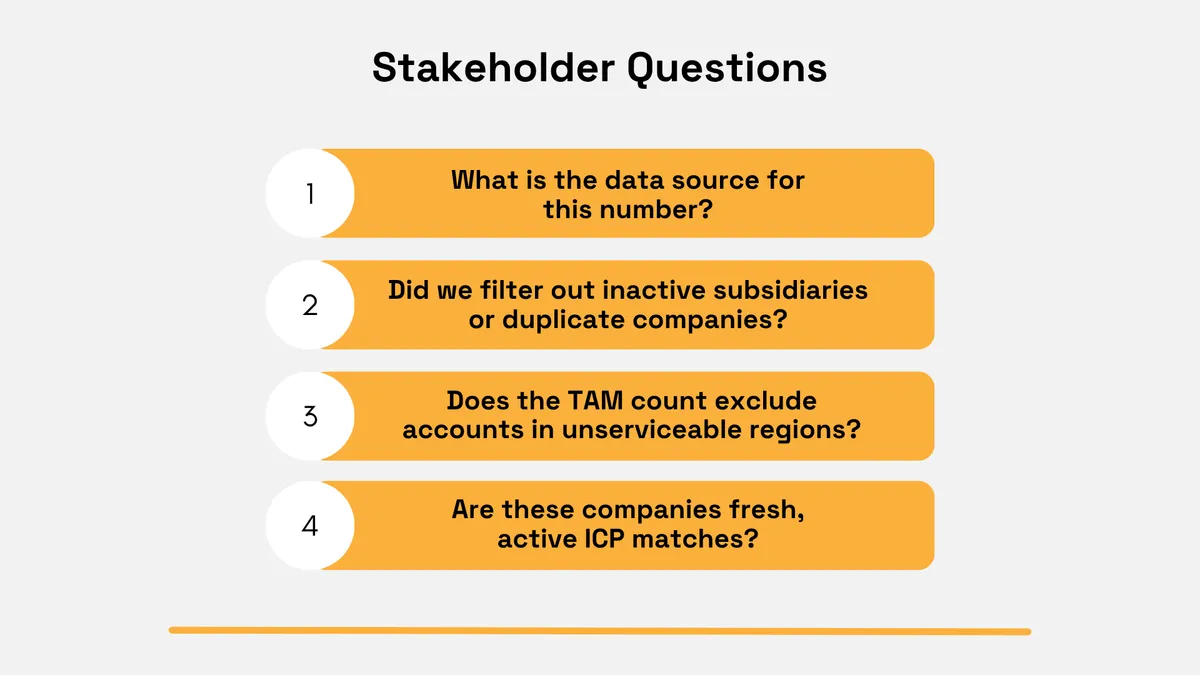
Illustration: Veridion
Each one pushes toward the same place, which is the actual companies behind the number.
Top-down sizing can't get there, because those companies were never counted.
Bottom-up sizing has a much easier time.
When the estimate came from a company list, you can show the list itself.
You can say how many companies matched, which criteria you used, and where the underlying data came from. If someone disagrees with a filter, you change it and the number updates, which moves the discussion onto the criteria themselves.
That turns a defensive conversation into a productive one.
How to Build a Bottom-Up Market Size
Bottom-up sizing flips the process around.
Rather than starting from a published industry figure and narrowing down, it starts from real companies you can count and builds up from there.
Below are some of the steps that get you to a defensible number.
Define Your Segment Criteria
Everything rests on the first step, which is deciding exactly which companies count as in-market.
The reliable way to do that is with standard classification codes, with the following three coming up often:
- NAICS, used across the United States, Canada, and Mexico
- NACE, the European equivalent
- ISIC, the United Nations standard
Each sorts companies into progressively narrower categories, which is what makes them useful for drawing a boundary.
NAICS shows this structure clearly, as shown in the next illustration.
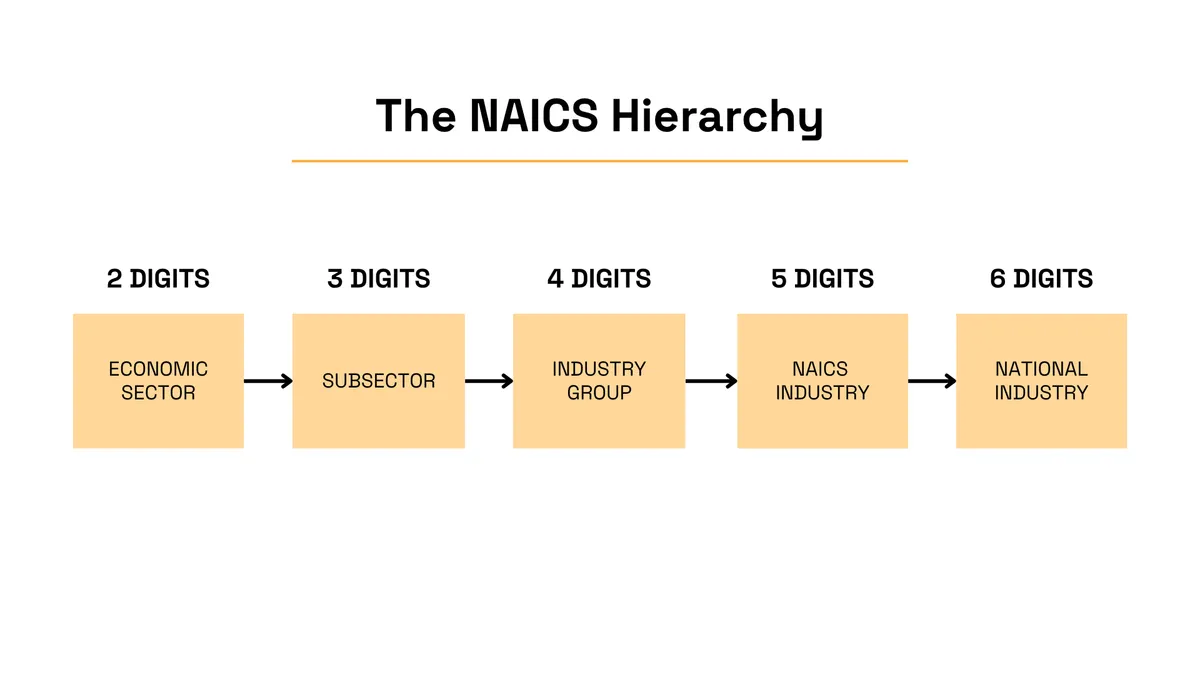
Illustration: Veridion
The distance between the top and the bottom of that hierarchy is enormous.
Two digits cover an entire sector holding millions of companies, while six digits describe something specific enough to build a real target list from. Picking the right level is most of the work.
Here, it’s crucial not to go too broad, as you can inherit the same problem as top-down sizing.
Codes on their own still aren't enough.
You need firmographic filters layered on top, and the contrast between the two approaches is easy to see.
Take a look at the image below to see the difference.
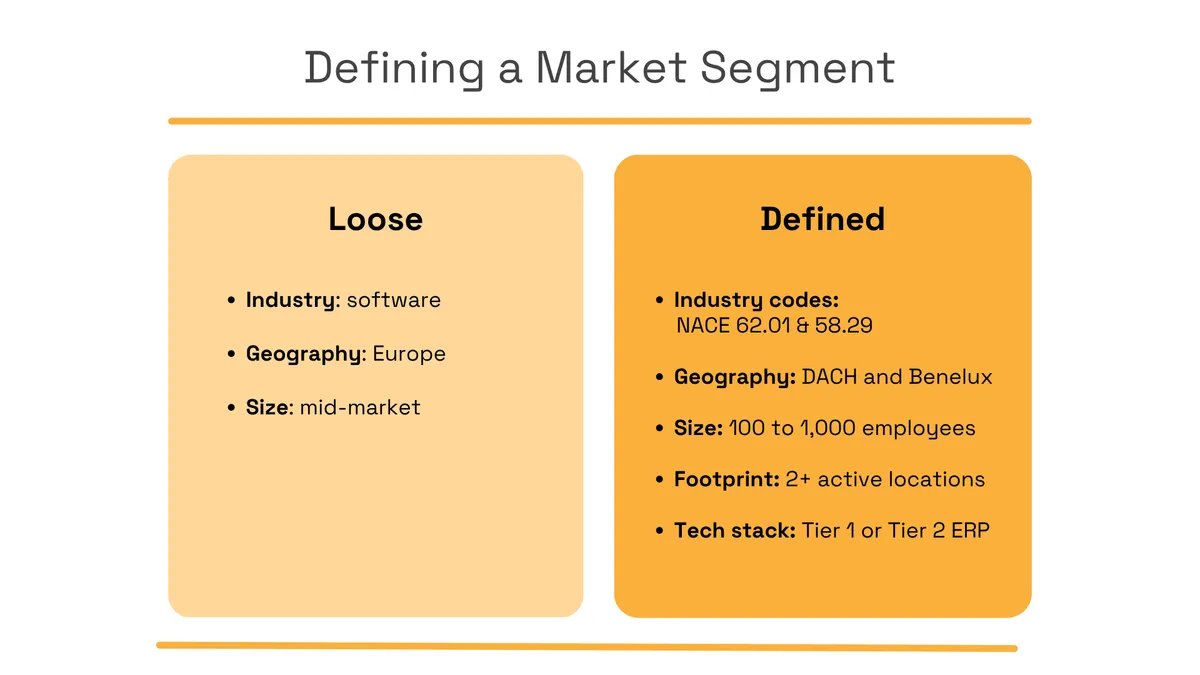
Source: Veridion
The loose version gives you nothing to count.
It's the kind of definition that sends teams back to a published forecast, because there's no way to turn "software companies in Europe" into a list of names.
The defined version adds codes, geography, size, and an operational requirement, so every line becomes something you can filter on.
It also makes the boundary explicit, so anyone reviewing your work can see what you included and argue with it directly.
Count and Segment the Real Population
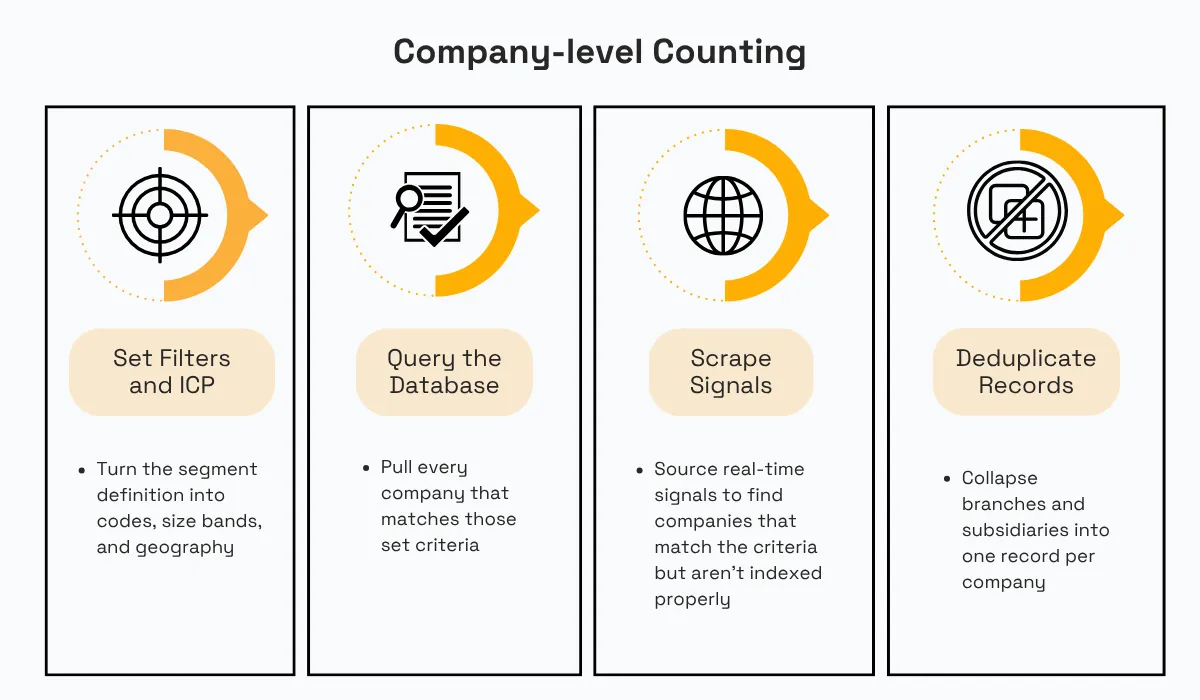
With the criteria set, the next job is counting the companies that match them.
This is the point where an estimate stops being an estimate and becomes a population.
The work runs through a few stages outlined next.
Source: Veridion
Broadly, you move from a defined filter to a raw list to a cleaned one, and the cleaning matters as much as the data collection.
Public registries and databases give you the macro count, though they rarely hold everything you need, so operational details usually come from enrichment against company websites and filings.
There's no getting around the fact that this takes time, when we compare it with the typical approach.
A team working top-down might open a forecast like the one below and assume they'll capture one percent of the market.
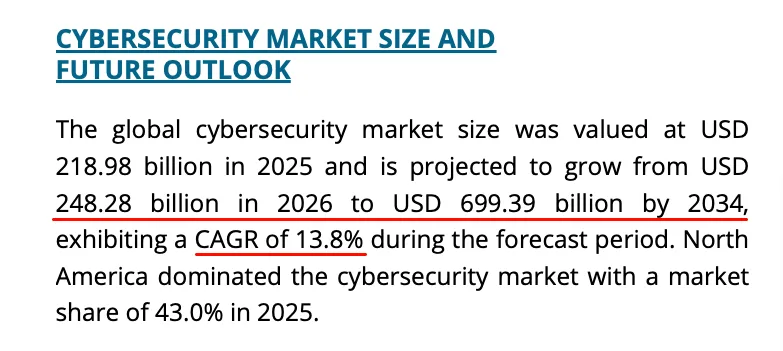
Source: Fortune Business Insights
That takes about a minute, but by now the problem should be clear.
The figure covers a global market across every segment and buyer type, and the one percent was never grounded in anything.
By comparison, an analyst with a NAICS or NACE code and a size band will query a registry, get a few thousand companies back, then work out which are subsidiaries of the same parent and which have closed since the last update.
Only after that process can the final company count mean anything.
The upside is that the result holds still.
A count built this way can be rerun next quarter against the same criteria, and the change between the two tells you something real about the market.
Calculate TAM, SAM, and SOM in Layers
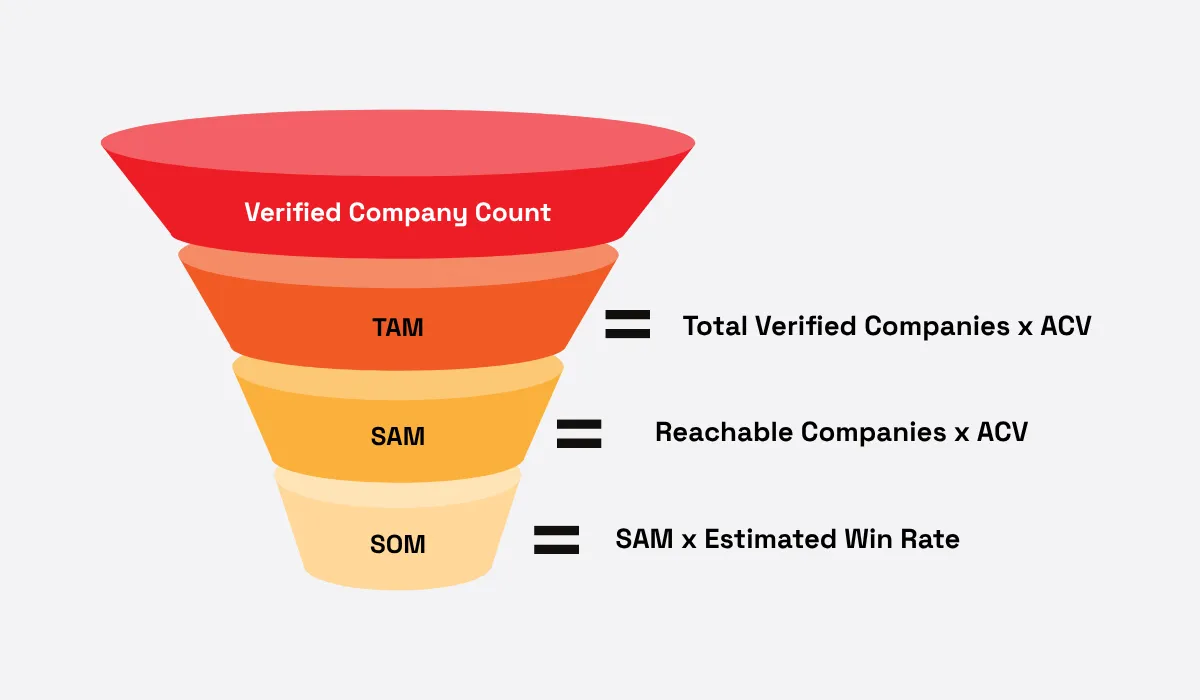
Once you have a verified count, calculating TAM, SAM, and SOM becomes much more straightforward.
Let’s take a look at the calculations in the next image.
Source: Veridion
TAM comes from multiplying the company count by your average contract value (ACV).
Both inputs are real, since one came from the count you just built and the other from deals you've already closed.
With ACV, some models go wrong, because it's tempting to use the contract value of your best customer rather than a real average across the segment.
In fact, Bradford Cross, CEO of Alpha City, makes a strong point about being precise with this initial calculation.
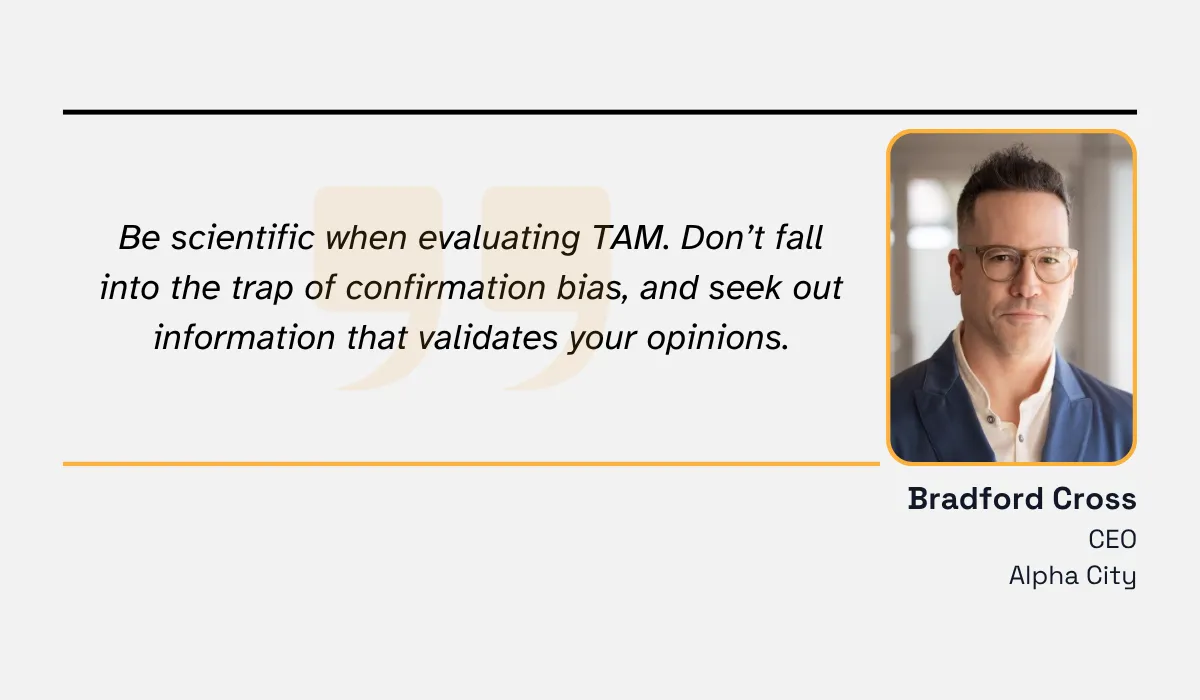
Cross's argument is that being precise about who you serve is what keeps the numbers honest, and a padded ACV undoes that work in a single line.
SAM follows the same logic.
Here you narrow to the companies you can realistically reach, which means removing the ones your team can't serve today.
Rather than assuming you'll expand into a new region next year, size what you can serve now and revisit it when that actually changes.
SOM then applies your historic win rate for similar accounts to the SAM figure.
This is the number that should drive planning, since it reflects what your team has actually managed against comparable companies rather than what the market theoretically allows.
Staying conservative across all three layers can feel unambitious but it's also what lets the final number be reliable.
Veridion: Powering Bottom-Up Sizing With Company-Level Data
Everything we discussed so far depends on company data you can trust.
The catch is that gathering it by hand eats the time you were supposed to spend on analysis.
Senior data and technology leaders were asked about this recently, and the split is worse than most people expect.
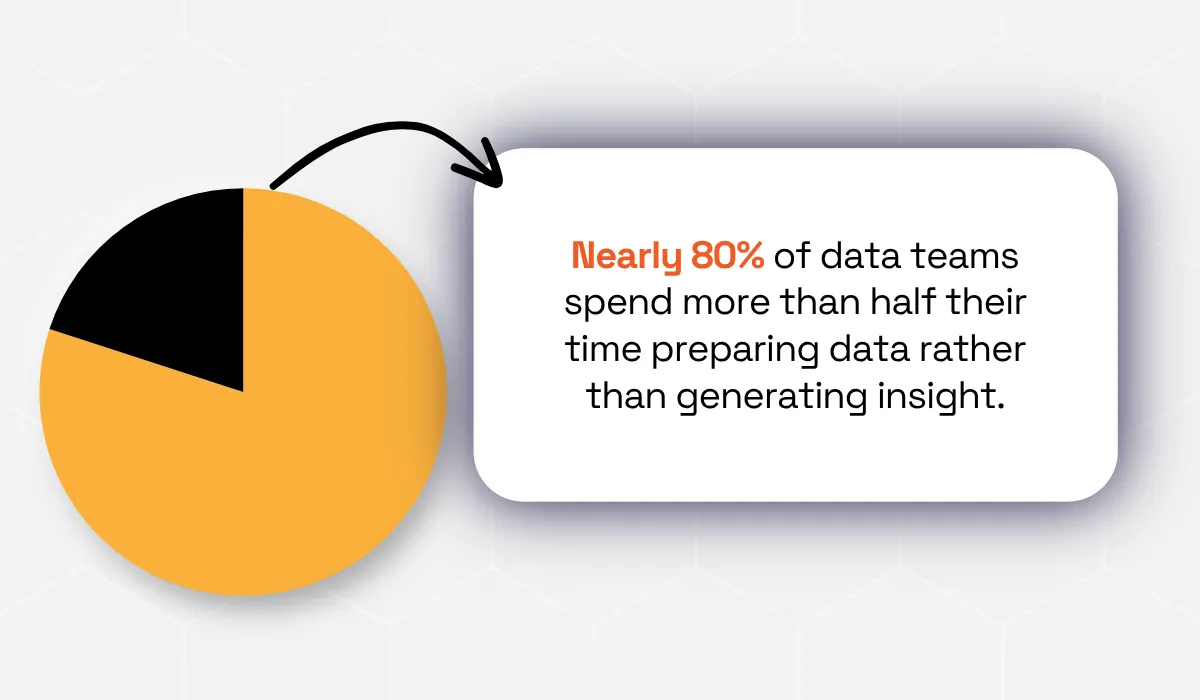
These findings aren’t relevant just for data teams.
In fact, analysts can often spend weeks assembling a company list, with the majority of that time wasted on manual research, data cleaning, and deduplication.
A centralized, structured source of company data is what removes that bottleneck.
This is where Veridion comes in.
It's a data service covering 186M operating companies, with every profile carrying industry classification across NAICS, NACE, and ISIC alongside firmographic attributes.
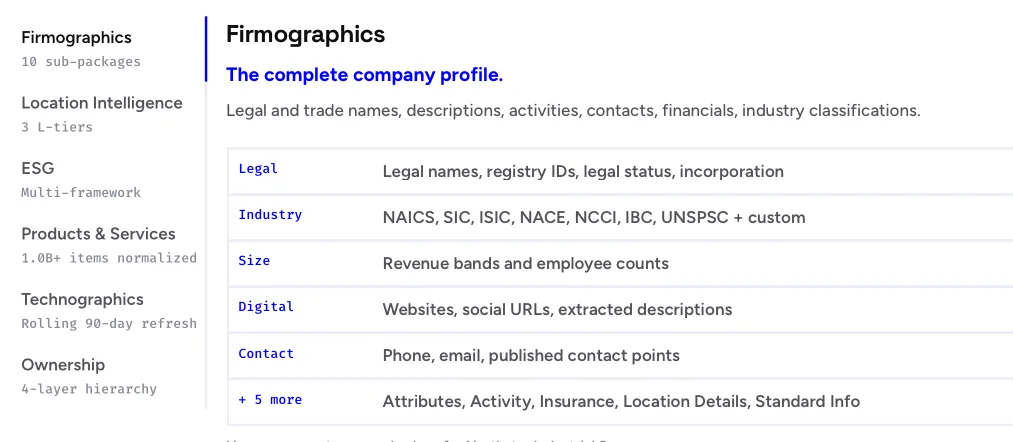
Source: Veridion
Those fields map directly onto the criteria we covered earlier, which means defining a segment and counting it becomes the same action.
The classification coverage matters most for cross-border sizing, where a segment defined in NAICS has to be matched against European registries.
Duplicate and overlapping records are also resolved before the data reaches you.
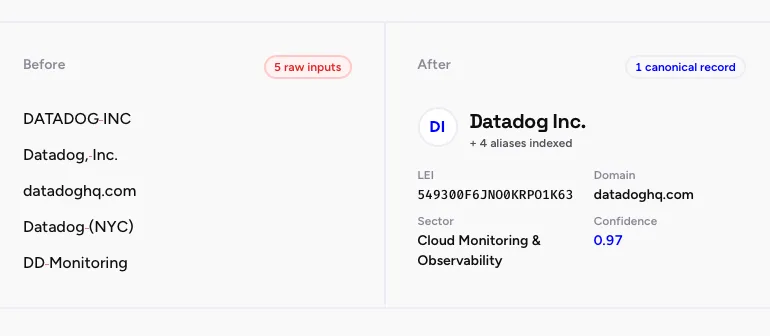
Source: Veridion
Collection runs on machine learning models that read company websites, registries, and filings, then structure what they find into consistent fields.
It replaces the manual searching an analyst would otherwise do across a dozen separate sources.
For teams already building supplier and company intelligence workflows, the same underlying data supports both.
The result is that counting stops being an inefficient part of the process.
Conclusion
Whether a market size estimation is accurate usually comes down to one thing, which is whether real companies sit behind it.
While bottom-up sizing takes more time, as we saw from the previous sections, it delivers defensible, line-by-line figures.
So apply the insights you gained and replace vague top-down estimates with better company counts.
Articles
Discuss how these trends affect your organization.
Our analysts are available for a short call. Bring a specific question and we will ground it in the data.
Insights
Keep reading
More analysis, research, and outcomes grounded in live company intelligence.
Supplier Intelligence: The Ultimate Guide
Struggling with supplier management? This Supplier Intelligence guide will help you optimize relationships and improve procurement decisions!
Four Sources of Procurement Market Intelligence
Need to perform procurement market intelligence research, but don't know where to start? This article explains which sources you can turn to.
6 Data Enrichment Tools You Need to Know About
Explore six standout tools that transform data enrichment capabilities and can help guide your decision-making and go-to-market strategy.