Insights / Articles
How to Use Data Analytics in Investment Management
How can capital markets data analytics revolutionize your investment management? Unlock smarter strategies and boost your portfolio's performance.

A single data breach now costs the financial industry an average of $5.56 million.
That's the price of getting caught off guard.
In investment management, the margin for error continues to shrink by the day, as markets and threats move faster and more sharply.
It's no surprise that, due to this, decisions that used to rely on instinct now need real evidence behind them.
But, not to worry, because this post breaks down five concrete ways data analytics is reshaping how investment managers protect data before it costs them.
Portfolio Optimization
The primary goal for investment managers is to ensure that every risk is balanced by its corresponding return.
For example, back in 1952, economist Harry Markowitz published a groundbreaking paper called "Portfolio Selection," proving that an investment should never be judged by its return alone.
He explained that what matters is how that return compares to the risk behind it, and how the asset behaves alongside everything else already in the portfolio.
That insight became known as Modern Portfolio Theory, which we can say is the backbone of the portfolio diversification we know of today.
However, for decades, this insight has been applied manually through basic spreadsheets, which put a ceiling to how many assets you could realistically test.
Data analytics removes that ceiling.
It lets you measure how:
- Risky it is
- Every asset in your portfolio performs
- It moves compared to everything else you hold
- All of that moves as market conditions change.
With that, you can build a mix that wouldn't fall flat despite how the market moves because the math behind a balanced portfolio hasn't changed since Markowitz's time.
What's changed is how fast you can run it.
For example, the CFA Institute survey found that investment professionals working in portfolio construction now lean hard on data tools to do their job, with 44% using Python to run the analysis.
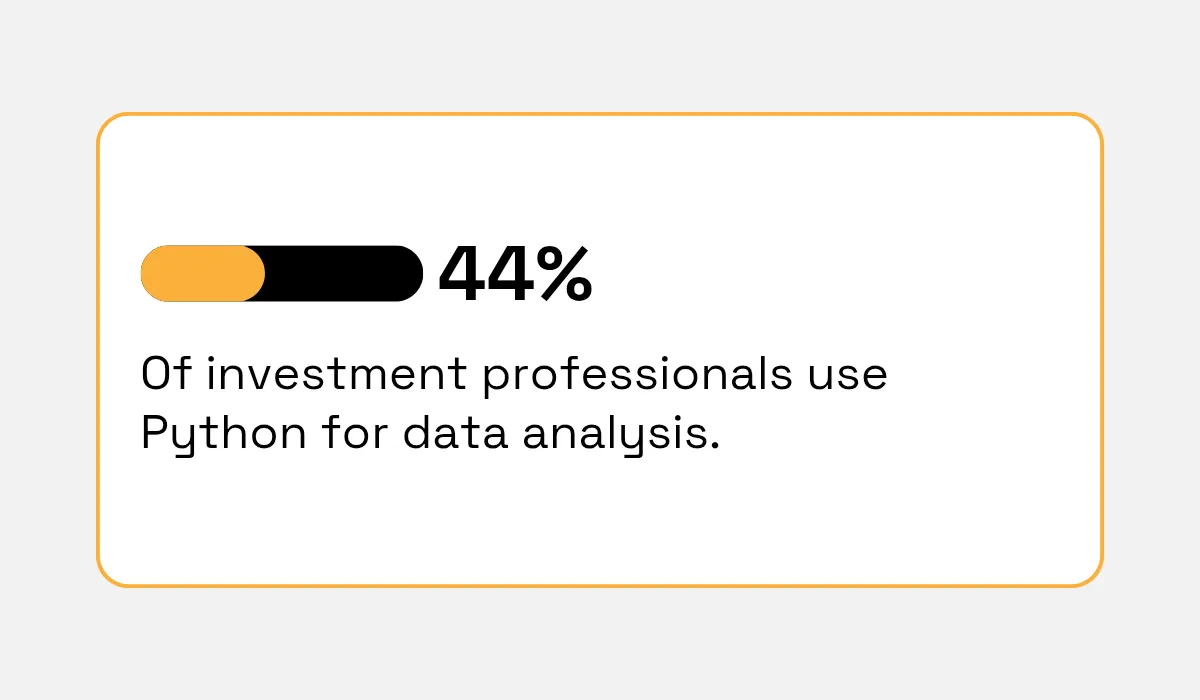
Illustration: Veridion / Data: CFA Institute
So now, you can recalculate risk and return across hundreds of assets in seconds, which would have taken a person hours or days to do by hand.
Therefore, instead of rebalancing your portfolio once a quarter and hoping nothing major changes in between, you can see the moment an asset's risk profile changes and adjust.
That precision makes portfolio optimization one of the clearest reasons investment managers turn to data analytics in the first place.
But it's not the only one.
Fraud Prevention
Let's be honest, most frauds are caught after the money is already gone, which does you no good.
What actually protects your firm is catching it while it's still happening, or better yet, before it even happens at all.
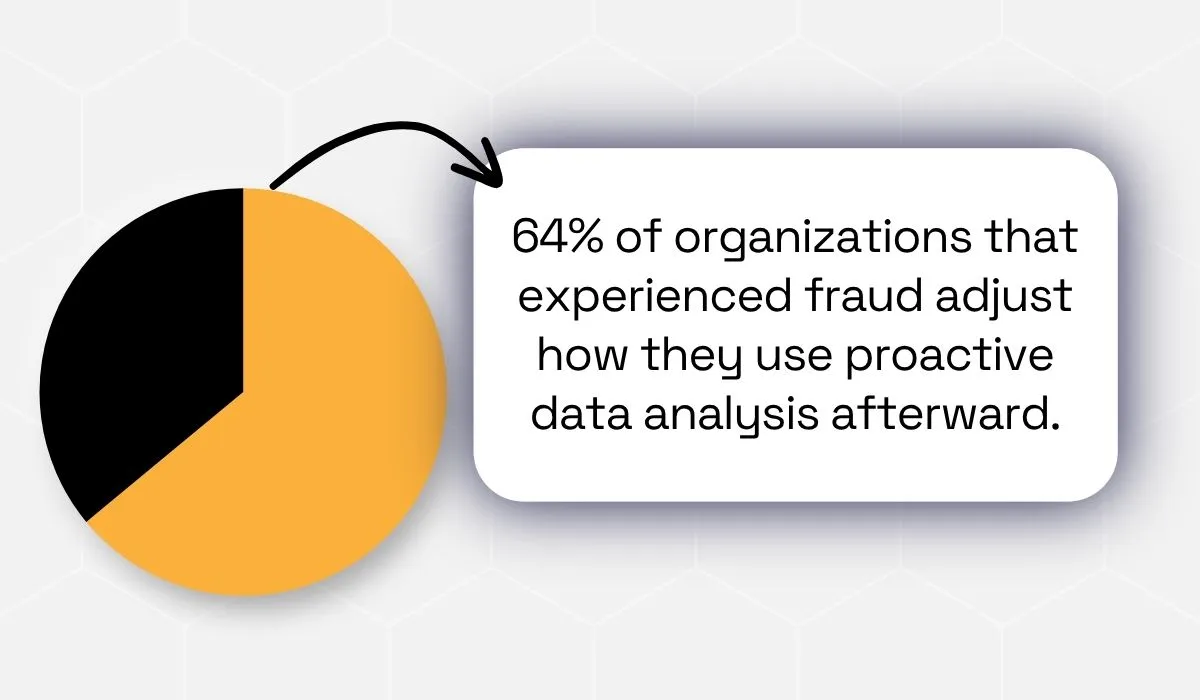
According to ACFE's Report, which analyzed more than 1,900 fraud cases across 138 countries, 64% of organizations that experienced fraud went on to adjust how they use proactive data monitoring and analysis afterward.
But it wouldn't be to your benefit to take reactive measures after the deed has been done.
Rather than waiting for a tip or stumbling upon a problem during a routine audit, with data analytics tools, you can watch transactions as they happen and flag anything that breaks from the normal pattern.
It doesn't have to be something remotely huge; it could be small changes like:
- A transaction that's unusually large for that account
- Trade placed right before news that hasn't been made public yet
- Login activity from a location that doesn't match the account's history.
None of these proves it's a fraud on their own, but together, they tell you where to look to prevent one.
This works well because fraud rarely looks random.
It always leaves a pattern, even when the person committing it thinks they've covered their tracks.
The harder a scheme tries to hide, the more it tends to stand out once you're paying attention to the data behind it instead of just the paperwork on top.
A real-life example of this is the Chinook Therapeutic Inc. case.
Ross Haghighat, a former director at the biopharmaceutical company, learned that Novartis was about to acquire Chinook before the deal became public.
He tipped off his brother, his stepdaughter, and two friends, after which all four of them bought Chinook stock and options before the acquisition was announced, and together they made over $500,000 in illicit profit from information they had no right to use.
The SEC caught a hand of this through its Market Abuse Unit's Analysis and Detection Center, which uses data analysis tools built specifically to flag unusual trading activity.
Those tools picked up the spike in trading right before the announcement, traced it back through the people involved, and built a case strong enough to charge all five of them in August 2025.
That shows you just how strong data analytics is in fraud prevention.
It notices when something is wrong, and it notices early enough for you to actually do something about it.
Cybersecurity Management
Your investment team holds some of the most sensitive financial data out there.
Account numbers, trading positions, client identities, and years of transaction history all sit in their systems.
Which makes them the target of attackers because that's exactly where the money is.
So how does data analytics help protect it?
It works by watching for trouble before it ever becomes a breach.
Similarly to how it prevents fraud, it studies things like:
- Network traffic
- Login behavior
- Past attack patterns to flag activity that doesn't fit
Once the baseline exists, anything that breaks from it stands out immediately.
And that could be an employee suddenly pulling far more files than usual, or a login coming from a device the system has never seen before on that account.
The system doesn't need to know an attack is happening to flag it. It just needs to know that something looks different from how things usually run; that difference could give you an edge in protecting your data.
This matters more in investment management than in most other industries because you're not just protecting customer records here.
You're protecting information that could move markets if it leaked too early, and you're protecting access to systems that control large amounts of money at scale.
A breach in this situation costs you the trust your clients place in you to keep their money and their information safe, and trust, once lost, is much harder to win back than any system you could rebuild.
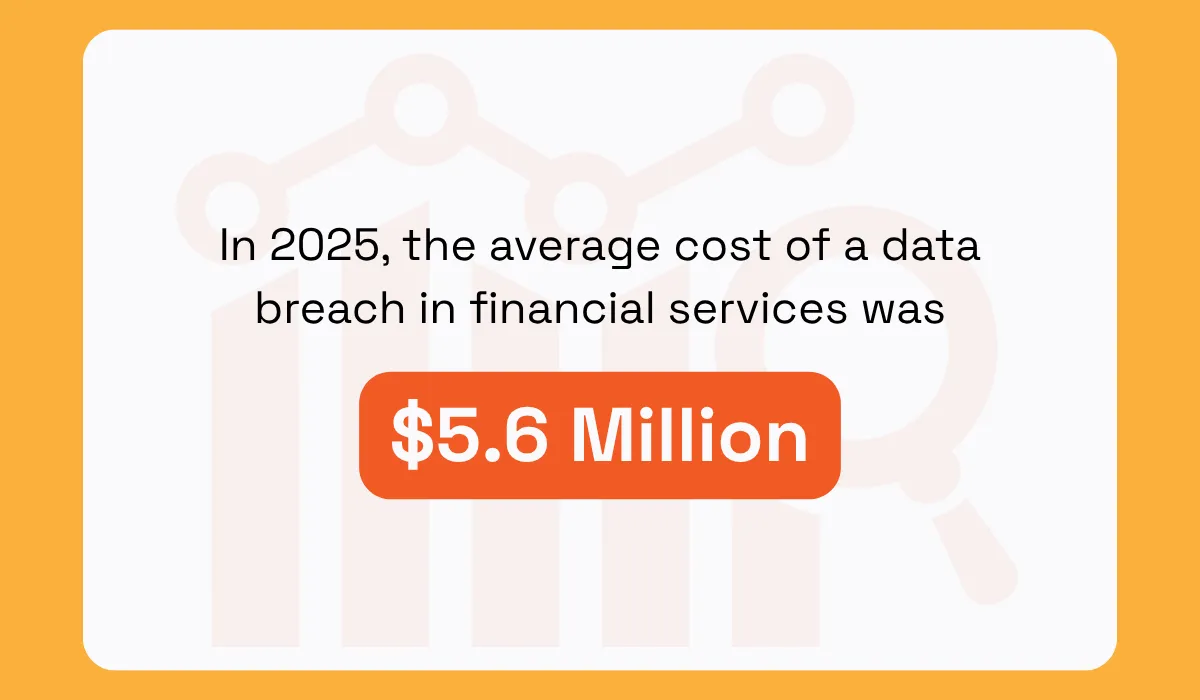
The financial cost of this kind of breach, according to IBM's Cost of a Data Breach Report, is $5.56 million, making it the second-highest of any industry, just behind healthcare.
But the higher cost often isn't even the money. It's what happens when the warning signs go unnoticed for too long.
That's exactly what happened at Ashford Inc. in 2025.
Ashford, an alternative asset management company that provides investment management services to the real estate and hospitality sectors, had a ransomware attack hit its system in September 2023.
This exposed sensitive guest data, including personal and financial information for roughly 46,000 people.
The main issue after it was what Ashford told investors. The company publicly stated that no customer information had been exposed when it knew, or should have known, that it had.
In January 2025, the SEC charged Ashford with making false and misleading disclosures about the incident, and the company agreed to settle the charges and pay a civil penalty.
That delay matters just as much as the breach itself.
The longer a threat goes unnoticed, the more damage it does, and the more expensive it gets to clean up afterward.
Sentiment Analysis
Numbers on a balance sheet only tell you part of the story.
The other part is sitting in the words people use in earnings calls, news coverage, and the running commentary investors leave behind every single day.
Natural language processing, or NLP, is a section of data analysis that lets you read that and turn it into something you can measure.
NLP models scan through huge volumes of text and sort it by:
- Tone
- Positive
- Negative
- Neutral
Then assign it a score.
That score becomes a sentiment signal you can track over time, the same way you'd track a stock's price or its earnings.
The data feeding these models comes from more places than you might expect.
News articles are the obvious ones, but social media platforms add a faster, rawer layer of public opinion, with reaction to events before traditional news even catches up.
AXA Investment Managers tested this directly.
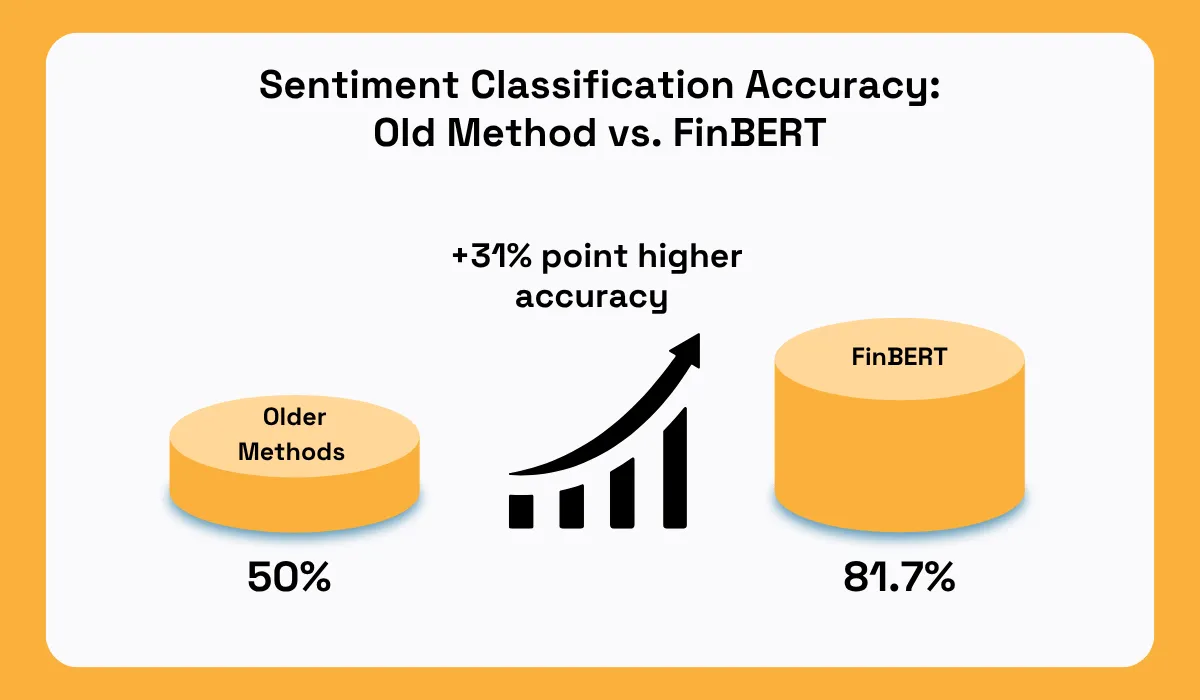
The firm ran 300 headlines from the Financial Times through FinBERT, an NLP model trained specifically to understand financial language, and checked the results by hand.
FinBERT correctly classified sentiment 81.7% of the time, far ahead of older dictionary-based methods, which only got it right about half the time.
That sentiment score becomes one of the factors feeding into their quant equity stock selection process, alongside the fundamentals they already track.
So why does any of this really move stock prices?
Because stock prices don't just reflect what a company is actually worth, they reflect what investors collectively believe about that company at any given moment.
When sentiment turns negative, enough investors start selling or holding back. That selling pressure alone can push the price down. The reverse happens with positive sentiment.
So sentiment doesn't just react to what's already happened, it often moves ahead of it.
A study published in the Journal of Banking and Finance backs this up.
It found that hedge funds with the most negative sentiment around things like growth, inflation, and political risk went on to earn significantly higher risk-adjusted returns the following month than funds positioned the opposite way.
That's the value sentiment analysis adds. It gives you an earlier read on how the market is likely to react to them, often before that reaction shows up anywhere else.
Proactive Risk Detection
Instead of waiting to see how a market move affects your portfolio, with data analytics, you can put a number on the risk before anything happens, so you know what you're dealing with ahead of time.
One of the most common ways to do this is through Value at Risk, or VaR.
It is a math tool that answers a simple question:
How much could you realistically lose over a set period, under normal market conditions, at a given confidence level?
If your fund's VaR comes out to $10 million at a 95% confidence level over one month, that means there's only a 5% chance your losses go beyond that in a typical month.
But VaR has a blind spot. It's built for normal conditions, so it doesn't tell you much about what happens when markets stop behaving normally.
That's where you use stress testing and scenario analysis. Rather than relying on statistics, you construct a specific, extreme scenario like a credit crunch or a geopolitical shock, and you run your portfolio through it to see what breaks.
None of this works, though, if the data feeding it is wrong, outdated, or incomplete.
VaR and stress testing both depend heavily on historical and current data to even function.
This is where Veridion comes in.
Veridion is a business data platform that builds and maintains structured profiles on companies worldwide and makes that data accessible to the systems and teams that need it.
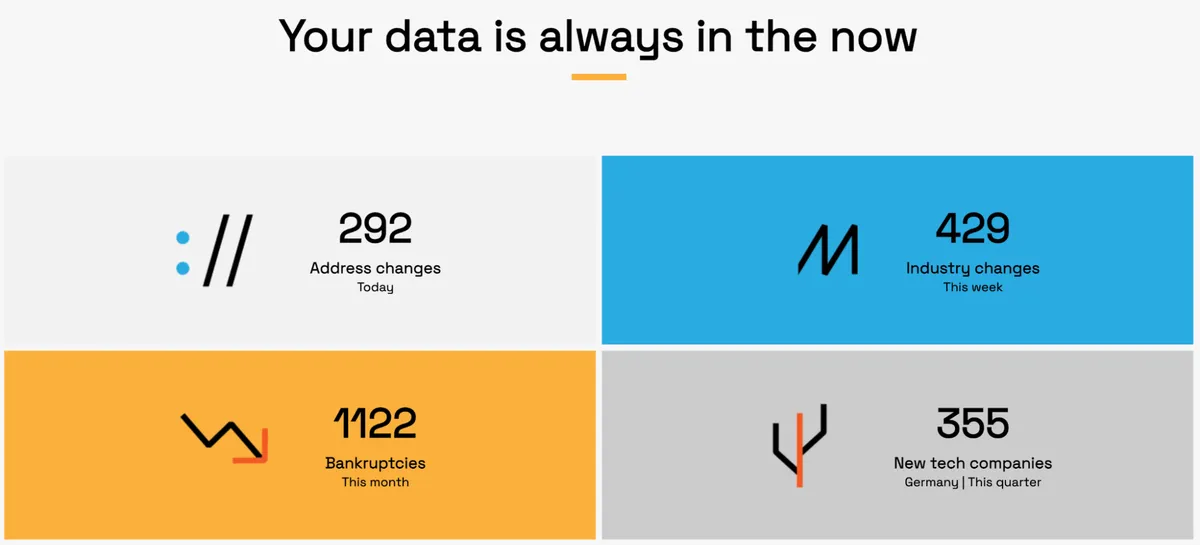
Their database covers over 693M businesses, refreshed weekly, with more than 1.3B products and services indexed.
Source: Veridion
That data is pulled from companies' digital footprints, their websites, public filings, and other public sources.
For risk detection, Veridion organizes its data around real risk categories that matter to you, including:
- Financial health
- Regional exposure
- Operational stability
- Supply chain dependencies
So when you're running a stress test or building out a risk model, you're working based on current, structured data of the companies inside your portfolio or your client's exposure.
That's the real point of proactive risk detection. It's not just about having the right formula. It's about feeding that formula data you can actually trust.
Conclusion
Every reason covered in this guide points to the same thing.
Whether it's building a stronger portfolio, catching fraud early, protecting sensitive data, reading market sentiment, or detecting risk before it hits, none of it works without the right data behind it.
Ultimately, you don't need to predict the future to have an edge in investment management; you just need the right data to see what's already taking shape before everyone else does.
Articles
Discuss how these trends affect your organization.
Our analysts are available for a short call. Bring a specific question and we will ground it in the data.
Insights
Keep reading
More analysis, research, and outcomes grounded in live company intelligence.
A Practical Look at How Data Analytics is Used Across Capital Markets
This article will provide a practical look at data analytics in capital markets and explain how firms use data to gain a competitive edge.
Key Differences Between Competitive and Market Intelligence
Discover the key distinctions between market and competitive intelligence - so you can apply the right approach in your strategy.
How Successful Companies Use Market Intelligence for Business Growth
Discover how successful companies use market intelligence to unlock new growth opportunities. Learn more in our latest guide.