Insights / Articles
Beyond the Blueprint: Using Precise Building Footprints for Risk-Based Pricing Models
Tired of inaccurate risk assessments? Precise building footprints revolutionize risk-based pricing models, offering unparalleled accuracy.

- Precise footprints reduce location-driven premium leakage.
- Two buildings with an identical footprint can carry very different risk profiles.
- A location error of just a few meters can triple expected storm surge losses.
- Underwriters can lose up to 30 minutes just matching buildings to a single submission.
An address tells you where to start looking. It says nothing about the building's shape, its height, or what happens inside it. In short, it does not tell you exactly where risk sits.
Think of two warehouses with identical addresses on paper. One sits fully inside a flood zone. The other doesn't. If your pricing model can't see the difference, you're already leaking premium.
Using precise building footprints will close this gap. Your pricing model gets the geometry and context it needs to evaluate exposure at the structure level.
With this level of evaluation, you can improve premium adequacy, risk selection, and portfolio management.
Why Location Alone is no Longer Enough for Accurate Risk Pricing
Traditional geocoding was built for simplicity, not precision. You feed in an address, and the geocoder returns a single latitude and longitude point.
The address tends to fall on the parcel centroid, the delivery point, or the closest street intersection. It rarely falls on the physical building itself.
For a single-family home on a small lot, this gap barely matters. For a commercial property, it can be the difference between accurate pricing and a costly miss.
According to Milliman's geocoding research, address geocoding can return four different levels of spatial resolution:
- a parcel centroid
- a delivery point
- a building centroid
- a full building footprint
Each one can point to a different part of the property.
Commercial sites tend to sit on larger parcels and often carry several buildings under one address, so footprint-level accuracy matters more here than it does for a single house.
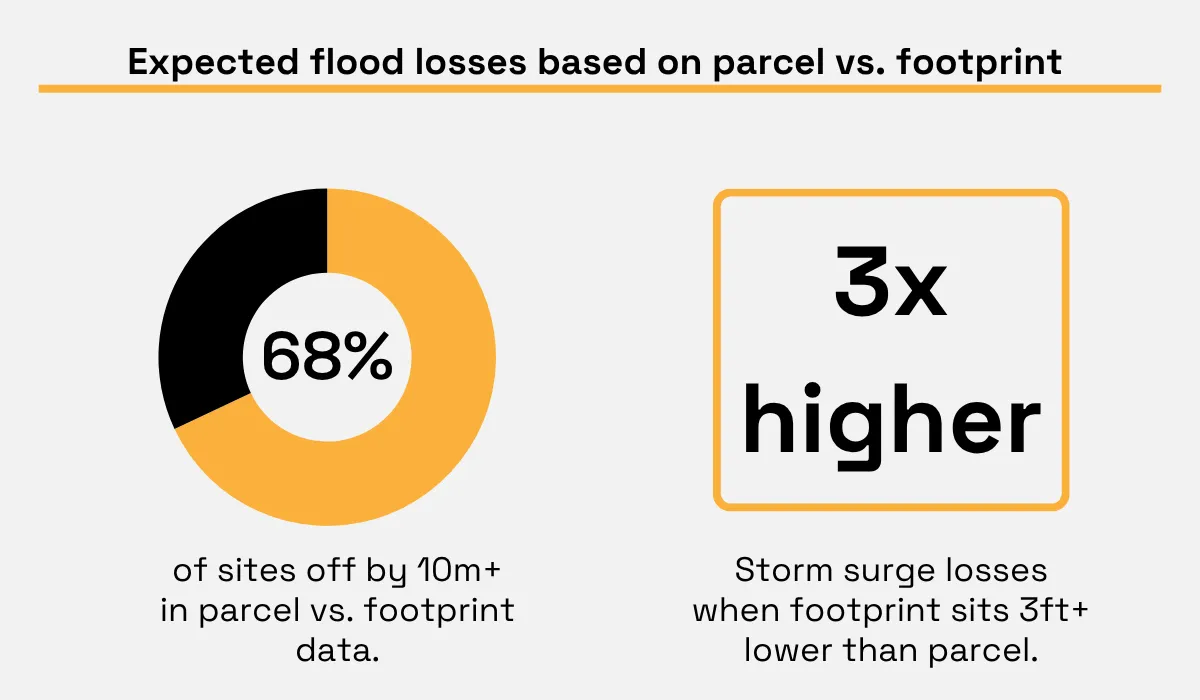
The Casualty Actuarial Society's (CAS) 2025 research on building footprints puts numbers on this gap. Researchers compared parcel-centroid locations to footprint-based locations for 337,460 Florida homes and found that 68% of the properties had location estimates that differed by more than ten meters.
The homes where the building footprint location was over three feet lower in elevation than the parcel location recorded storm surge losses almost three times higher on average.
This is not just a minor adjustment. It is the difference between a properly priced policy and one that quietly reduces your loss ratio for years.
Another study conducted by Perr&Knight and reported by Forbes Insights compared standard location information with more precise location data for Florida homeowners policies.
It found premium corrections on 5.7% of policies. About 3.8% had been underpriced. Individual corrections ranged from an 86.7% increase to a 46.4% reduction.
If an insurer has 100,000 scheduled sites, they would have 5,700 locations requiring correction if the same 5.7% rate was applied. This is an illustration, not a forecast, yet it explains why location quality needs to be assessed on a portfolio level.
For those underwriting commercial risk, the first question to ask your data vendor is which spatial resolution you are being priced on.
A vendor who only has the parcel centroid leaves you to work with an approximation instead of an exact location.
This same challenge with precision shows up in liability exposure across shared commercial properties, where imprecise location and function data create blind spots that only surface after a claim.
The good news is that it is much easier to source footprint data now. Providers can extract building outlines directly from high-resolution satellite and aerial imagery using machine learning models trained to detect structure edges, roof lines, and building counts at scale.
When creating location precision, start with a location quality audit where you record the geocode type, match confidence, the age of the source, and the distance from your current point to the actual building.
Afterward, focus on the big parcels, multi-building addresses, catastrophically exposed zones, and highly valued insured locations.
This helps you concentrate on footprint enrichment only when the location error can lead to a significant premium or accumulation consequence.
What a Building Footprint Is, and Why Precision Changes the Risk Picture
A building footprint is more than a square-footage figure. It is a precise, two-dimensional outline of a structure as seen from directly above, capturing its exact size, its shape/geometry, and often its number of floors.
Once you add a building function to this geometrical representation, you will know whether it is an office space, industrial plant, research and development laboratory, or a logistics facility.
This will give you a complete understanding of the structure and the operations, something that cannot be found from an address point.
It is quite common for insurers to overlook the shape of an asset and just focus on its size. But this shouldn't be the case, as shape is just as important as size. This is because having the same size doesn't necessarily mean the same level of exposure.
A multiple-story building will fit more people, more equipment, and more supporting infrastructure, such as stairwells and loading docks, into a tighter space than would otherwise be possible.
This makes incidents happen faster and more difficult to respond to.
Footprint precision sharpens the assessment of highly localized perils.
A study examining the effect of floodplain location on home sale prices in Portland, Oregon found that homes sold for 21.5% less than comparable properties when the building footprint itself intersected the mapped floodplain, compared to only an 8.6% price reduction when just the broader parcel ("tax lot") intersected it.
Illustration: Veridion / Data: Science Direct
This is critical for flood pricing because flood risk can change over short distances due to terrain elevation, first-floor height, drainage, river proximity, and coastal exposure.
If your locations are inaccurate, you're likely to allocate unfair insurance premiums, which may affect policyholders or expose you to unexpected risk.
Wildfire risk follows the same pattern. Structure separation, the distance from one building's footprint to the next, is a proven driver of home-to-home fire spread.
Reviewing the 2025 Los Angeles fires, the Insurance Institute for Business and Home Safety found that conflagration took hold in areas with eight to fourteen feet of separation between structures. Nearby areas with thirty to seventy feet of separation saw only isolated ignitions.
None of that distinction shows up if you are rating from a neighborhood-level flood zone or a generic wildfire score only.
The same logic extends to coastal storm surge, distance to rivers and fault lines, and landslide susceptibility, which depend on exactly where a structure sits, not on where its parcel or its ZIP code sits.
If you assess a property based on its neighborhood rather than its own physical footprint, you may take on hidden risk or miss out on business opportunities.
Always keep in mind that two buildings can share an identical footprint on paper and still diverge sharply in risk once you account for exactly how they sit on their site.
Therefore, before you finalize a rate on a commercial structure, check whether your risk score is tied to the building's actual footprint or to a broader zone. If it's the latter, you are pricing a neighborhood, not a building.
Modeling Risk Without Sending an Agent Into the Field
Physical inspections can still be very useful. This could include checking the actual construction, the maintenance, the fire prevention, machinery, occupancy controls, and anything else that imagery cannot accurately assess.
Unfortunately, they also take time and are difficult to scale, especially across large portfolios. Verisk estimates there are more than 15 million commercial properties in the United States, and visiting each one on site is not realistic for any carrier.
Even where inspections happen, they take time, and a property's risk profile can shift in the months between the visit and the renewal.
A visit requires scheduling, travel, access, documentation, and follow-up. That process becomes difficult to scale when an insurer must assess thousands of locations across several countries.
Additionally, before an inspection even begins, underwriters often lose time just confirming which buildings belong to a risk.
Cape Analytics has documented cases where underwriters spent up to 30 minutes in a mapping tool trying to match every structure on a submitted building schedule to the correct property, especially for large or oddly shaped parcels with several structures on them.
McKinsey has estimated that underwriters in large commercial lines spend 30% to 40% of their time on administrative work, including rekeying information and manually conducting analyses.
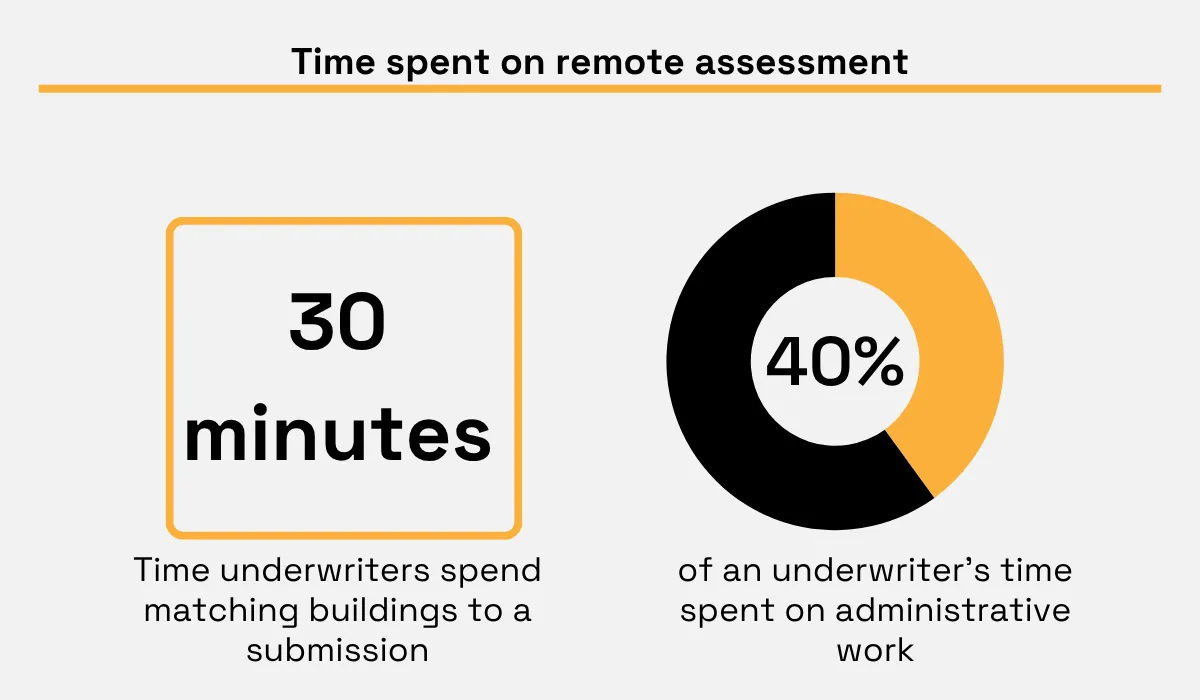
Illustration: Veridion / Data: McKinsey & Cape Analytics
That lost time has a direct opportunity cost. Every hour spent finding a building, checking an address, or validating an industry code is an hour unavailable for analyzing unusual hazards, negotiating terms, or reviewing complex accounts.
Data-driven remote site characterization bridges the gap. Rather than send someone to do a survey, you analyze the relevant, structured data contained in satellite/aerial imagery.
Additionally, you can use machine learning algorithms designed to detect building shape and functionality as well as public/digital records detailing what goes on there.
This is where a platform like Veridion fits into the workflow. Within its commercial insurance solution, Veridion can resolve a business from basic identifying information and return structured site and company attributes.
Source: Veridion
Starting from just a business name and address, Veridion enriches a location with structured site-level data, including function classification such as office, manufacturing, research and development, or logistics, building characteristics, and estimated operational intensity like employee counts and revenue.
That rich data gives an underwriter a full site profile in seconds, built from a company's registry data and its live digital footprint, without waiting on a field visit to confirm what a building actually is and how busy it actually gets.
If your current process is still treating a site visit as the single source of truth for building and functionality data, you need to start considering how much time this false assumption is costing you.
A remote-first process, supplemented by physical inspections at those sites that really need it, processes simple cases quickly while allowing your best inspectors to focus on those cases that really warrant scrutiny.
Building Footprint Data Inside a Pricing Model
Building footprint data becomes valuable when it is used as an input to ratings, not just as a lookup value on a map.
A map that underwriters can see is valuable. A set of validated fields that the pricing engine can use consistently is even better.
The functional class, structural complexity, and footprint size could each directly adjust a base rate. A manufacturing facility with a compact, multistory footprint and lots of equipment requires a different base rate than a single-story warehouse of identical size.
Footprint data becomes exponentially valuable when it is coupled with financial information such as estimated revenue and number of employees.
This information is crucial because a large footprint with low estimated headcount suggests automated storage or light industrial use.
The same footprint with a high employee count and strong revenue signals a more intensive, higher-value operation, one that likely carries greater liability and business interruption exposure.
Site-level financial metrics act as proxies for operational intensity, and that intensity strongly influences liability exposure independent of the physical structure itself.
Footprint data alone tells you what the building looks like. Combined with occupancy intensity, it tells you how much risk actually moves through that building every day.
For instance, a modest warehouse with a handful of employees carries limited exposure. A round-the-clock facility with the same footprint and hundreds of staff on site carries a different risk entirely, even though structural data alone would price them the same.
This combination also surfaces accumulation risk before it turns into unexpected losses.
Michael Quigley, Head of Property Underwriting and Multiline Risk Quantification at Munich Re US, an insurance-related risk solutions provider, has explained that climate effects and urban concentration mean a single event can now generate large correlated losses across a book of business, not only in traditional peak zones.
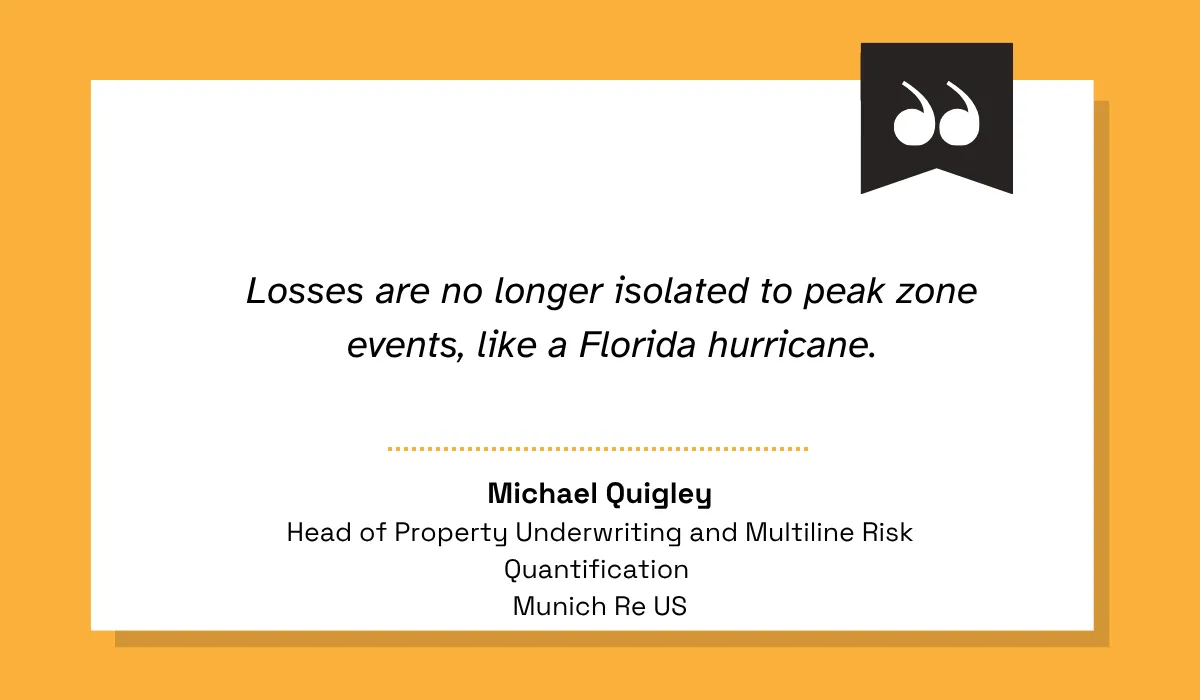
This matters when insured locations in the same area share the same floodplain, wildfire corridor, or industrial park. Footprint- and function-level information helps you spot that pattern before it turns into a loss across your entire portfolio from a single storm or fire.
Similarly, structural attributes like building shape feed directly into the replacement cost and pricing models, emphasizing that footprint-level information must be incorporated into the rating model and not outside it.
All these pieces of information should be captured in your rating model through structured fields, and not in the form of notes appended to files.
Information related to function class, building footprint geometry, number of floors, and building operation intensity should map to a particular rating variable such that every location in your portfolio is rated according to what it is and not its address.
Conclusion
An address is insufficient to describe risk. Building footprint data introduces efficiency by providing precise information about the building's size, shape, and functionality, and then using it in your rating model.
Insurers who adopt this level of detail catch mispriced risk before it becomes a loss, instead of after.
Start with your highest-value or highest-hazard locations, verify what your current data actually represents, and build outward from there. The more precisely you can see a building, the more fairly you can price it.
Articles
Discuss how these trends affect your organization.
Our analysts are available for a short call. Bring a specific question and we will ground it in the data.
Insights
Keep reading
More analysis, research, and outcomes grounded in live company intelligence.
Data Requirements for Underwriting Liability in Shared Commercial Properties
From usage types to maintenance responsibilities, find out which data matters most when underwriting shared property risks.
Best Practices for Leveraging Market Intelligence
Not sure how to apply market intelligence effectively? Learn which practices top businesses rely on and how you can too.
How to Gather Market Intelligence In 5 Steps
In this guide, we're breaking down the five key steps you need to take to gather market intelligence that drives real action.