Insights / Articles
Predicting SMB Financial Health: Why Real-Time Digital Footprints Outperform Last Year’s Tax Returns
Tired of outdated financial data? See how real-time digital footprints revolutionize SMB financial health and predictive underwriting data.

- Tax returns can describe outdated business conditions by the time underwriting begins.
- Digital signals can reveal business momentum between reporting periods.
- Thin-file businesses can appear riskier than they really are.
- Combining structured digital footprints with traditional financial data gives underwriters a more accurate view of SMB risk.
What if the documents you’re using for your lending decision described a business that doesn’t exist anymore?
Tax returns are still essential for verifying historical performance for fast-moving small and medium-sized businesses. However, last year’s revenue doesn’t tell you whether the company has since lost its largest client, launched a new product, stopped hiring, or closed half its locations.
Below, we’ll explore why traditional financial records leave critical gaps in SMB underwriting, plus how real-time digital footprints help close them.
Read on to learn how current operational signals can give you an earlier, fuller view of financial health.
Why Tax Returns Fall Short
Financial statements and tax returns have been default inputs in SMB underwriting since the dawn of underwriting. And that’s for good reason.
They offer standardized, auditable evidence of:
- Revenue
- Expenses
- Profitability
- Assets
- Liabilities
Tax filings can also validate if the income reported by an applicant aligns with the official records.
Still, historical accuracy is not the same as current relevance.
Unlike consumer lending, SMB underwriting has no universal equivalent of a personal FICO score. So lenders have to assemble a risk profile from several complementary data sources.
Here are some of the most common ones:
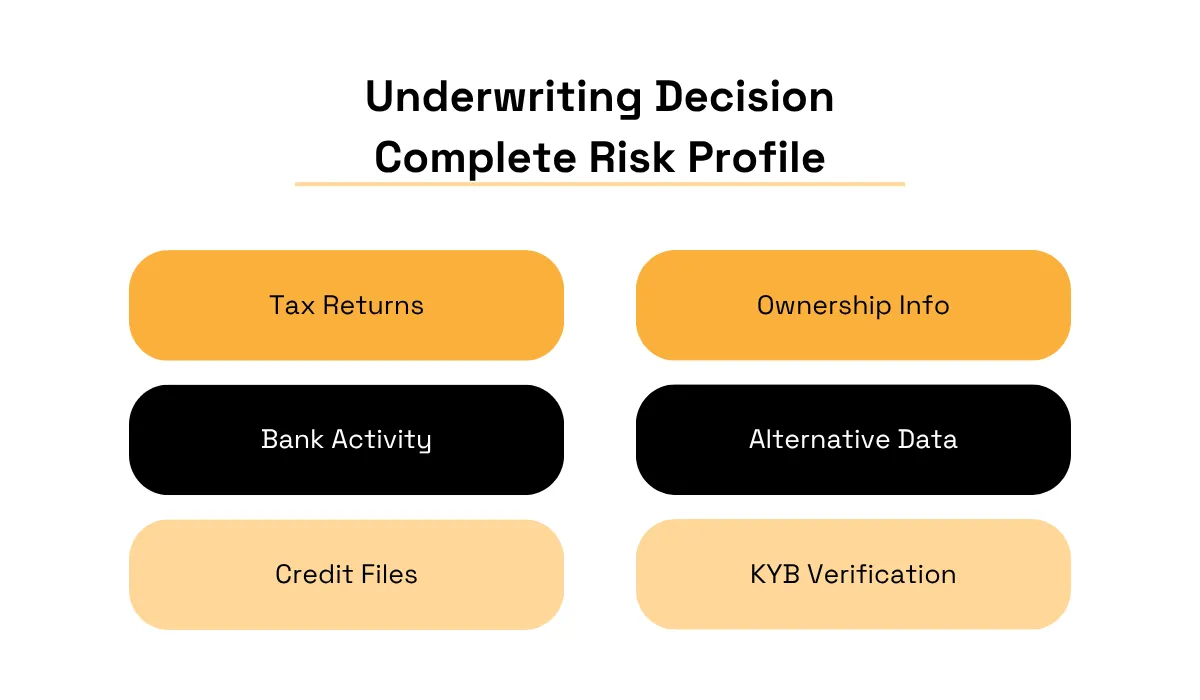
Source: Veridion
That makes the age and coverage of each input especially important.
A tax return can tell you what happened during a completed reporting period. But it can’t really tell you what is happening now, or what is likely to happen next.
Below, we dig deeper into three reasons why tax returns fall short.
Already Stale on Arrival
A tax return becomes historical before an underwriter even gets to see it.
For a US calendar-year business, the reporting period ends on December 31. But partnerships and S corporations generally don’t file until March. Sole proprietors and most C corporations file in April.
That creates a standard lag of two and a half to three and a half months before the return is even due.
With an automatic six-month extension, it may not become available until September or October. That’s nine or ten months after the financial period ended.
And all that’s before the lender enters the picture.
If the company applies for financing late in the following year, its latest completed tax return may describe sales and expenses generated 12 to 18 months earlier.
Meanwhile, its current-year performance remains pretty much invisible.
For a large, mature enterprise, that gap may be manageable. A diversified company with stable products and established customers tends to have more predictable cash flow. The changes are gradual enough for historical financials to remain informative.
SMBs are different.
Small companies depend on a smaller number of customers, locations, employees, or product lines.
That means one lost contract or supplier interruption is all it takes to alter the company’s repayment capacity. And that happens much faster than it would at a diversified multinational.
That volatility is one big reason lenders combine tax records with more current sources.
Lendflow explains that bank transactions and cash-flow feeds are especially useful for revealing revenue patterns, liquidity, cash reserves, and spending behavior that static financial statements just can’t capture.
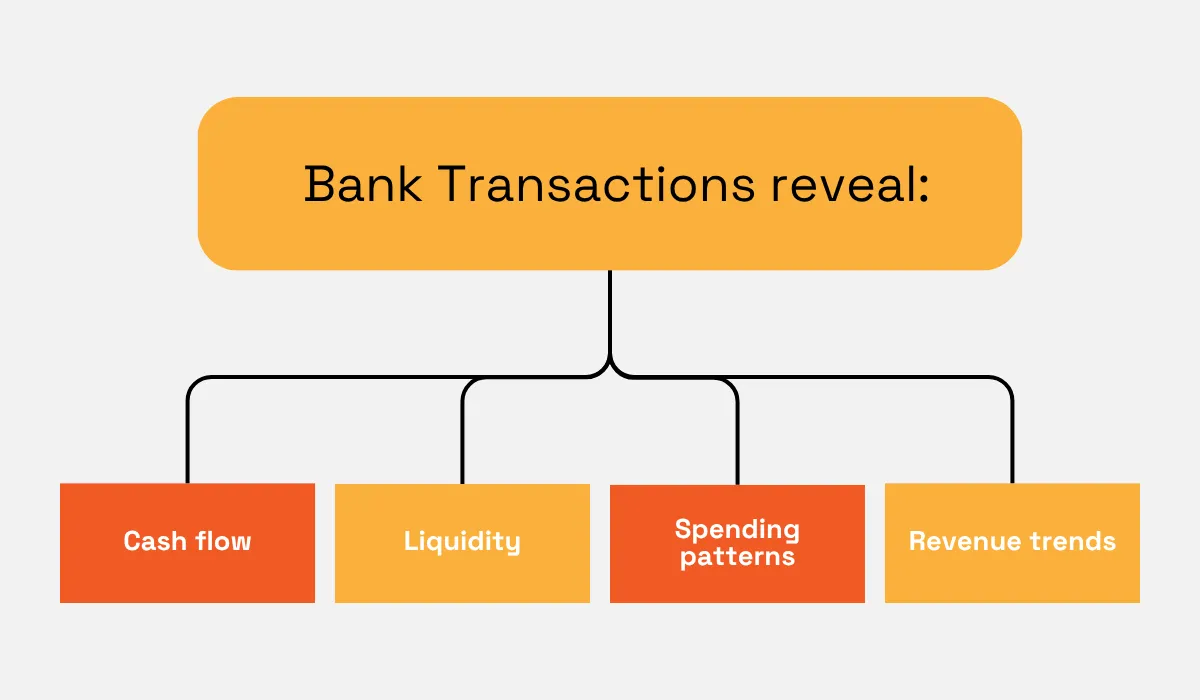
This real-time information can be truly valuable for fast-changing businesses and those with limited credit histories.
Tax returns still establish a historical baseline. But when you use them without fresher context, you risk assessing today’s borrower through last year’s rear-view mirror.
Missing Shifts Mid-Year
An SMB's financial trajectory can change dramatically within a single reporting period.
A manufacturer can lose a major customer. A software company can launch a successful new service. A retailer can start closing stores while a professional services firm expands into new markets.
None of those developments needs to appear in the latest available tax return.
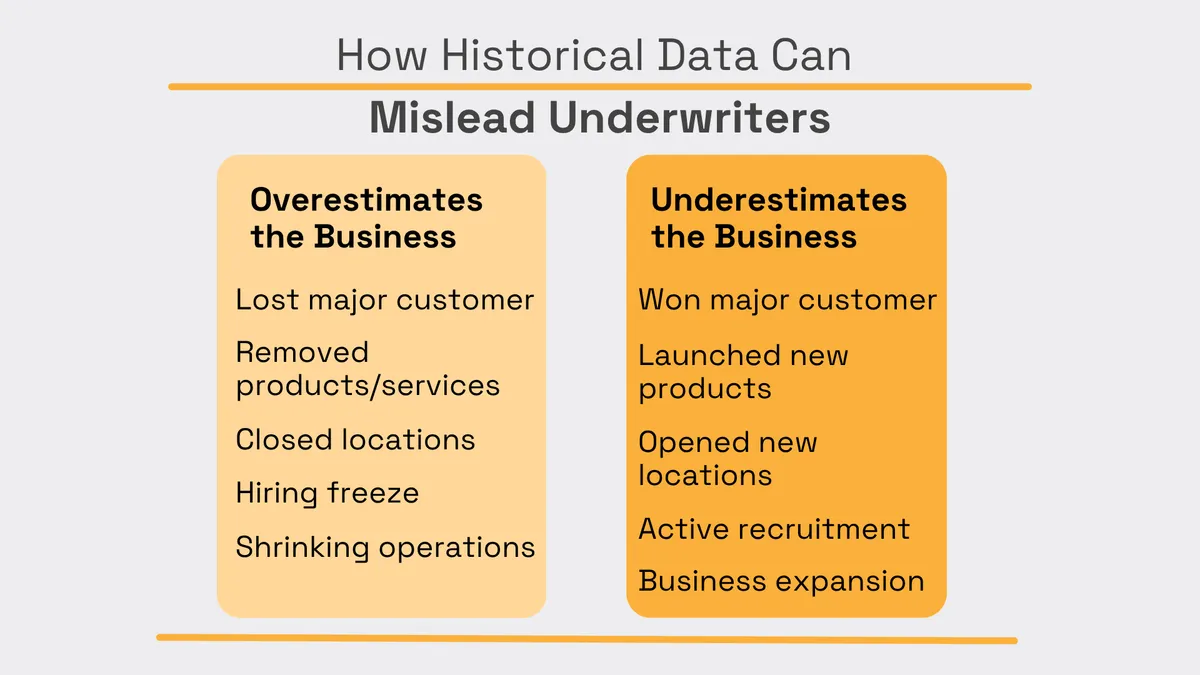
Suppose a company reported healthy revenue for the previous fiscal year. Since then, it has removed an entire service category from its website and marked two offices as permanently closed.
Its historical documents remain technically accurate. And yet, they now describe a business much stronger than the one operating today.
The opposite can happen, too.
A young company's latest return may reflect its early stages. Since then, it could have launched new products, opened locations, expanded its technology stack, and begun hiring.
In a nutshell, historical data can mislead underwriters in two main ways:
Source: Veridion
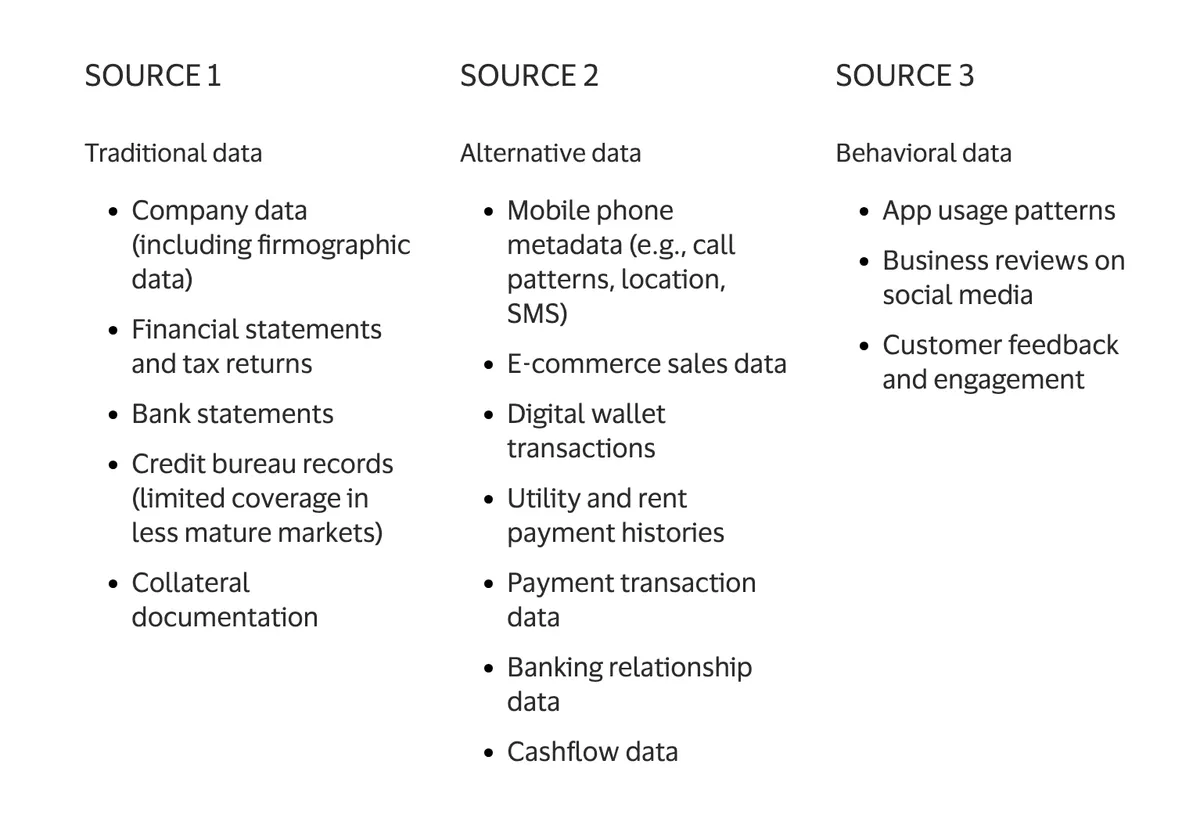
According to Visa, predictive analytics and updated datasets help financial institutions identify emerging opportunities and early stress signals before they appear in annual reporting.
Here’s what they classify as traditional, alternative, and behavioral data:
Source: Visa
So rather than waiting for the next filing cycle, you can respond to changes as they happen.
Shopify Credit demonstrates this approach in practice. Eligible merchants' credit limits can be adjusted monthly based on their ongoing sales and business performance.
When businesses change continuously, their risk assessments should too.
Not Enough History to Judge
For many SMBs, stale history is not the main problem. There may be too little history to assess in the first place.
That’s called a “thin-file” problem.
A “thin-file” business has limited information in conventional commercial credit records. That might mean:
- Few established trade lines
- Little borrowing history
- Only one or two completed tax returns.
This doesn’t automatically make the company financially weak.
A profitable young consultancy or digital merchant may have strong cash flow but no long repayment record. Conversely, a registered company may have years of paperwork but very little genuine business activity at the moment.
The problem is, traditional inputs struggle to distinguish between those cases on their own.
Lendflow notes that a growing SMB can still appear risky on paper if it hasn’t yet accumulated trade lines or filed several years of returns.
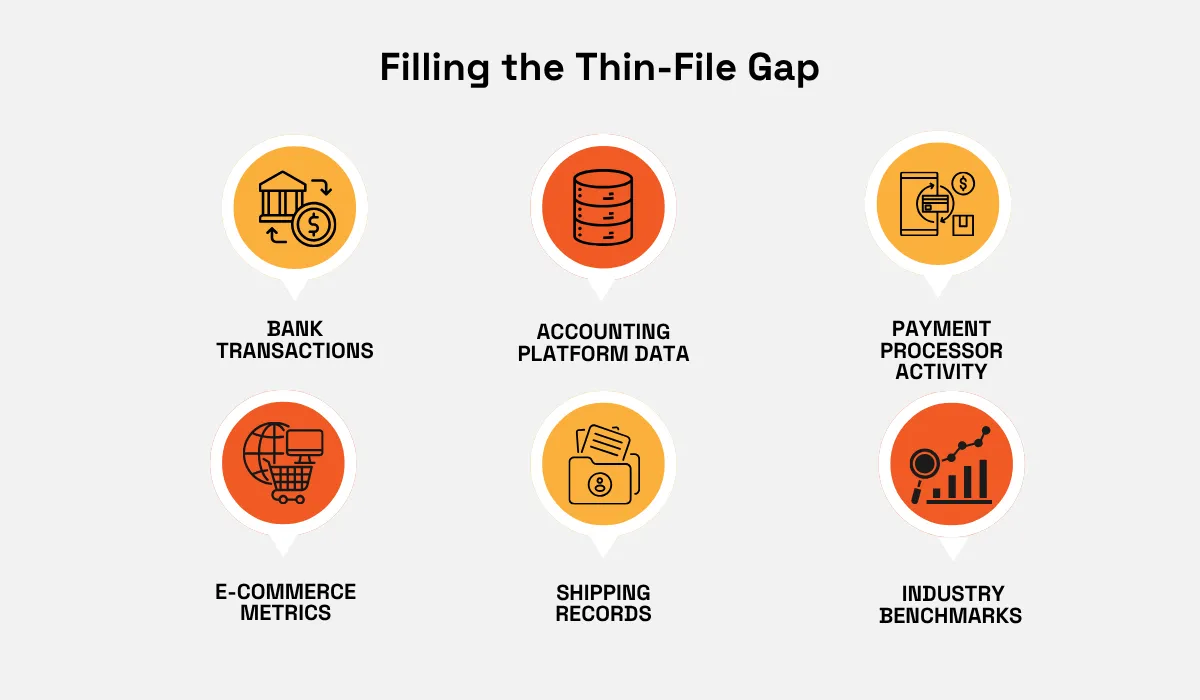
Lenders usually compensate by examining the following:
Source: Veridion
Integrating additional information like this can improve model accuracy. Of course, it also helps lenders extend credit to underserved thin-file or credit-invisible applicants.
However, non-financial inputs must be governed carefully to avoid bias and unlawful proxy discrimination.
The answer to thin files is not to collect any data available. It’s to use transparent, business-relevant signals that show how the company operates right now.
That’s where digital footprints come in.
What Digital Footprints Reveal
Every active business leaves evidence of its operations online.
Here’s how this might look:
Digital signal | What it reveals |
|---|---|
Company website | Products and services offered |
Job listings | Hiring priorities and business investment |
Location pages | Geographic presence and expansion |
Technology stack | Operational capabilities and digital maturity |
Public records & news | Certifications, ownership changes, and major business developments |
The Federal Reserve classifies digital footprints as a form of non-financial alternative data, alongside geographic and online behavioral information.
It distinguishes these signals from financial alternative data: monthly cash flow, sales, expenditures, deposits, payment activity, and so on.
In SMB underwriting, digital signals show what is changing operationally. Meanwhile, bank, bureau, and accounting data show how those changes are affecting cash flow and repayment capacity.
Below, we explore three types of digital signals that can reveal how an SMB is evolving between reporting periods.
Shifting Product Offerings
A company’s website often changes before its financial statements do.
- New product pages can signal diversification or expansion
- Removed listings might reveal contraction, inventory problems, or a strategic retreat
- Rewritten service descriptions can reveal that a company is repositioning itself toward a new customer segment or business model.
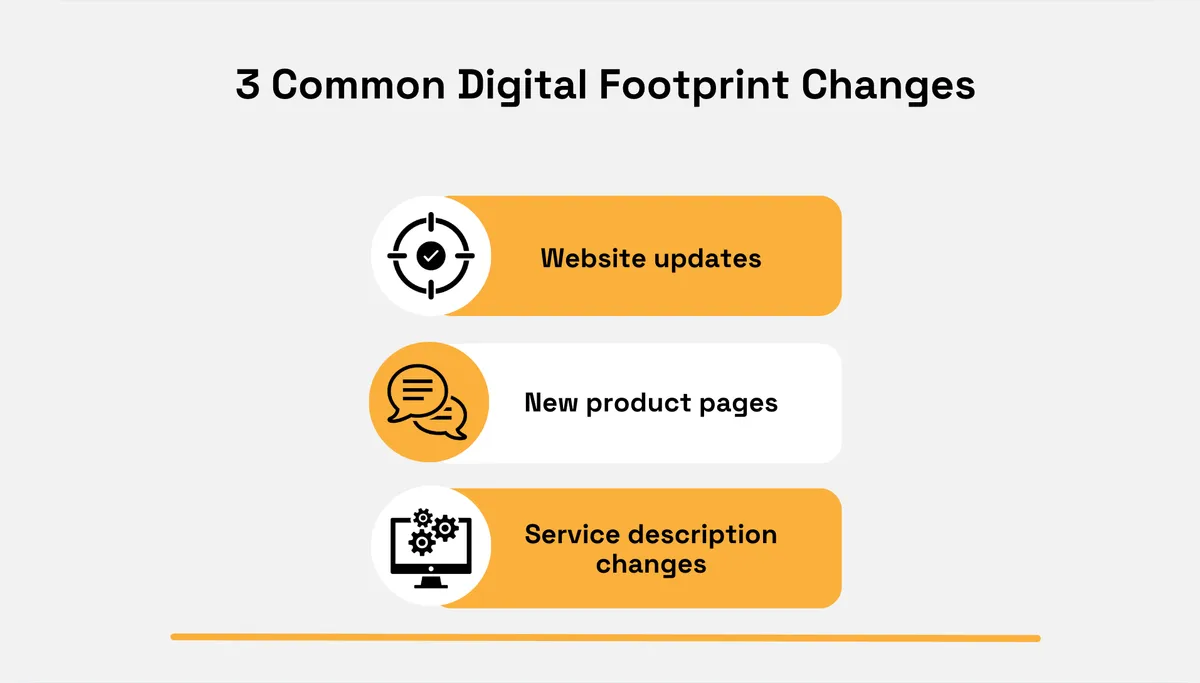
Here are some of the most common digital footprint changes tracked as business signals:
Source: Veridion
Neither of these signals is proof of financial strength by itself.
Businesses sometimes publish products they have not yet sold, or announce expansion plans that never materialize. And the list goes on.
A website update thus has to be verified against other evidence. That can be anything from hiring activity to payment flows, corporate records, and location changes.
Nevertheless, product-level changes can provide an early view of direction.
Here’s an example from our database. It’s a business that initially appeared to be a coffee shop. A closer analysis of its website revealed that it also sold marijuana and CBD products.

Source: Veridion
Not only is the business name misleading, but the actual products are associated with a very different risk profile. The company's digital footprint thus painted a more complete picture of its operations than its broad business description alone.
And the same principle applies to any evolving business.
A supplier that gradually adds new product lines, technical documentation, certifications, or export-market pages may be signaling a strategic expansion months before those investments appear in annual financial statements.
Likewise, shrinking product catalogs or service offerings can reveal contraction well before this declining performance shows up in a report.
Website changes don't prove a company's financial health. But they can reveal strategic shifts early. And that gives lenders another valuable signal to use together with financial data.
Hiring Momentum Signals
Hiring activity gives you another forward-looking view. The reason is simple: companies often recruit before expected growth reaches their accounts.
The table below shows how hiring can signal business direction:
Hiring activity | May suggest |
|---|---|
Increased hiring | Business growth |
Hiring slowdown | Slower expansion |
Hiring freeze | Cost control |
Layoffs | Financial pressure |
The number of vacancies is only part of the picture, though.
The roles themselves add a lot of context. For example, recruiting drivers points to a different trajectory than recruiting software engineers.
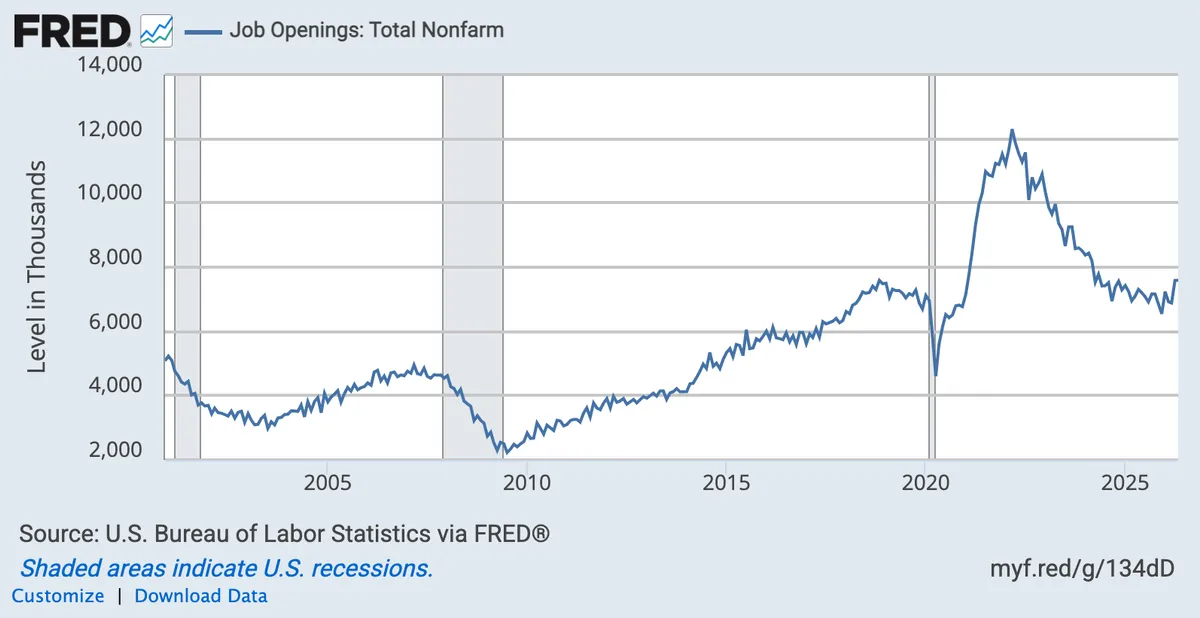
Economists already use job openings to evaluate broader economic health.
The Federal Reserve Bank of St. Louis describes openings as a major indicator.
Source: FRED
They also explain that near-daily job-posting data can reveal changing labor demand sooner than slower monthly series.
At the company level, the same logic supports underwriting.
A sustained increase or sudden disappearance of vacancies doesn't prove a business is growing or struggling. But combined with signals like layoffs, leadership changes, shrinking product offerings, or declining transaction activity, it can strengthen the case for closer review.
Geographic Footprint Signals
Geographic footprint changes add another operational layer.
Opening a warehouse, branch, clinic, or office usually requires capital. It also reflects an expectation of future demand.
Relocation into a larger facility may indicate growth. Consolidation can suggest cost-cutting or a shift toward a leaner model.
Store closures are just as crucial to track. These moves often become visible before the full financial effect appears in annual statements.
Take the Ted Baker case.
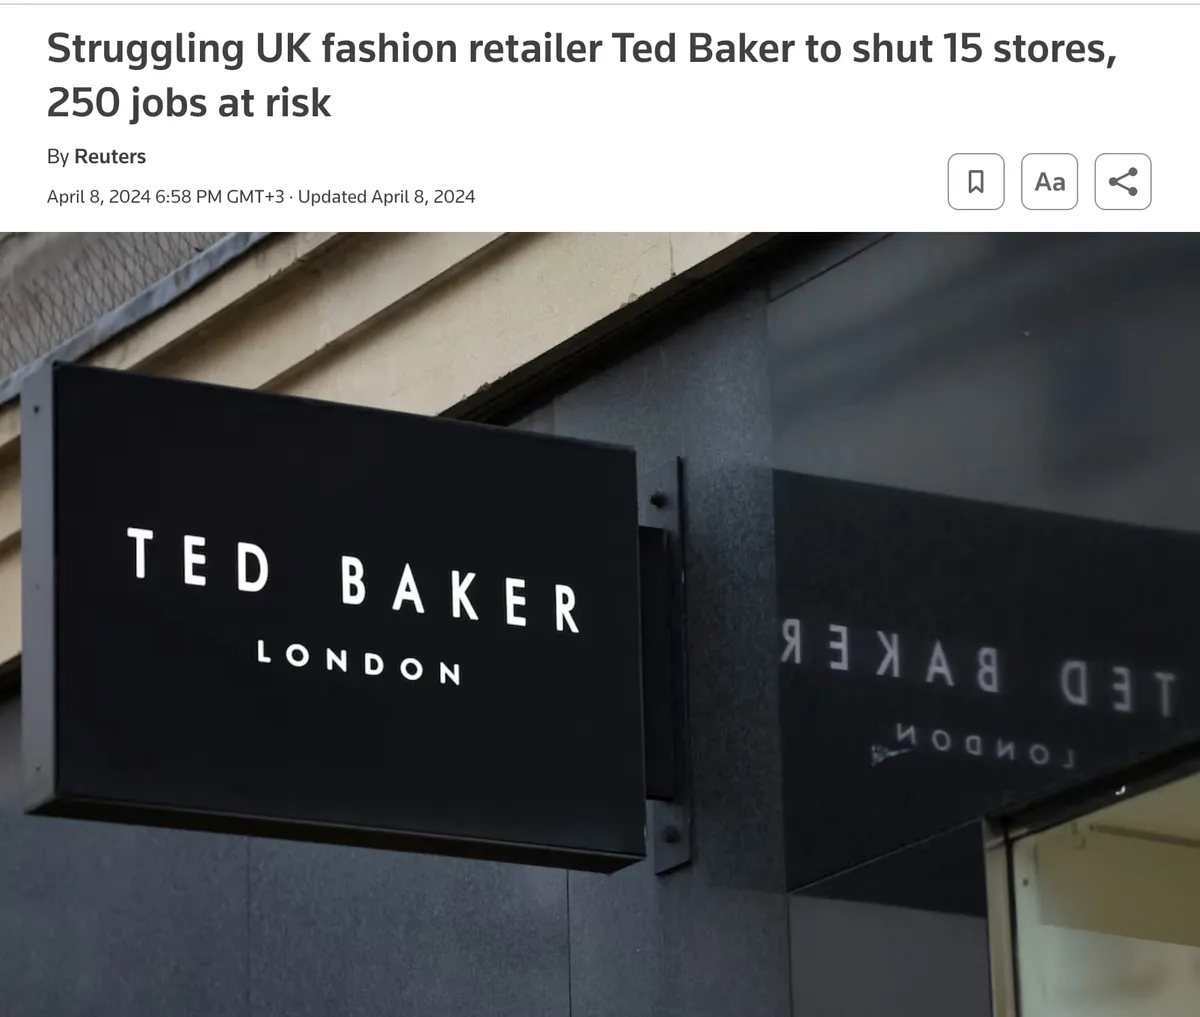
In April 2024, Reuters announced that struggling fashion retailer Ted Baker would close 15 UK stores, putting around 250 jobs at risk.
Source: Reuters
Those location and workforce changes provided immediate evidence of contraction. Meanwhile, their formal financial reporting described an earlier, more optimistic period.
However, location loss must be interpreted carefully. A company can also close smaller sites to improve profitability or efficiency, or move online.
That’s exactly why there isn’t any single digital signal that should determine a final credit decision.
The value comes from convergence.
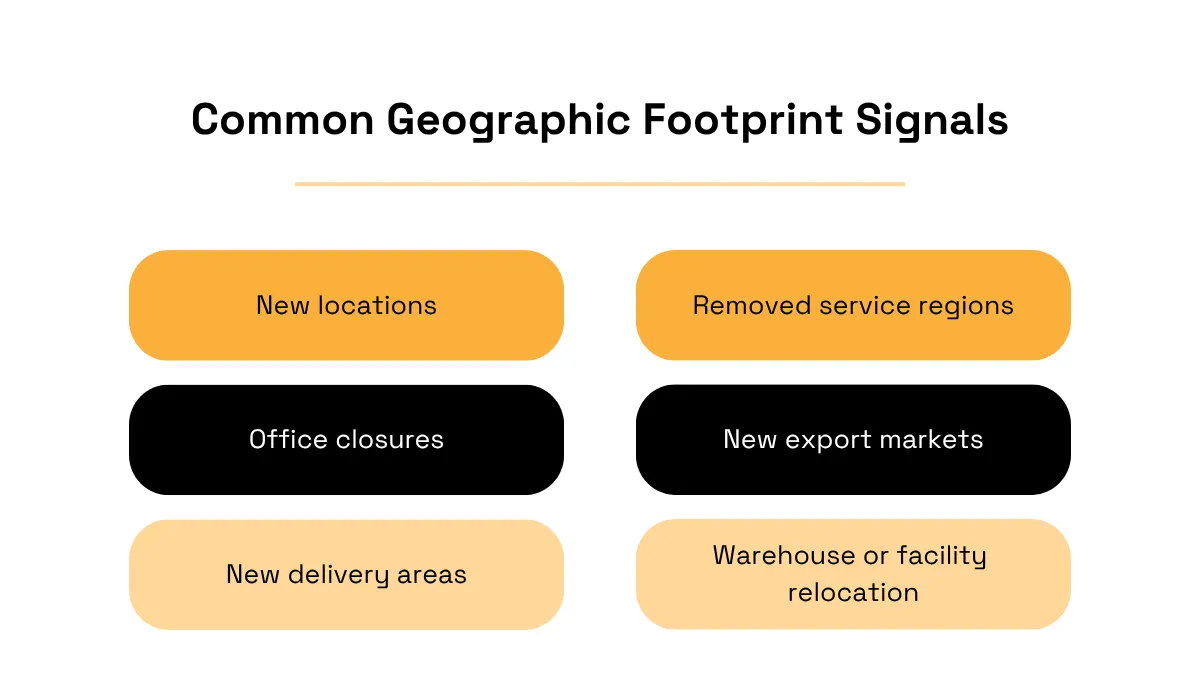
The visual below shows the most common geographic footprint signals tracked:
Source: Veridion
Combine these with hiring, products, locations, technology use, or cash flow, and you gain a much stronger view of the company’s trajectory.
Turning Signals Into Predictive Data
Raw web data is not automatically useful underwriting data.
You can have a list of URLs, job advertisements, or website screenshots, all recent and relevant. But that still leaves analysts to identify the company, remove duplicates, interpret each change, and decide whether it matters.
At enterprise scale, that process quickly becomes too slow and inconsistent.
Predictive underwriting needs signals to be structured.
This is where Veridion fits into the process.
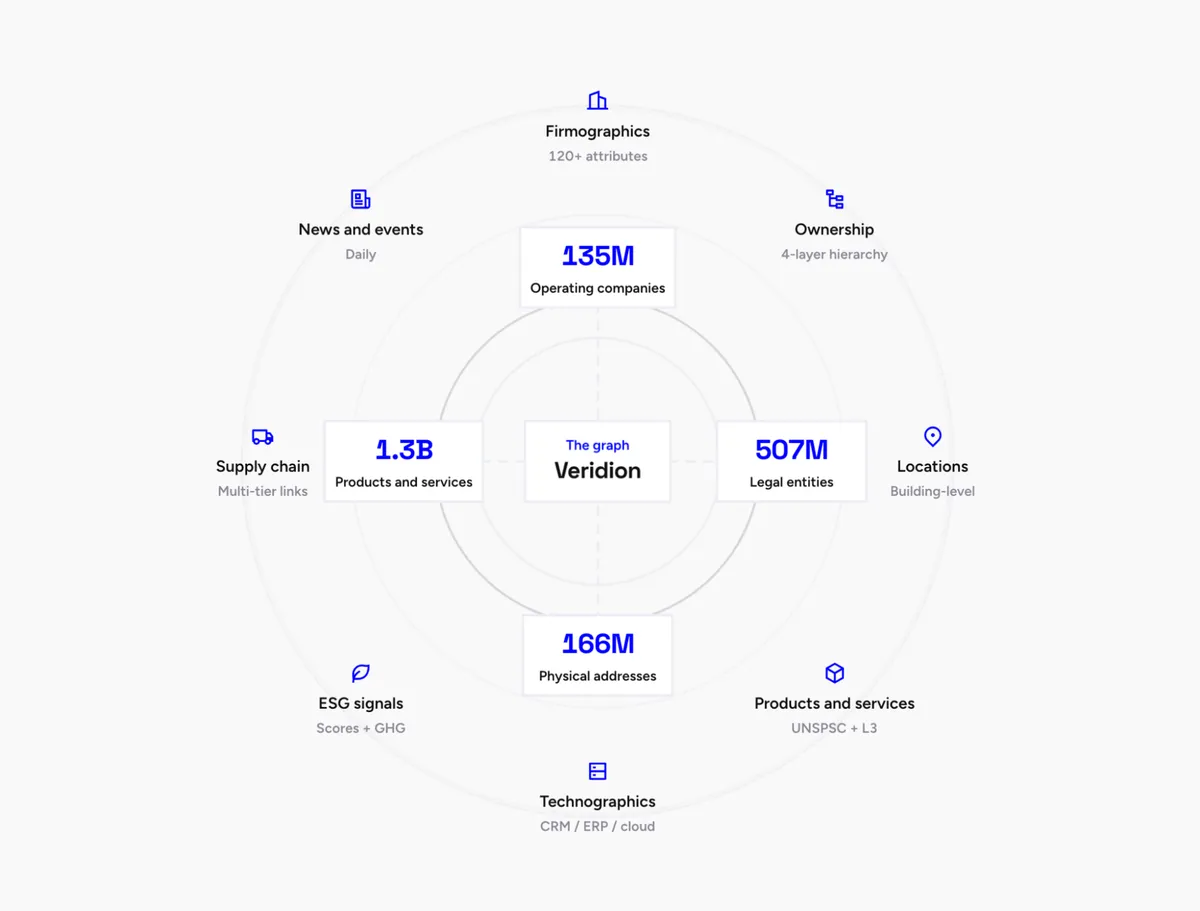
Veridion structures company intelligence across firmographics, products and services, locations, web presence, hiring activity, and technographics.
Source: Veridion
Rather than handing underwriting teams isolated web results, Veridion resolves those signals into company-level records that can enrich existing models and workflows.
This distinction is crucial.
A raw job advert is unstructured evidence. A verified increase in hiring activity, attached to the right legal and operating entity and compared over time, is a machine-readable risk attribute.
The same applies to a new office address, an expanded product portfolio, a detected change in the company’s technology stack, etc.
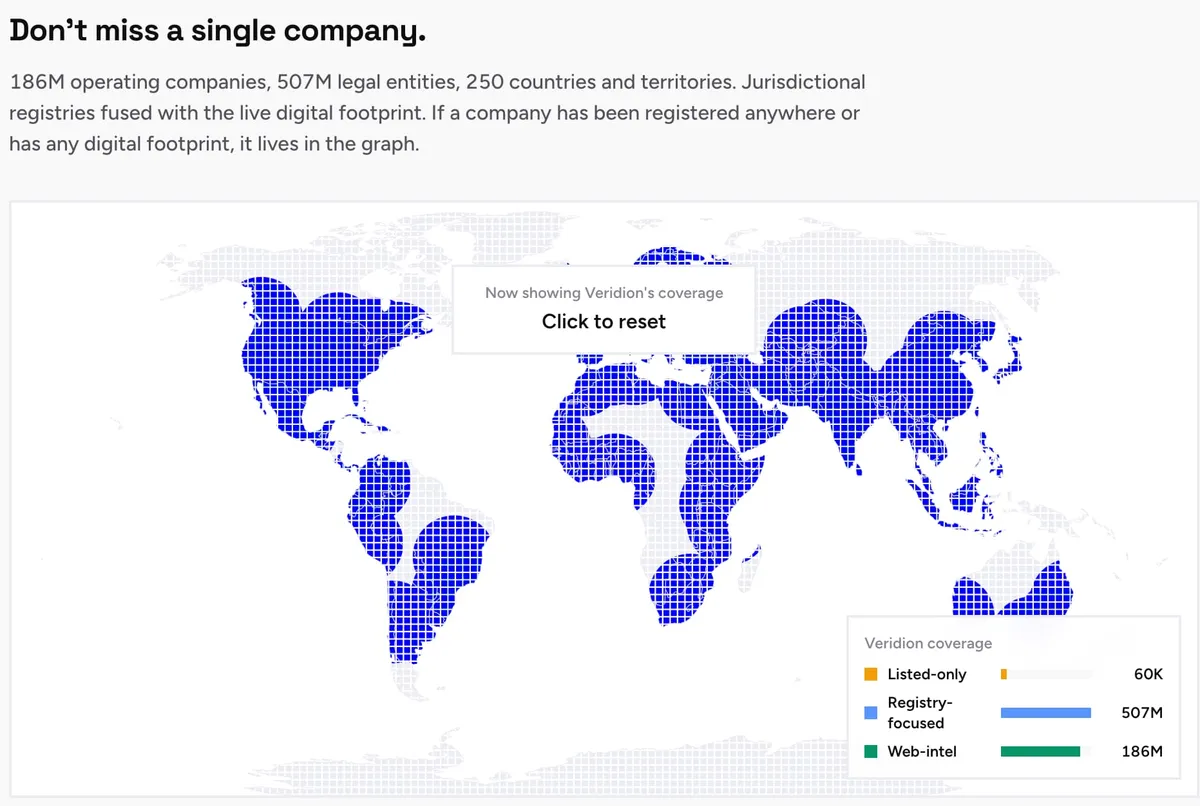
Now, we cover 186M operating companies across 250 countries. And we do so by analyzing over ~1.4B web pages per month.
Source: Veridion
But let’s clarify something first.
Veridion’s data is not a substitute for tax returns, bank transactions, credit bureau records, or accounting information. Its role is to supply the current operational context those traditional sources lack.
Combined, these inputs answer different parts of the underwriting question:
- Tax returns establish reported historical performance
- Bank and payment data reveal current liquidity and cash-flow behavior
- Bureau data shows repayment and trade-credit history
- Digital-footprint data reveals operational momentum, contraction, and strategic change.
- Registry and ownership data confirm the entity behind those signals.
Together, these datasets create a more complete underwriting picture. Financial records explain where a business has been. Structured digital signals reveal where it may be heading.
That's what makes predictive underwriting possible.
By continuously tracking and structuring operational signals, underwriting teams can identify meaningful changes as they happen. That leads to better, more informed decisions.
Conclusion
And that brings us to the end of this article.
By combining historical financials with current product, hiring, location, technology, cash flow, and credit signals, you can assess both past performance and present momentum.
That means fewer thin-file blind spots, and stronger decisions throughout the lending relationship.
SMBs move quickly. Your underwriting data should be able to keep up.
Articles
Discuss how these trends affect your organization.
Our analysts are available for a short call. Bring a specific question and we will ground it in the data.
Insights
Keep reading
More analysis, research, and outcomes grounded in live company intelligence.
Underwriting Data Analytics: A Guide
Learn what underwriting data analytics is, how it’s being used, and the best practices to keep in mind when implementing it.
Understanding SMBs digital footprint for better business underwriting
Can a deep understanding of a business's digital footprint solve the classification problem that causes billions in losses in industries like insurance and...
How Successful Companies Use Market Intelligence for Business Growth
Discover how successful companies use market intelligence to unlock new growth opportunities. Learn more in our latest guide.