Insights / Articles
ABM Without Guesswork: 5 Firmographic Filters That Separate Tier-1 Accounts from Noise
Tired of sifting through endless leads? Uncover the 5 essential firmographic filters that pinpoint your Tier-1 accounts.

- Layered, data-backed filters separate a real buyer from a company that just looks good on paper.
- A deal can die from looking too small to an account just as easily as too big.
- A textbook ICP match sitting still is a weaker bet than a scrappier account that's visibly growing.
- Pulling a firmographic filter from one structured source beats using several disconnected tools.
In most cases, account-based marketing (ABM) campaigns don't fail because of a lack of accounts, but because the account list was wrong from the start.
Too often, teams build account lists based on intuitive firmographics and get surprised by poor win rates months later.
The fix isn't more data; it's the right five filters, applied in the right order, so your Tier-1 list holds only accounts structurally capable of buying, not just accounts that look good on a slide.
Below are five firmographic filters that separate real Tier-1 accounts from noise, plus how to combine them into a scoring model instead of a series of pass/fail cutoffs.
1. Revenue Band Alignment With Deal Size
The first filter is arithmetic rather than strategic: does the company have realistic revenues to make your typical contract value achievable?
One popular approach is to determine the ratio between a contract and a potential client's annual revenue. Then use that as a filtering range rather than an outright cutoff. This filters out companies whose contract value would be an unrealistic portion of their annual spending.
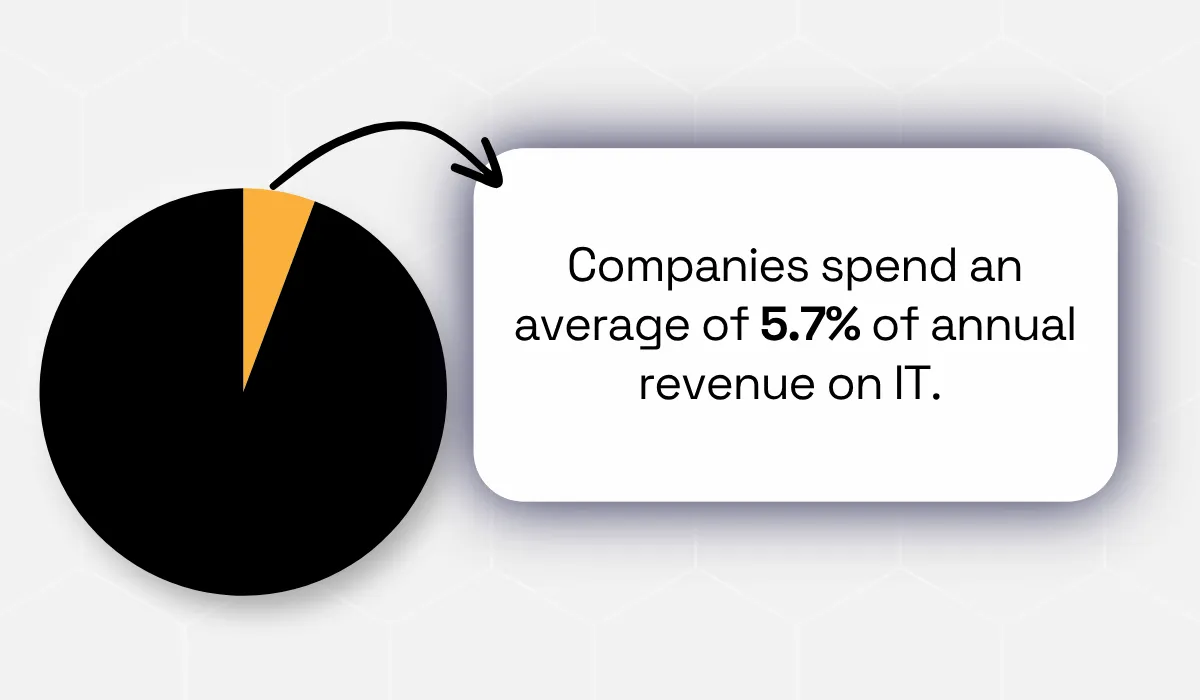
According to Vera AI, a sourcing and buying company, businesses generally dedicate 2% to 10% (depending on industry) of annual revenue to technology spend, averaging around 5.7% globally.
What this means is that a company with $8 million in annual revenue evaluating a $150,000 contract is being asked to commit close to 2% of total revenue to a single vendor, a stretch before any other software cost gets counted.
Offer that same contract to a $500 million company, and it barely registers, which sounds like an easy win until you look at how the process might go.
Here's where it gets interesting: the revenue band has to work in both directions. A prospect at the low end may need multiple budget cycles to justify the spend.
A prospect far above your typical deal size may see the contract as too small to route through formal procurement, which quietly kills deals rather than outright rejecting them. They just never get prioritized against bigger internal budget fights, and the deal never reaches a decision-maker with authority to move fast.
The goal is to define both a low end at which your typical deal will still be within a reasonable technology budget and a high end at which your deal might appear trivial to someone who usually signs enterprise-level contracts.
What do you do if a company ends up outside of your revenue band? Do you exclude it from further consideration without thinking twice?
Of course not.
You need to consider your revenue band along with industry fit and buying signals.
A company in the border zone just outside your ideal band with significant growth signals could very well deserve your nurturing efforts, just not quite to the extent that your ideal band does.
Place borderline accounts in a lower level, then upgrade them once they show engagement or stronger signals.
2. Industry-Specific Pain Point Match
Industry codes show you what sector your account belongs to. But they don't say whether a particular company has the problem you're trying to solve.
Research by Relativity6, an underwriting data company, states that North American Industry Classification System (NAICS) and Standard Industrial Classification (SIC) codes are accurate for only 73% of first-year submissions. This accuracy declines further during renewal, when businesses change direction, open locations, or merge with other businesses.
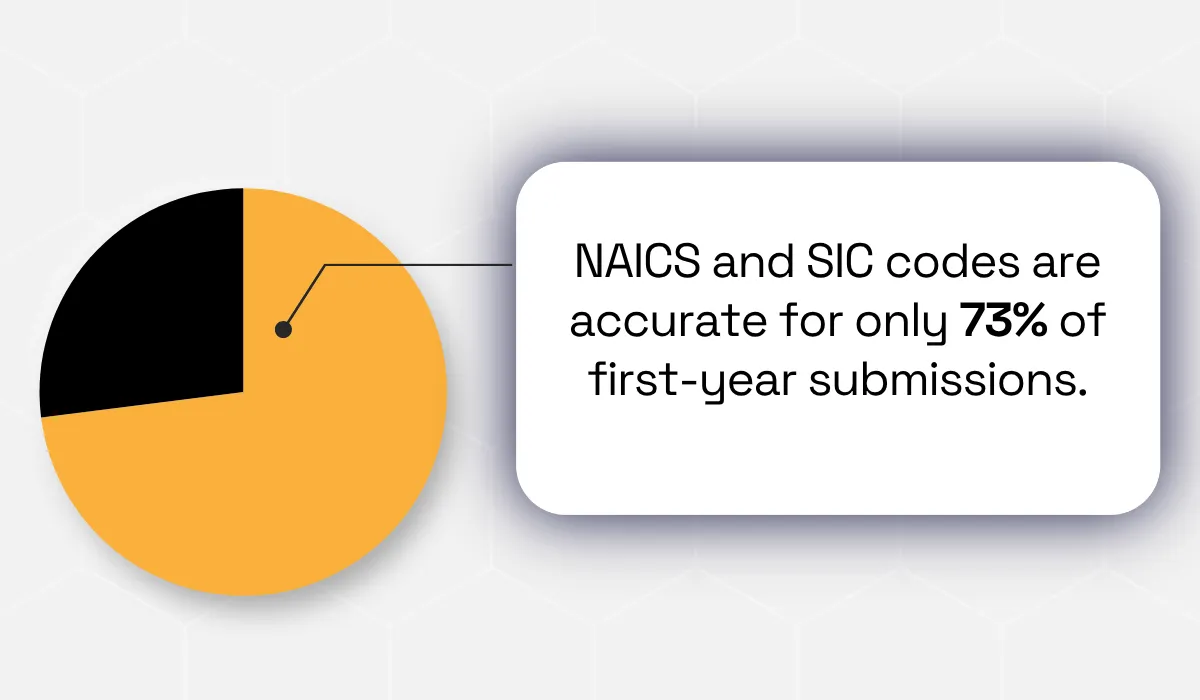
Illustration: Veridion / Data: Relativity6
Additionally, two companies can carry the exact same NAICS or SIC code and operate completely differently.
One manufacturer under "motor and generator manufacturing" might build small precision components for medical devices, while another under the identical code builds heavy industrial turbines for utilities. The pain points, buying cycles, and compliance burdens for each look nothing alike.
Using a code alone creates false positives: companies may have this industry code but not the problem you're trying to solve. It also creates false negatives by missing companies with adjacent codes that closely match your pain points.
The solution? Do not stop at this code; go on to evaluate particular business characteristics:
- What product/offerings does it manufacture/provide?
- What are its certifications?
- What does the business website say about its operations, in plain language rather than classification jargon?
A manufacturer that is ISO 9001 certified and has a documented quality program is completely different from one with the same NAICS code but no record of certification.
The most reliable way to validate this theory is to return to your closed-won data and analyze additional information beyond the industry profile, such as certifications and other characteristics.
If your closed-lost accounts have the same industry profile as closed-won accounts, it means that your ideal customer profile (ICP) is missing one level of segmentation, and you should look at business characteristics rather than industries to determine the difference between your buyers and browsers.
3. Growth Trajectory
A company that matches every firmographic box but shows zero movement is a weaker tier-1 candidate compared to a good-fit company actively expanding right now.
Growth signals matter because they indicate a company is investing in new infrastructure and tools at the exact moment you're trying to sell into it. This gives you the best odds of getting a hearing. This window is short, though, so use it wisely.
The six months after a funding round will be the highest-intent period a growing account will give you. That's when budgets get allocated, and new tools get evaluated, before the next planning cycle locks spending back down.
Company growth can show up in several data points, including headcount growth, a recent funding round, and a new office opening. Each of these data points carries some weight individually, but layering two or three together is far more reliable than leaning on any single signal.
A company hiring aggressively with no funding event behind it might simply be backfilling attrition. A company that raised a round eighteen months ago with no hiring movement since may have already finished its buying cycle.
If you pair a funding round with a related executive hire in the same 30-day window, you'll open two buying triggers simultaneously and convert far better than using either signal alone.
Research shows that stacked signals convert at five to ten times the rate of a single signal or cold outreach.
That said, treat every growth signal as time-sensitive. A hiring spike from a year ago tells you very little about the opportunity window you have today.
Set a recency threshold to filter out anything older than the last two quarters to ensure that a tier-1 status is based on who is expanding right now, and not who was expanding a year ago.
4. Technology Stack Gaps Your Product Can Fill
Knowing what technology a prospect uses tells you if your product fills a technology gap, integrates into their stack, or replaces something they already have.
A prospect with no tool in your category needs education about the category itself before considering a vendor.
A prospect running a direct competitor already understands the category and has budget allocated to it. They require a different conversation entirely, closer to a displacement play than an introduction.
A prospect running a complementary tool your product plugs into needs neither. It needs proof the integration actually works.
Technographic segmentation looks something like this:
Technographic Scenario | Buyer Mindset | Messaging Angle |
|---|---|---|
Gap-filling (No tool yet) | Doesn't know the category yet, so there's nothing to compare you against | Introduce the problem first, then position your product as the entry point |
Integration selling (Runs a tool you plug into) | Already sold on the workflow, just needs the connector to work | Skip the pitch, lead with proof the integration actually works |
Competitive displacement (Runs a rival's product) | Understands the category already, but switching costs slow them down | Pair with a trigger event, like a renewal window, and argue the switch |
Segmenting accounts by which of these three buckets they fall into, rather than treating "uses relevant tech" as one undifferentiated group, sharpens your sales messaging.
While technographic fit is an important signal, it is neither a disqualifying nor a qualifying signal on its own. A company with a perfect technological fit but the wrong size and industry is still a bad tier-1 prospect.
Technographic signals should therefore be considered alongside firmographic filters as part of a combined score, rather than an independent gate.
Most sales teams apply firmographic filters first to understand their addressable market, then add technographic data to prioritize accounts and develop a targeted message.
This turns a list of ten thousand loosely qualified accounts into a few hundred where outreach has a real reason to exist.
Data sources for technographic detection generally fall into two camps. Active detection scans a company's website for front-end code, JavaScript snippets, and analytics tags, which is fast but blind to backend or internal systems.
Passive detection uses a stack of job postings and public hiring data to uncover technologies that companies never list on their websites. However, it has a lag of several months, since not every company publishes all job positions publicly.
Using either method alone will leave you with incomplete insight. Blend both and attach a confidence score to each data point so you can filter out weak or stale signals before they influence a tier-1 decision.
5. Geographic Proximity to Existing Customers
Getting another deal from a prospect neighboring your top customer is much easier than from someone on the opposite coast or even outside of your vertical. This is even more true for teams that still close deals in person.
Proximity supports easier reference selling, because a nearby, comparable company's experience carries more weight with a buyer than a case study from an unfamiliar region ever will.
Targeting companies near your best existing customers turns your case studies into something a prospect can practically walk across the street and verify.
Noah Goldstein, Robert Cialdini, and Vladas Griskevicius's research on social proof shows that localized, similar-context proof outperforms general social proof by roughly 33%.
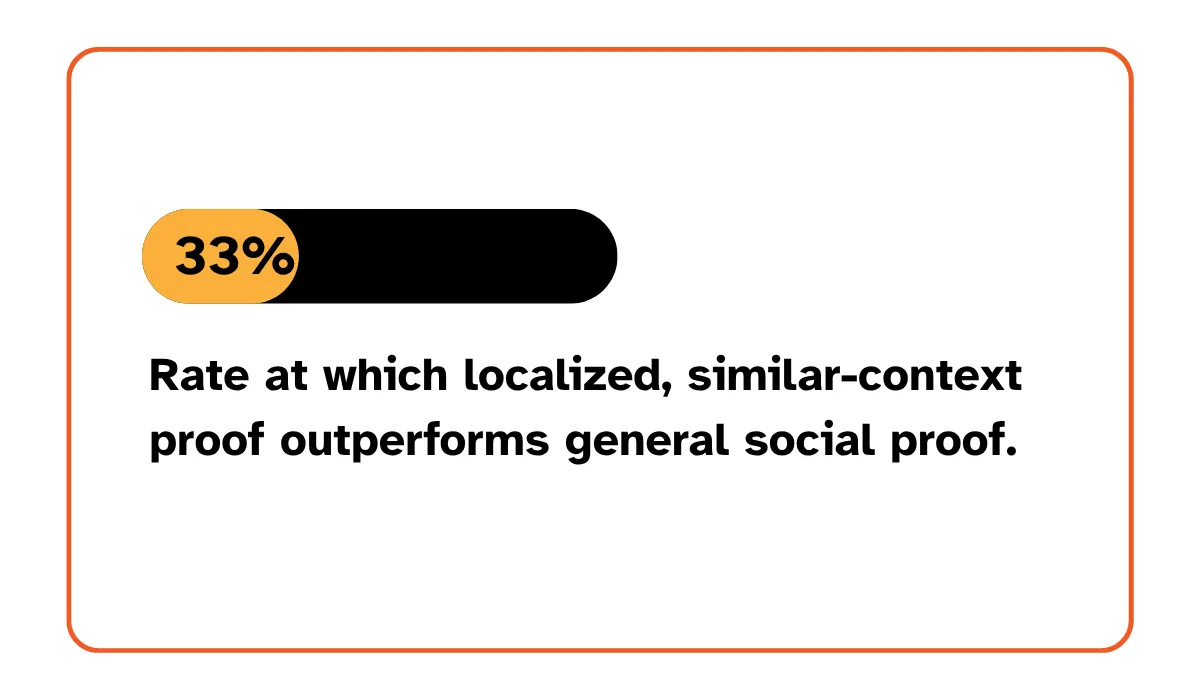
Illustration: Veridion / Data: Journal of Consumer Research
In B2B terms, a prospect trusts "the company two miles away that had your exact challenge" far more than a logo from an unrelated market on the other side of the country.
In practical terms, a manufacturer in one state cares more about how you helped a manufacturer in a neighboring state facing the same regulatory and labor conditions than about a tech company's success story from a different industry entirely.
For teams that still sell in person, proximity also drives operational efficiency. According to Passionfruit, a search optimization platform, companies that focus lead generation within about 50 miles of their current operations spend 30% to 40% less to acquire new customers than teams running exclusively national campaigns.
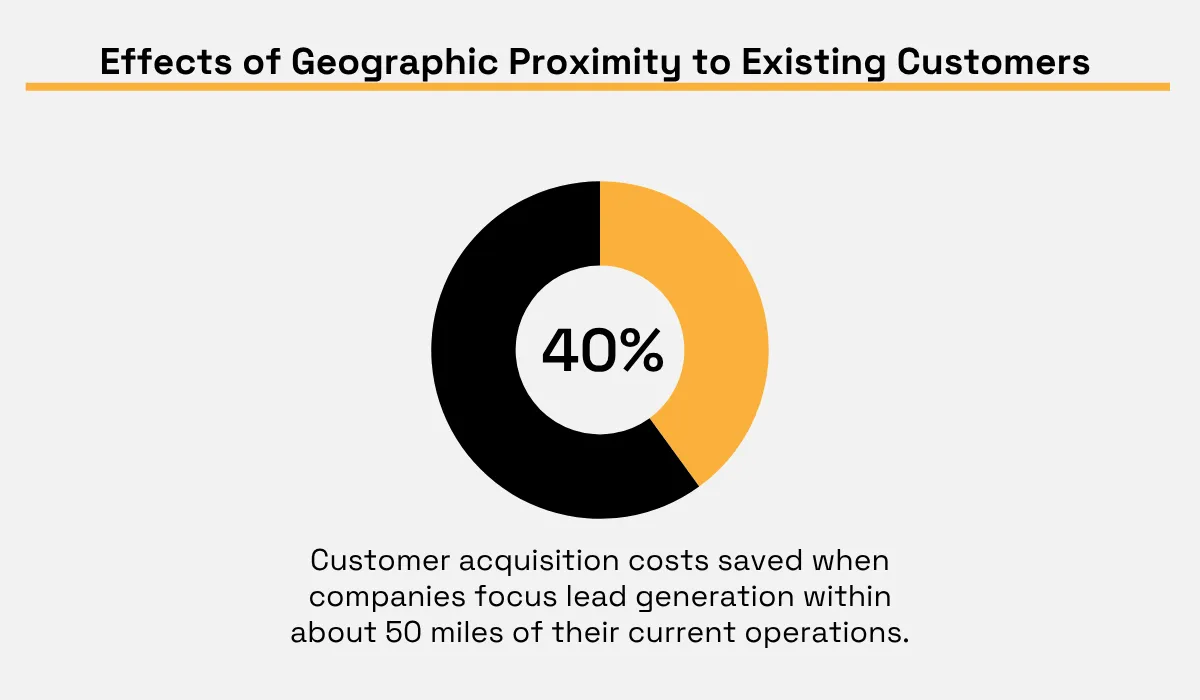
Illustration: Veridion / Data: Passionfruit
This is largely because reps don't have to incur travel expenses, and regional sales managers work more effectively in concrete territories they can cover by car.
Regional territories also come with shared context, local compliance requirements, industry meet-ups, and a regional peer network that reps working accounts scattered across time zones can't access.
However, this filter matters far less for fully remote or digital-first sales motions, where a prospect never expects an in-person visit and a distant case study carries as much weight as a local one.
If your team conducts sales strictly via video calls and self-serve product trials, score proximity lower. Then prioritize industry and technographic similarity over geographical closeness.
But if you still do field sales or regionally focused events, prioritize proximity highly in your scores, since the underlying efficiencies and increased trust are inherent, not superficial.
Veridion: One Source for All Five Filters
Applying these five filters well typically requires stitching together data from several disconnected sources: a firmographic provider for revenue bands, a technographic vendor for stack data, a separate signals tool for growth events, and a manual process for mapping customer geography.
This will probably work well for you, but there's a catch.
It comes with additional vendor costs, integration overhead, and most importantly, a delay in getting your signal because of the lag between when your system triggers and when your rep sees it.
Veridion is such a tool. Its company enrichment service tracks 461 attributes per company across a continuously refreshed graph of 693 million companies, covering all five filters in one structured profile instead of a patchwork of point tools.
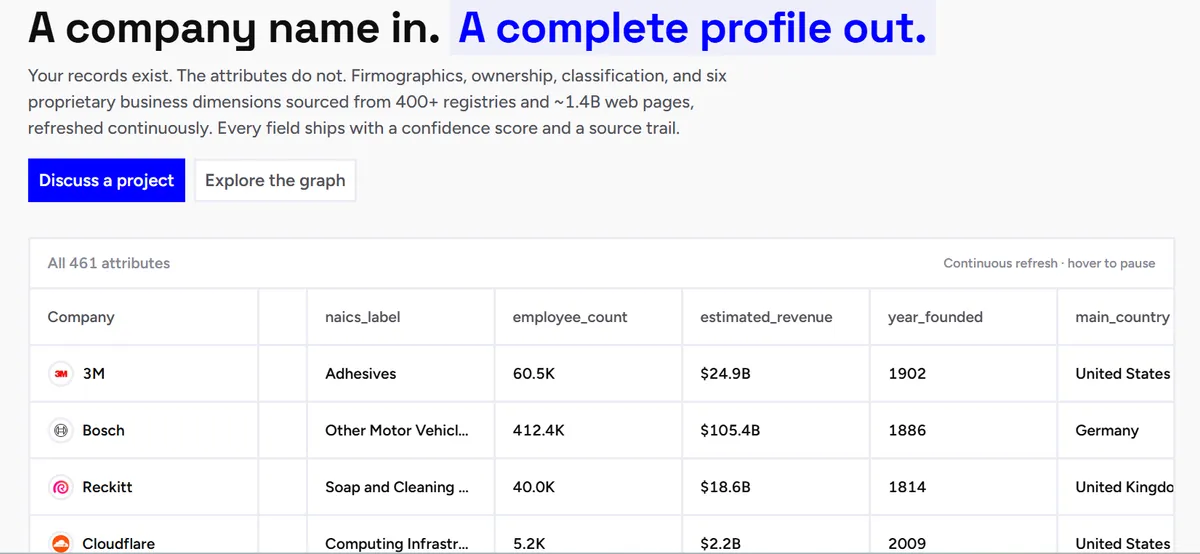
Source: Veridion
That structure means revenue band alignment, industry-specific business characteristics like certifications and core offerings, growth indicators, technographic fit, and location all sit in one place instead of five different platforms.
For revenue operations teams building this kind of layered account model directly into a CRM or scoring workflow, Veridion's company enrichment and search API feed that structure into existing pipelines. The revenue operations solution applies the same graph to ICP scoring and CRM fill rate at scale.
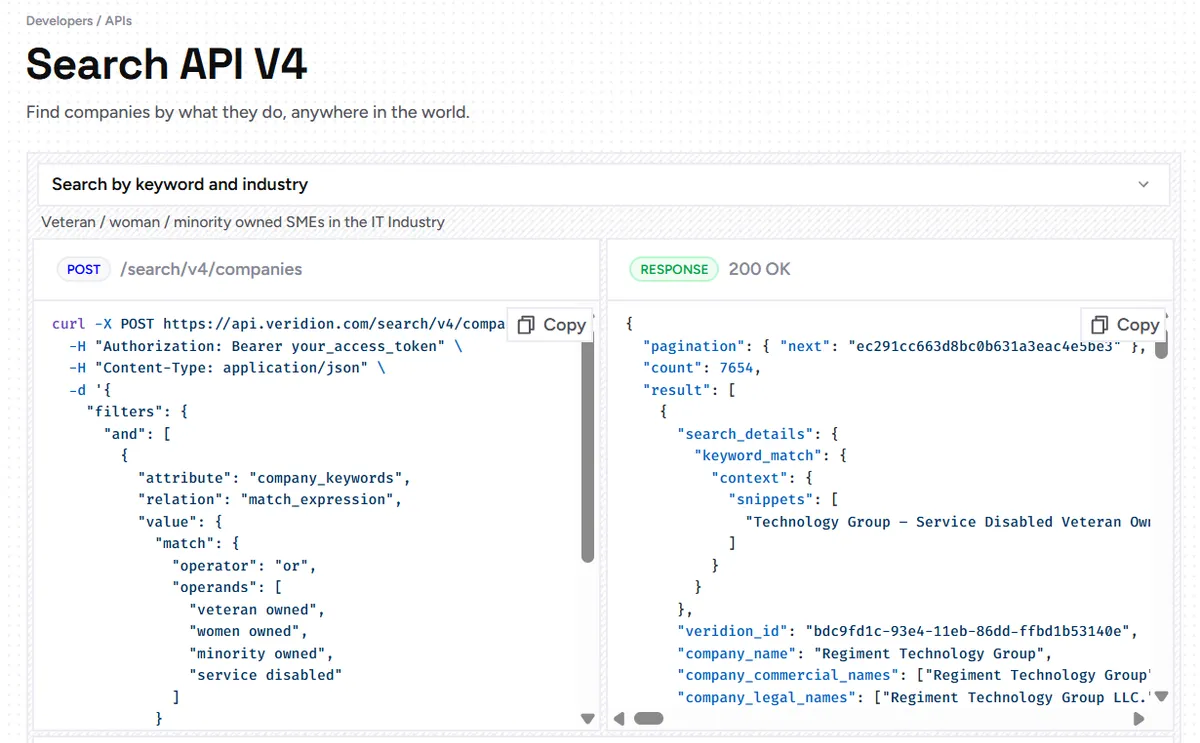
Source: Veridion
Instead of maintaining five separate vendor relationships and five separate data refresh cycles to maintain one account list, your team now only needs to manage one refreshed source.
Conclusion
Stop guessing whether or not an account belongs on your tier-1 list. Run revenue band, industry-specific pain points, growth trajectory, technology stack gaps, and geographic proximity together, and let the accounts that survive all five earn your best sales hours.
The teams that get this right aren't working harder; they're working a shorter, sharper list, and that's the entire point of ABM.
Articles
Discuss how these trends affect your organization.
Our analysts are available for a short call. Bring a specific question and we will ground it in the data.
Insights
Keep reading
More analysis, research, and outcomes grounded in live company intelligence.
How to Build a Firmographic Lead Scoring Model That Actually Predicts Revenue
Looking to build a firmographic lead scoring model? This guide will show how company data can help prioritize leads and improve revenue predictions.
What B2B Teams Get Wrong About Data Privacy When Enriching Company Records
Are B2B teams making critical data privacy mistakes when enriching company records? Avoid costly errors with insights on firmographic data providers.
Which Online Business Data Providers Stand Out in Today's Market?
This article will highlight online business data providers that businesses trust for accurate company information and actionable insights.