Insights / Articles
How to Build a Firmographic Lead Scoring Model That Actually Predicts Revenue
Looking to build a firmographic lead scoring model? This guide will show how company data can help prioritize leads and improve revenue predictions.

- Structure your model based on closed-won and closed-lost records.
- Test every attribute against your baseline close rate before weighting it.
- Completeness beats calibration.
Most lead scoring models reward familiarity over fit.
The problem is that patterns from past wins can easily be biased to reflect only what your pipeline looked like, as opposed to scoring leads based on what actually drove the close.
A model that can’t recognize this difference and adjust accordingly will send sales after the wrong accounts with full confidence.
Here’s how to fix this, step-by-step.
Step 1: Pull and Structure Closed-Won Deal Data
A firmographic scoring model is only as good as the data it’s built on.
Before assigning a single point value or weight, you need to know what your actual won deals look like. If you’re operating based on assumptions or feel at any point in your current process, that’s got to change.
Your first stop: a deep-dive into your customer relationship management (CRM).
1a. Extract Firmographic Attributes from Won Deals
Start with your last 100 to 200 closed-won deals.
For each one, extract the core firmographic attributes:
- Industry vertical
- Employee count
- Annual revenue band
- Geography
These are the four fields that consistently appear as the first layer of any firmographic scoring model, because they’re both reliably available and predictive across most B2B contexts.
Tabulate them in a spreadsheet. Patterns you’d never have assumed tend to surface fast.
The 100-to-200-record threshold isn’t arbitrary. As B2B lead-generation company GrowLeads explains, a reliable model needs roughly 10 to 20 positive outcomes per variable in the model. With 5 variables (a sensible starting point), 100 closed-won deals gives you enough signal to derive meaningful weights.
The same logic caps the other end. A 40-variable model built on 150 records won’t hold up.
If you have fewer than 200 closed-won deals in the past 12 months, extend the time window to 18 or 24 months rather than shrinking the sample.
Getting this right is what stops the trust problem downstream. According to Forrester, a research and advisory firm, only 10% of B2B sales and marketing leaders say that their sales representatives have plenty of high-quality leads.
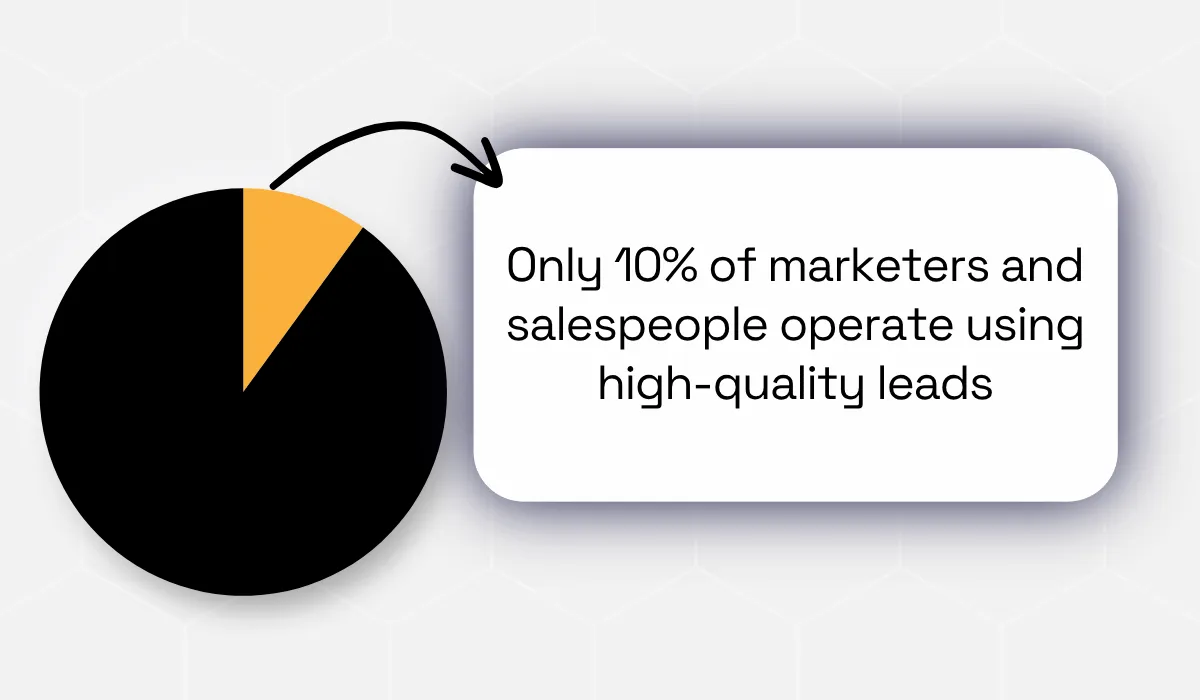
Teams skip this step because it feels laborious and unproductive. But intuition is only right some of the time, and the times it’s wrong drain your sales team’s trust in the scores they’re handed.
1b. Include a Comparable Sample of Lost Deals
But successes aren’t the only valuable resource to learn from. Your losses are just as important, if not more so.
A model built only on closed-won records can’t distinguish between an attribute that predicts a win and an attribute that’s simply common across all your leads, won or lost.
HubSpot’s 2024 Sales Trends Report specified that the average B2B win rate sits at around 21%.
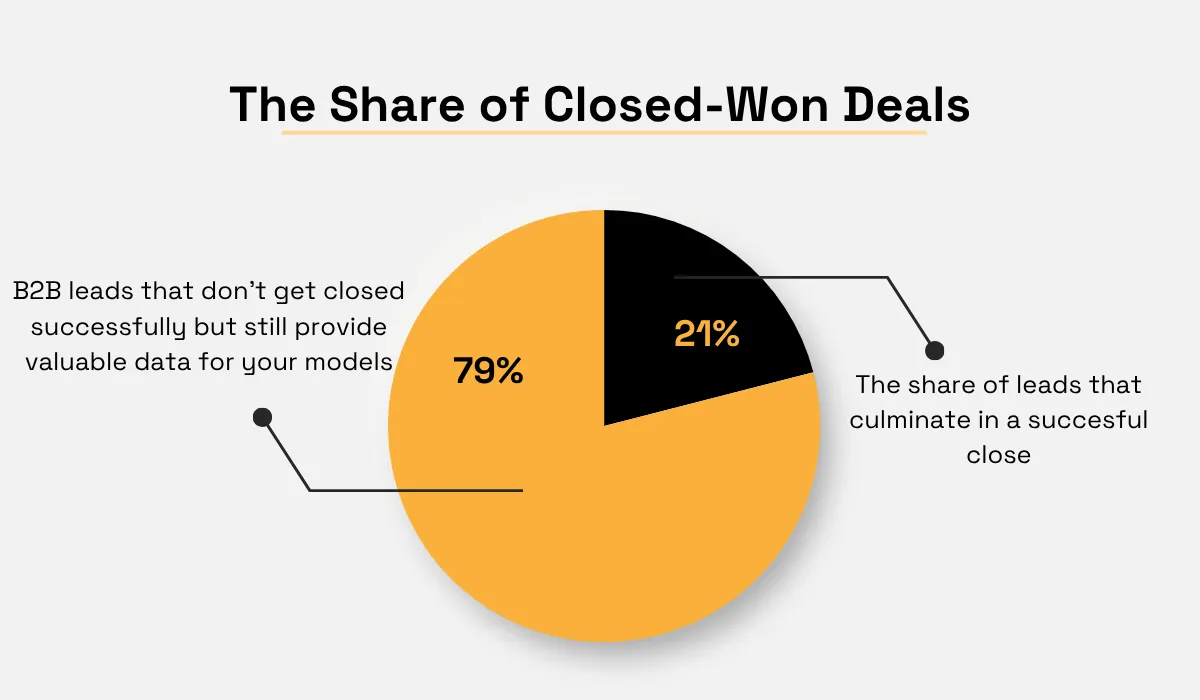
That means roughly four losses for every win. Building a model on the 21% while ignoring the 79% means training it on a fraction of the story.
Consider what that does in practice. If 70% of your pipeline is in financial services and 70% of your won deals are too, then that’s just what your pipeline looks like.
Left uncorrected, your model rewards financial services companies purely because they dominate the sample.
So, pull a sample of closed-lost deals alongside your won ones.
UserIntuition, a customer research platform, suggests a balanced composition of 40% to 45% lost deals relative to wins, though a matching 1:1 ratio should work just fine, too.
As for the time window, look across the last 12 to 24 months to generate enough volume to distinguish actual patterns.
Then compare. Identify which attributes appear in won deals at a meaningfully higher rate than in lost ones. Attributes showing up at similar rates in both should be set aside, as they carry little predictive value. The ones showing clear separation are where you should concentrate your scoring.
Don’t hesitate to implement AI tools to offload this burdensome and rigorous part of your workload, however. As Guy Rubin, CEO of sales platform Ebsta, puts it:

Whichever route you take – with AI assistance or without it – the tooling isn’t the hard part. What’s usually missing is the discipline to include and scan the losses.
Step 2: Identify Which Attributes Actually Predict Wins
Having the data structured is not the same as knowing what it means, let alone understanding how to best apply it.
When you define your ICP as “B2B SaaS, 100–500 employees, Series B or later,” what you’re describing are your past customers, not natural, best-fitting matches.
Narrowing your set of attributes down to the most effective ones will enhance the accuracy of your scoring model.
2a. Test Each Attribute Against Win Rate
Start by calculating your baseline close rate: the percentage of all deals in your dataset that closed won.
That single number is your reference point for everything that follows.
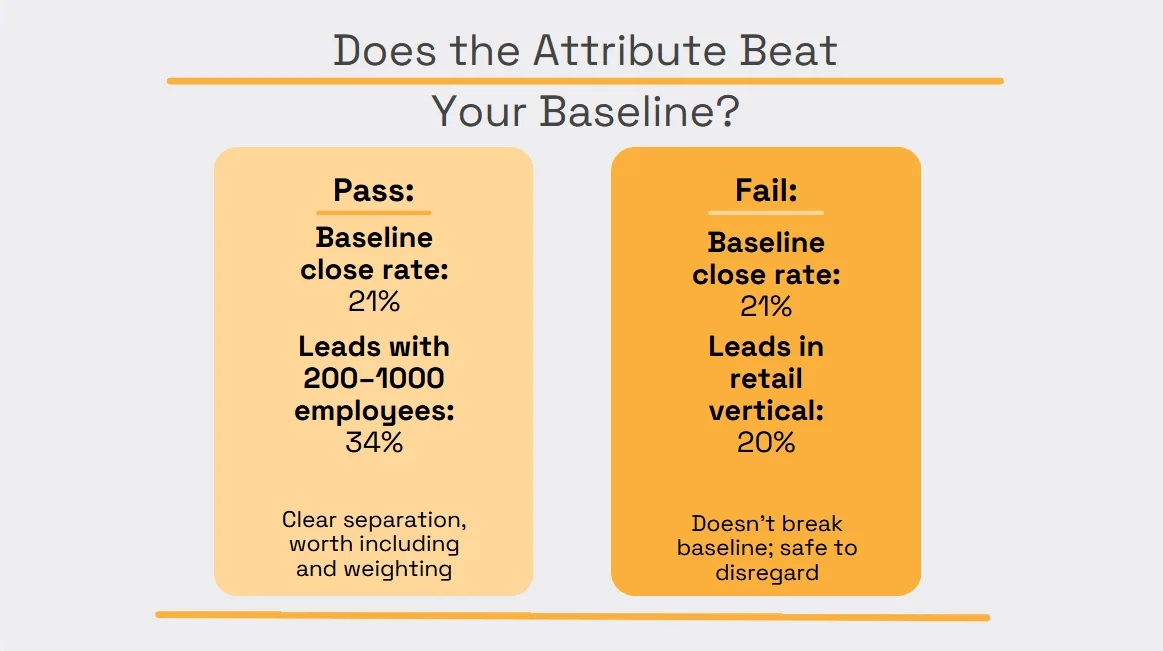
Then, for each firmographic attribute, calculate the close rate for each of its values and compare it against that baseline.
Salesforce’s lead scoring methodology describes the approach directly: compare attribute close rates against your overall conversion rate, and look for the ones that beat it.
If your overall close rate is 1% and leads with a given attribute close at 20%, that attribute carries 20x your baseline.
How much lift is enough? Lead-scoring company Breadcrumbs’ benchmarks put a working model between 3x and 10x. At 1.5x, you’re barely separating signal from noise.
Conversely, if an attribute’s close rate sits at roughly your baseline regardless of value, it isn’t telling you anything.
Source: Veridion
Data enrichment company Verum’s analysis of underperforming scoring models describes a pattern to avoid.
A team builds a model on company size, industry, and job title. Six months later, they find no correlation between score and conversion.
One practical guardrail before you weight anything: only include attributes where you actually have data. Verum’s rule is to start with factors populated on more than 70% of records. Below that, you can’t tell a real pattern from a small-sample coincidence.
When too many attributes fail to meet this criteria, consider introducing data enrichment best practices first. Working on faulty inputs will just leave you running in circles.
2b. Rank Attributes by Predictive Strength
Once you’ve tested each attribute, order them from strongest to weakest predictor of a win.
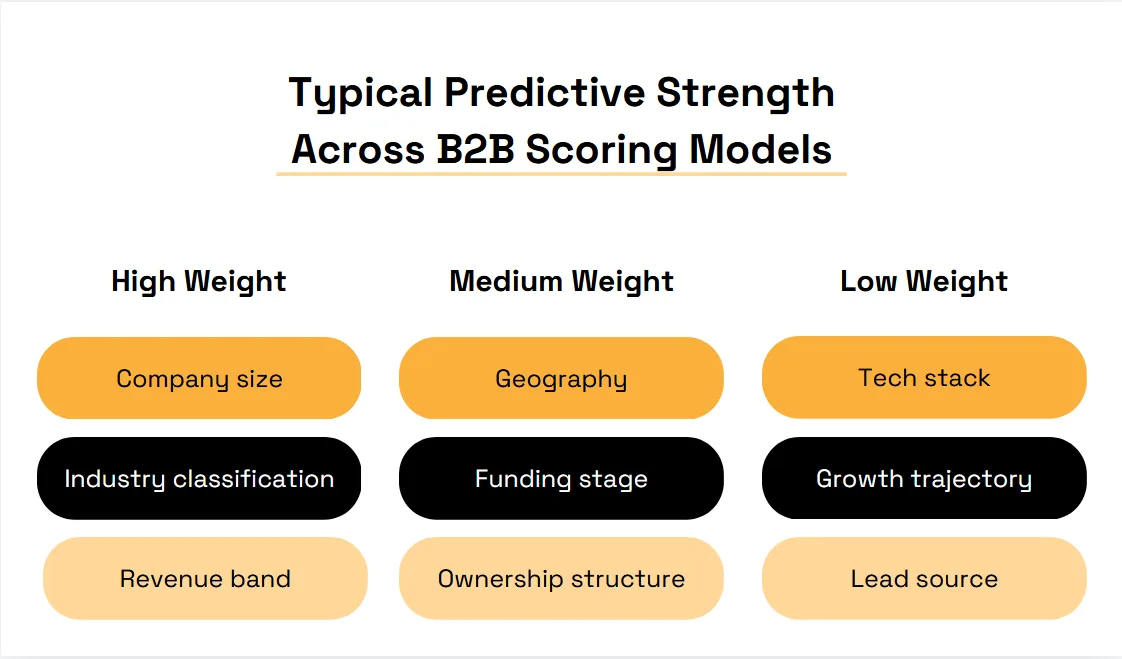
Across most B2B models, a consistent hierarchy emerges. Datalane’s account scoring analysis is direct about it: company size, meaning employee count plus revenue band, is the most predictive attribute in most B2B scoring models.
Below that, frameworks diverge: Datalane places geography and funding stage in the high-weight set, while Salesmotion’s firmographic framework treats geography as medium. Which is itself a reason to test rather than inherit someone else's hierarchy.
Here are three typical weighting classes you could rely on as a baseline:
Source: Veridion
There’s a structural reason for why size reigns as the supreme predictor.
As lead data enrichment company Derrick’s firmographic breakdown explains, headcount correlates directly with budget, organizational complexity, and purchasing process.
A 500-person company has roughly 15x the IT budget of a 50-person company. One attribute proxies for several at once.
Pintel’s guide, however, notes that size shouldn’t be considered everything because it doesn’t exist in a vacuum.
A 200-person professional services firm and a 200-person e-commerce company have almost nothing in common as buyers. Headcount only becomes reliably predictive when paired with industry.
Still, this is a general pattern, not a rule. If, in your case, geography shows real variance in your data, it deserves more weight than convention suggests. If industry comes back flat, it deserves less; adjust as needed.
Step 3: Build and Weight the Scoring Model
So, you’ve got your ranking. Now it needs to become something your CRM can actually use.
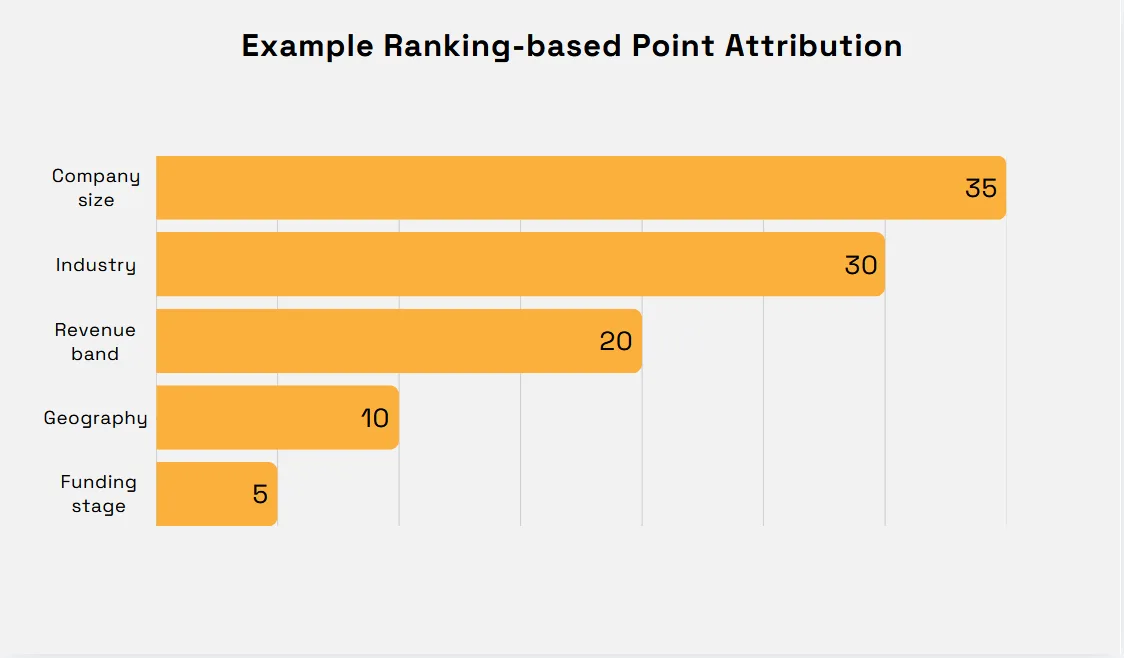
That means turning positions on a list into point values, which is the backbone of how your model will operate.
A 100-point scale is the standard here, mostly because anything finer implies a precision you don’t really have.
Let’s start by explaining the sound principles behind proper weight distribution.
3a. Assign Weights Based on Correlation, Not Intuition
The rule is simple enough: your top-ranked attribute takes the largest share, second-tier attributes take less, and anything that failed the variance test back in Step 2 gets nothing at all.
Source: Veridion
Resist the urge to top up an attribute because it feels like it should matter more. If industry came back flat in your data, it stays flat in your model.
There’s a second consideration here that’s easy to skip past, though: whoever has to act on these scores needs to understand them.
The Pedowitz Group, a management consulting firm, frames the adoption test as two questions a rep should be able to answer without guessing. Why is this lead scored this way? And what should I do next?
If either answer requires a conversation with RevOps, the score won’t get used.
A rep who can see an account scored 80 because it sits in a vertical converting at 3x baseline will work it. One staring at an unexplained number falls back on gut feel, and your model reverts to being an afterthought.
3b. Fix Missing Data Before It Undermines the Model
Now for the part that undoes all of the above if you get it wrong.
Everything so far assumes your CRM actually contains the attributes you’re scoring against. Often, it doesn’t.
The damage isn’t theoretical. A peer-reviewed study in Big Data and Cognitive Computing tested five classification models across six datasets at varying rates of missing data, and found accuracy degrades as missing values climb, with sharper declines when data is missing systematically rather than at random.
That second finding is the one that should worry you.
CRM fields don’t go blank at random. Smaller companies, newer accounts, and records from certain lead sources are systematically thinner than others.
So, your model doesn’t just lose accuracy. It develops a bias against entire categories.
Which is why completeness beats calibration. A precisely weighted model on patchy data will lose to a roughly weighted one on complete data.
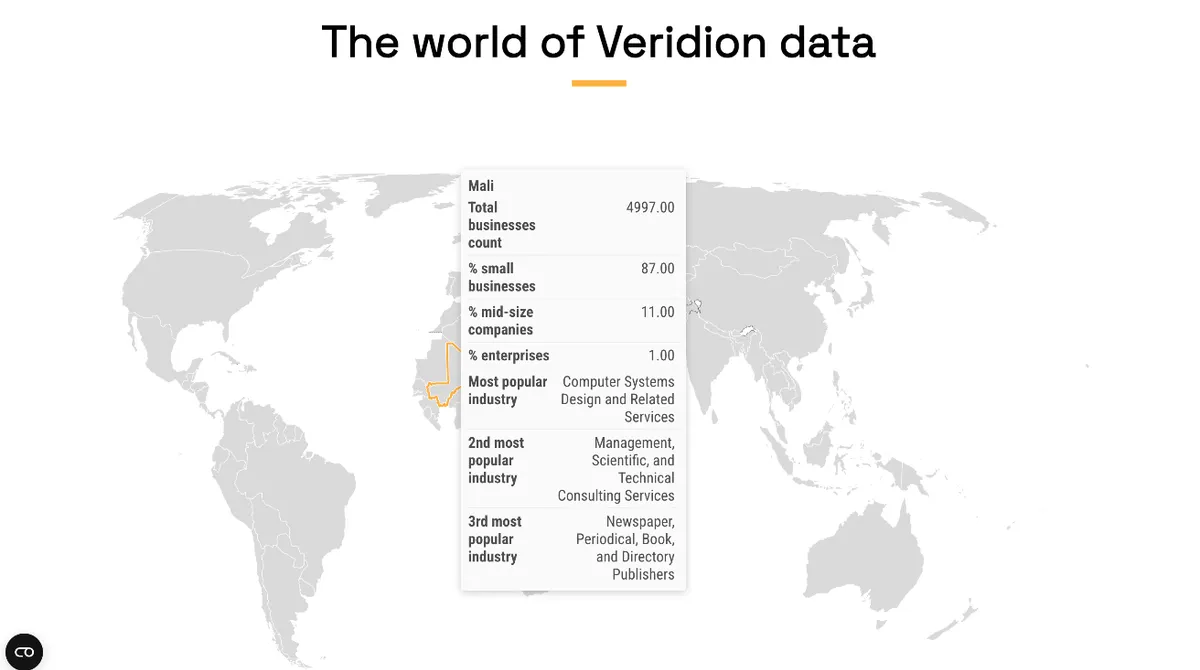
Veridion’s Match & Enrich API handles this at the point of scoring, filling missing attributes – industry, revenue band, company size, geography – from a continuously updated database of companies.
Source: Veridion
Your model then scores against what a company looks like today, rather than what someone typed into a form two years ago.
Step 4: Test, Audit, and Recalibrate
If you calibrate a model one year based on a data set reaching 12 to 24 months back, you can’t expect it to be valid forever.
Your business and your pipeline composition shift naturally moving forward, month by month, and the model will start drifting out of sync, only to reward the wrong signals again.
The scores may keep looking reasonable, but you have to apply vigilance and check it regularly to verify its performance.
4a. Validate Scores Against Real Outcomes
Before rolling the model out fully, run it backwards.
One method to try: pull the last 50 closed-won and closed-lost deals, run them through the newly reconstructed model, and compare average scores.
You want a points gap of at least 20 between the two groups. If they’re too close, your model isn’t predicting but guessing.
If you’d rather validate in production, a split test works too: route 20% of leads using the old model and 80% using the new one for 30 days, then compare marketing-qualified lead (MQL) to sales-qualified lead (SQL) rates between the groups.
For benchmarks, a well-calibrated model should land an MQL-to-SQL conversion rate of 25% to 45%.
However, data isn’t everything, and people can be a much more valuable resource.
When reps quietly stop referencing the score, bypass the queue, or push back on the accounts you flagged as hot, that’s your answer.
It’s worth knowing that when the model fails validation, the model often isn’t the problem.
Malay Gupta, Partner and Head of Operations and Growth at GrowLeads, has reviewed scoring models at more than 30 B2B companies. His most common finding was that the definition of “qualified” was wrong before anyone started weighting anything.
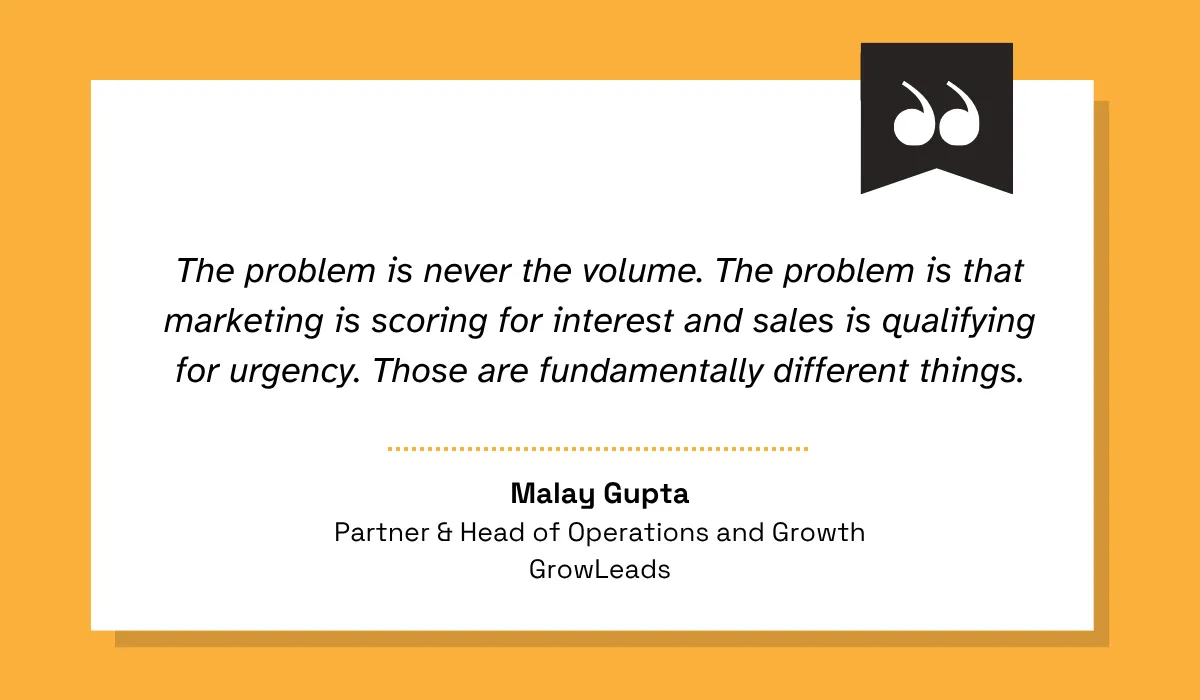
If your validation test comes back flat, it might just be better to investigate there first, rather than going back to your weighting formula.
4b. Re-weight on a Regular Cadence
Set a schedule and hold to it.
Quarterly generally works well, and the reasoning cuts both ways. Leave it longer and the model drifts. Do it monthly and you don’t get enough certainty the model isn’t simply picking up circumstantial noise as real patterns.
The evidence on how fast drift sets in is fairly consistent:
- Roughly 70% of audited B2B scoring models stop correlating with conversion within 12–18 months of implementation.
- Scoring accuracy dropped 18 percentage points between month one and month six across 40 tracked HubSpot instances.
- And drift compounds, too. A model deployed in February can be degrading by April, with nobody noticing until September.
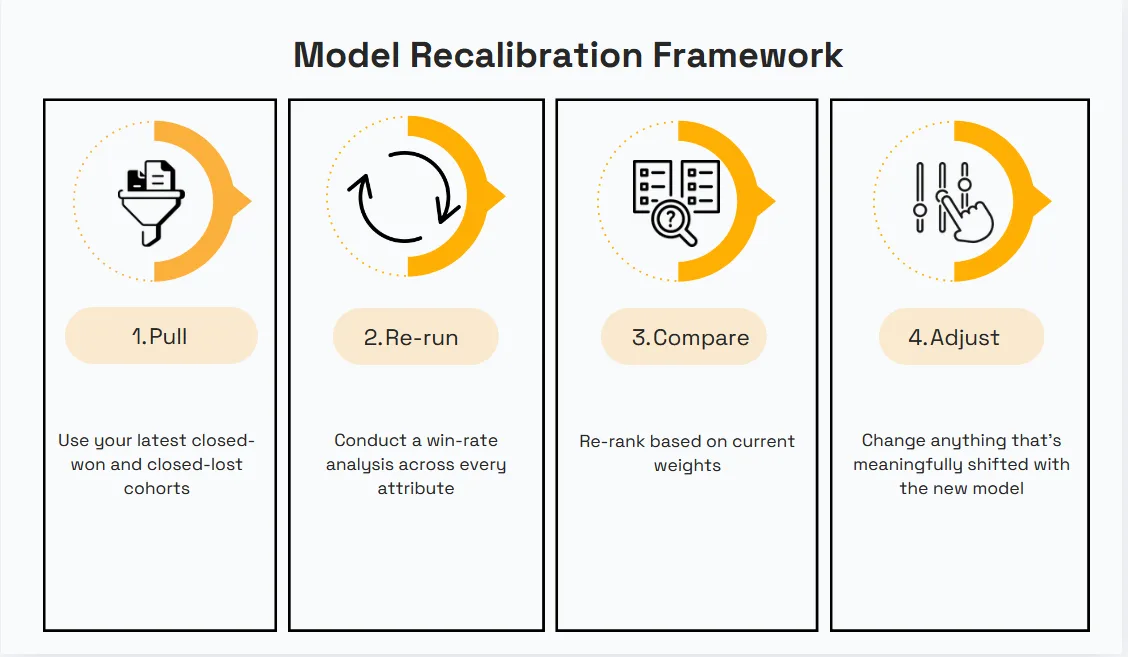
Each recalibration session comes down to four things:
Source: Veridion
One refinement worth adopting: Breadcrumbs suggests recalibrating on rejection signal, not just the calendar.
Sometimes, a sudden jump in sales rejection rate coming seemingly out of nowhere should take priority over a review process that’s two weeks out.
Conclusion
The difference between a scoring model that works and one that just produces numbers comes down to a single habit: checking your assumptions against what actually happened.
Pull the real deals, wins, and losses both. Test attributes against your baseline instead of going by feel. Weight by what the data showed. Fix the gaps in your CRM before you deploy.
Then, keep checking, because your business doesn’t stay static, and neither should your model.
The trick is in the simplicity. It all seems obvious, almost banal – and therein lies the temptation to skip or delay.
Resist it, and your model’s accuracy will shoot back up.
Articles
Discuss how these trends affect your organization.
Our analysts are available for a short call. Bring a specific question and we will ground it in the data.
Insights
Keep reading
More analysis, research, and outcomes grounded in live company intelligence.
Best Practices for Data Enrichment
Learn how data enrichment best practices help businesses turn raw data into accurate and actionable insights.
Looking for a Global Data Collection Partner? These Companies are Worth Considering
Looking for a global data collection partner? This guide will introduce companies worth considering and explain what sets them apart.
Which Online Business Data Providers Stand Out in Today's Market?
This article will highlight online business data providers that businesses trust for accurate company information and actionable insights.