Insights / Articles
6 Common Mistakes When Using Alternative Data for Credit Scoring
Six ways alternative data for credit scoring goes wrong, from stale observation dates and wrong entity matches to undocumented source provenance.

- A credit file can keep reporting a borrower as current long after their finances have turned, while data teams remain none the wiser.
- The industry’s standard test for whether a signal is stable relies on cut-off numbers that nobody can trace to a source.
- Data attached to the wrong company does more damage than data that is simply missing, because the error is invisible.
Alternative data is any information about a borrower that does not come from a credit bureau.
Lenders use it because a bureau file only covers people and companies with a borrowing history. But there are plenty of viable yet thin-file borrowers. Alternative data at least gives you something to assess.
The trade-off is that this data was collected for entirely different reasons. It was never built to support a lending decision, so the handling has to be tighter.
The failures happen after that decision, in how the data gets matched, weighted, refreshed, and documented. Here are the six that surface most often.
1. Using Data That Was Not Valid at the Decision Date
A credit bureau file accumulates over years, which means a record you pulled last quarter still describes roughly the same borrower today.
With a file like that, the latest available value and the borrower’s current position are close enough to treat as the same thing. Decades of credit practice were built on that assumption.
Cash-flow data offers no such stability.
The latest figure you hold may be six months old and describe a business that has since lost its main customer, and nothing about it looks any different from one pulled last week.
Bureau file | Cash-flow data | |
|---|---|---|
Changes | Over years | Within weeks |
Last value still true? | Usually | Often not |
Looks stale? | No | No |
The pandemic demonstrated how far a slow-moving source can drift from what is actually happening.
Under the Coronavirus Aid, Relief, and Economic Security (CARES) Act, lenders had to keep reporting accommodated accounts as current, and federal student loans under the repayment pause were furnished as current. The CFPB found that the whole distribution of credit scores shifted upward as a result.
Michal Kowalik, Lily Liu, and Xiyu Wang put a number on what effect the Act had in a Boston Fed working paper. In 2019, a household that stopped paying its mortgage lost around 13.7 points from its score compared to a loss of 0.9 in 2020.
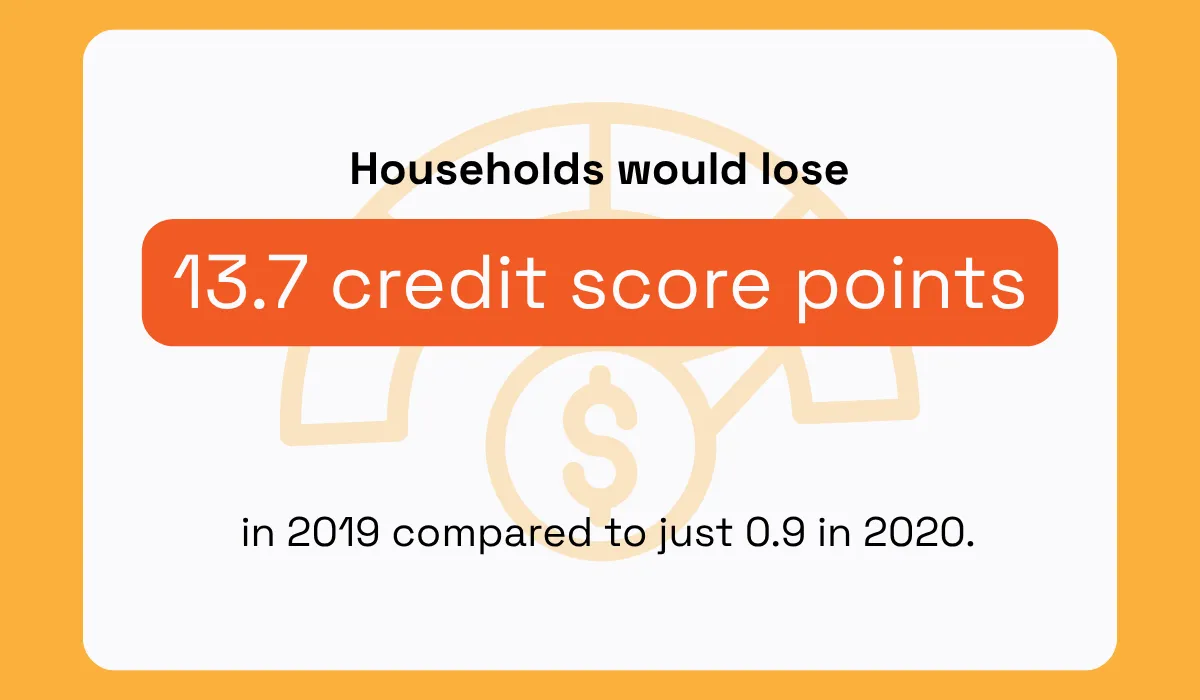
Illustration: Veridion / Source: Boston Fed
As the authors put it, the absence of a penalty for missed payments lowers the informativeness of the score as a measure of creditworthiness.
The same thing happens in your pipeline, without an Act of Congress behind it. A feed stops refreshing, the value remains, and the borrower moves on without it.
What tells the two apart is a date. The observation date is when the value was true, and the ingestion date is when it reached your warehouse. Only the first says anything about the borrower.
Date | What it records |
|---|---|
Observation date | When the value was true |
Ingestion date | When the value reached your system |
Regulators point the same way.
Guidance SR 26-2, issued by the Federal Reserve, the Office of the Comptroller of the Currency (OCC) and the Federal Deposit Insurance Corporation (FDIC) in April 2026, means that sooner or later, you’ll be met with a validator asking what your model knew, and when it knew it.
To fix and prevent this, you don’t have to do much. Simply record when you observed each value and, when you score a borrower, build the features from what you actually knew on that date.
After that, you stop assuming your data is current because that becomes outwardly visible.
2. Over-Weighting Signals That Aren’t Actually Stable
History is the only evidence you have when setting weights, so a variable that tracked repayment closely across your development sample looks like a strong candidate for a heavy weight.
The problem is that a signal can line up well historically and still jump around from one month to the next for reasons that have nothing to do with whether anyone can pay.
Lean on a signal like that and the model does not get better at predicting repayment. It just follows the jumping.
Naeem Siddiqi, senior advisor in the Risk Research and Quantitative division at SAS, described exactly this to fintech news outlet bobsguide. He notes that following financial outlets like the Wall Street Journal or the Financial Times on social media increases scores and correlates them to social status.
While the logic is sound, it’s also easily exploitable by bad actors:

Weight a variable like that heavily and the score starts moving with the swings rather than with anyone’s ability to pay.
That is why stability needs its own test, run before assigning any weight.
The standard instrument for this test is the Population Stability Index (PSI), in use since the early 2000s and built into most scorecard tooling.
It works by binning a variable, then comparing how your population sits across those bins now against how it sat when the scorecard was built.
Convention reads a PSI under 0.10 as stable, 0.10 to 0.25 as moderate movement, and anything above 0.25 as a sign the scorecard may need rebuilding or recalibrating.
Those bands are useful, and they are also softer than they look. Potgieter, van Zyl, Schutte, and Lombard note in their 2023 paper that "the origins and properties of the PSI are not well documented", and that the same fixed cut-offs get applied whatever the size of the sample.
On a small sample, the number crosses 0.25 easily, while on a large sample, real movement can sit under the threshold and never trigger anything.
So treat the number as a reason to look, not a definitive answer.
3. Using Unverified Entity Matches
When a value is missing, it shows up in your coverage report, so someone raises a ticket, and the model treats the field as absent rather than guessing.
A wrong match produces none of that, and wrong-entity risk is something to watch out for precisely because, on the surface, it looks exactly the same as good data.
Thus, a subsidiary’s late payments get read as its parent’s, and the borrower is scored down for behavior that belongs to a legally separate entity
The risk climbs when a source matches on company name alone. Names aren’t strictly rule-bound; they vary by legal suffix, by transliteration, by jurisdiction, and two unrelated firms can quite legitimately share the same name.
Which is why records should be resolved to structured company profiles before data enrichment rather than after.
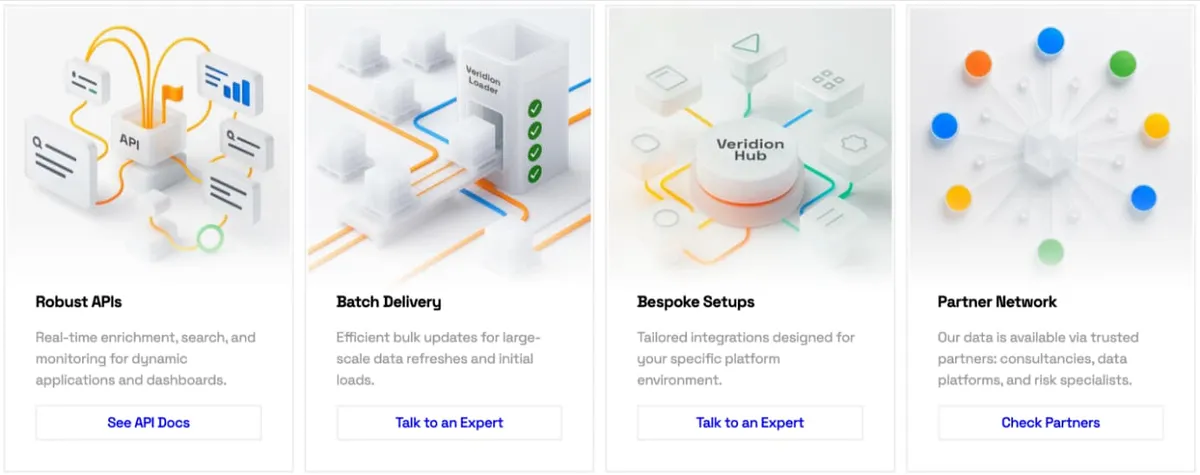
Veridion returns canonical identifiers with match confidence and resolution lineage attached. You can use our data to validate match quality against your own population and set thresholds that suit it.
Source: Veridion
That sequence matters more with alternative data, which arrives from many sources at once that rarely agree on format.
AI-powered risk management platform RiskInMind notes in their guide to alternative data underwriting that vendors seldom share a common schema, so teams write custom matching logic for every feed.
Each of those is a place where a name gets used instead of an identifier, and a wrong match enters the model disguised as the right one.
4. Treating an Operational Proxy as Direct Financial Evidence
Overinterpreting circumstantial evidence can quickly lead your scoring models astray.
Someone who has paid their utility bill on time for two years is probably good for a loan.
By itself, it’s a reasonable inference to draw, but it remains an inference. A proven repayment record, by comparison, is strong evidence the borrower had money and chose to send it.
As no-code decisioning platform Decisimo puts it, alternative signals can correlate with default without any causal link at all, and some of those effects turn out to be seasonal or specific to one context rather than genuine repayment behavior.
Their advice is to hold alternative attributes to the same standard or higher as traditional ones, on five counts:
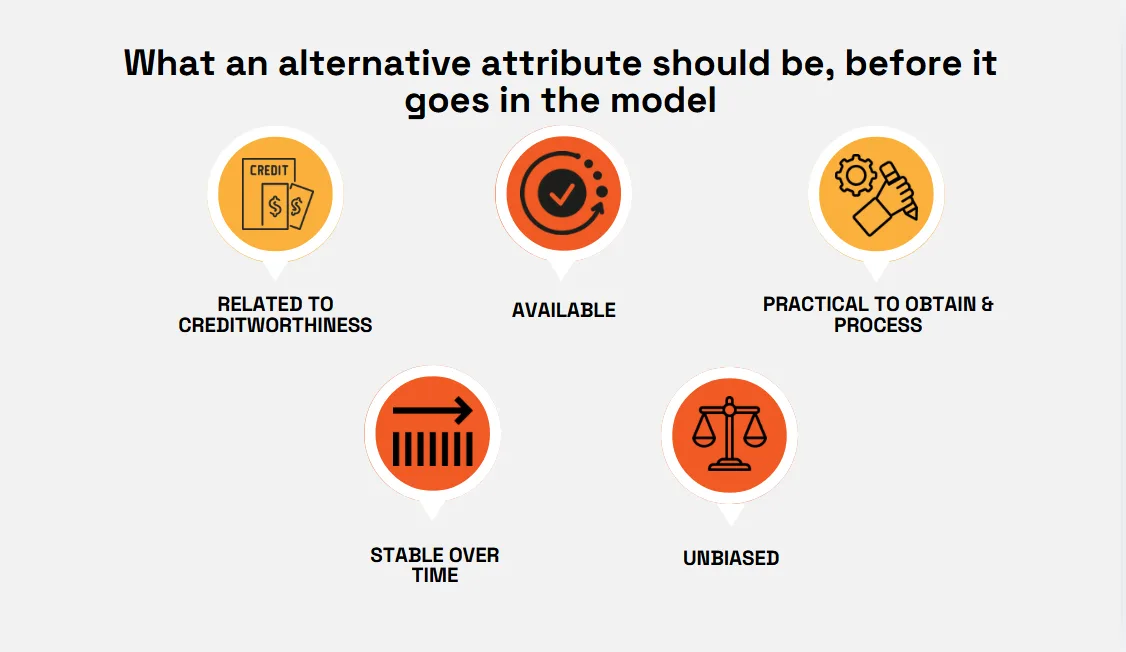
Four of those you can check before you build. Stability is the hard one, because a backtest only measures whether the association existed, not why. You find out in production, once the driver moves and losses land on accounts the model scored as safe.
Worse, some proxies encode something you are forbidden to use. A paper written by researcher Chris Lam describes how certain alternative variables have historically been excluded from underwriting precisely because they can act as an illegal proxy for a protected class such as race or gender, producing redlining.
One such variable is zip code, and it affects creditworthiness in two ways.
One is legitimate, since a borrower’s area of residence does correlate with financial status. The other runs through race.
For various historical and cultural reasons, race is a significant factor in where people live and, by extension, their access to credit. Part of the correlation between zip code and repayment is really race showing up under a different category.
Lam calls that second route an illegal path, and the difficulty is that a classifier cannot tell the two apart. It sees one correlation and uses it all.
Which is why leaving race out of your inputs isn’t enough. Lenders do that already, but a formally neutral variable can produce disparate outcomes accidentally that place you in a category of scrutiny for violating the law.
5. Running Inconsistent Refresh Cadences Across Datasets
Say your transaction feed updates weekly and your registry data updates quarterly. Both land in the same record.
The model reads that record as one borrower, described at one moment in time. In reality, half of it is a week old and half could be three months old.
Nothing says which half is which, so the score treats every input as equally current.
The reason this happens is that refresh schedules usually get set by whatever review cycle already exists. Quarterly reviews are that way because quarters are, not because anything about the borrower moves on that rhythm.
Returning to RiskInMind’s guide from earlier, they argue for the opposite approach: let each source’s refresh frequency follow how fast the underlying thing actually changes.
Cash-flow patterns are dynamic, and can shift greatly within mere weeks. Registry filings sit still for years. When you operate on just one across both, you will inevitably introduce drift and end up with mismatches.
Bank supervisors take the same view, and they have for over a decade. Timeliness is one of the principles in BCBS 239, the Basel standard on risk data aggregation, and the Committee’s 2023 progress report found just two of thirty-one global systemically important banks were fully compliant across all the principles.
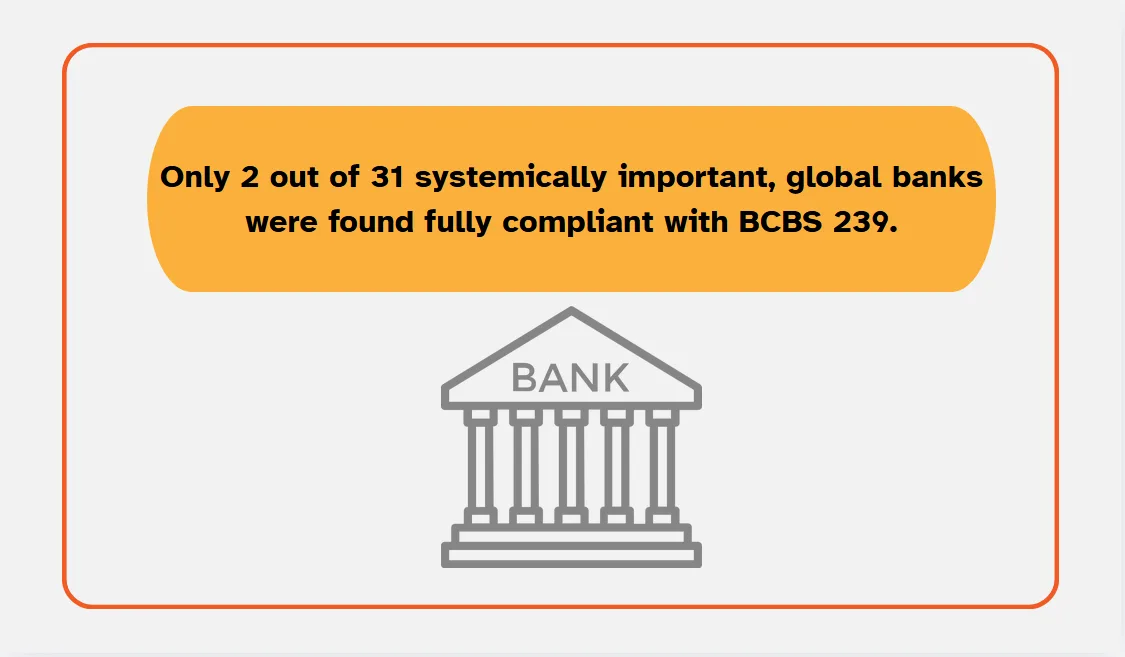
Illustration: Veridion / Source: Basel Committee on Banking Supervision
If your sources are already combined, the fastest way to see the spread is to check what each one promised against what it delivers. Vendors state a refresh interval in the contract, and your ingestion logs will tell you the interval you actually get.
From there, correcting it means applying the observation date from the first mistake to every source. Give each one a maximum age it is allowed to reach, and have the pipeline flag any feed that goes past it.
6. Failing to Document Source Provenance
Every one of the five mistakes above becomes indefensible at the same moment: when someone asks where a number came from and nobody can say.
Without that record, you cannot tell whether a feed’s coverage explains a model performing worse on part of your book, whether a source’s license permits the use you are putting it to, or whether a value that looks wrong is wrong or just old.
The Basel Committee put it plainly in a January 2026 newsletter: data lineage, meaning the traceability of data from origin to final use, is what lets a bank confirm data quality at all. They also note it remains one of the harder parts of BCBS 239 to implement, held up by legacy systems and the cost of maintaining traceability.
Which is why the record gets written per feed, before any data enrichment or feature building begins. Each one should denote:
- Where it came from: The actual originating source, not the vendor who resold it to you.
- How it was collected: Scraped, submitted, filed, purchased, inferred.
- How often it updates: The contracted interval and the one you observe.
- What it does not cover: Which countries, company sizes, or segments are thin or missing.
- What lets you use it: Consent, license, or lawful basis, and any restriction attached.
Write it while you are still choosing a source and the license and coverage questions get answered while you can still say no.
Leave it, and the record gets assembled under audit, from memory, about decisions already in production. Not a good look.
Despite that, most teams decide not to bother. When technical publisher O’Reilly surveyed more than 1,900 people working in data across industries, only around a fifth said their organization publishes data provenance and lineage, and most of the rest had no plans to start.
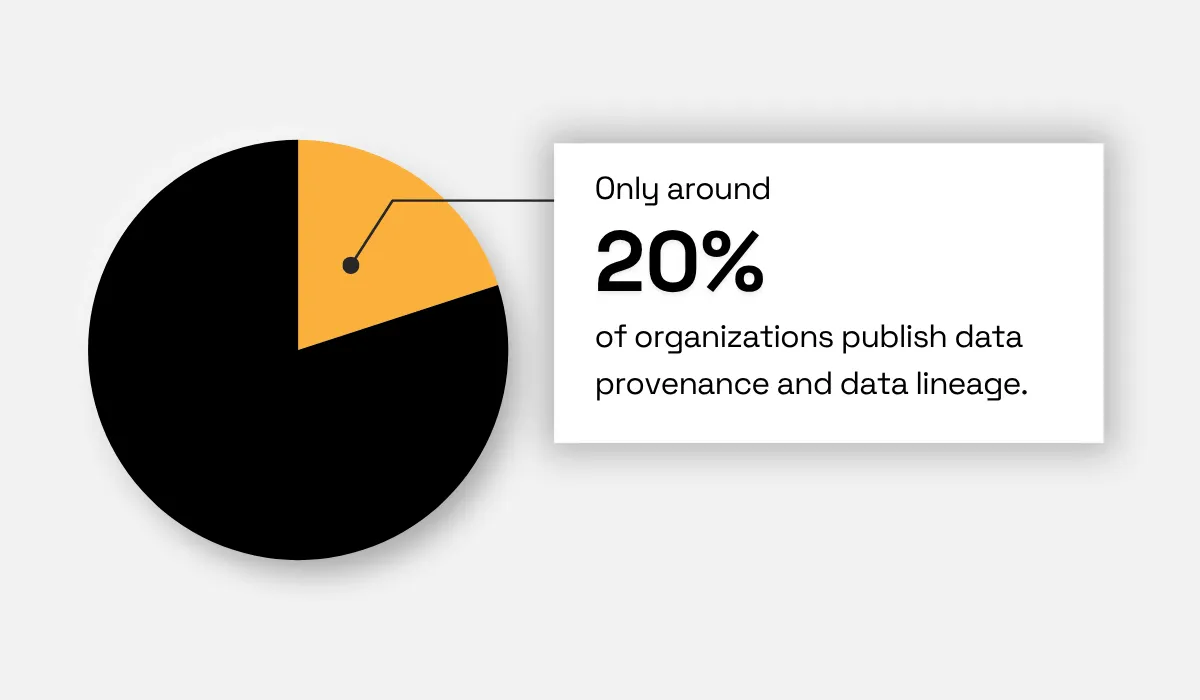
Illustration: Veridion / Data: O’Reilly Media
The most expensive version of “where did this come from” is the one a regulator asks.
A 2022 circular from the Consumer Financial Protection Bureau states that creditors may not use complex algorithms when doing so leaves them unable to give specific and accurate reasons for a decision.
A reason you cannot trace to a source is not a reason you can send. Fix the provenance record, and the other five problems become questions with provable answers.
Conclusion
None of these six mistakes call the functionality of alternative data into question – it certainly does work.
Instead, what they highlight is the discipline that should surround its use: knowing when each value was true, testing whether a signal holds still, confirming it belongs to the right company, keeping proxies in their place, matching refresh to volatility, and writing down where everything came from.
It’s not very glamorous, but entirely learnable.
None of it makes alternative data safe, and that was never the goal. It makes the failures visible while you can still do something about them. That is the difference between a model you can defend and one you are explaining after the fact.
Articles
Discuss how these trends affect your organization.
Our analysts are available for a short call. Bring a specific question and we will ground it in the data.
Insights
Keep reading
More analysis, research, and outcomes grounded in live company intelligence.
What Are the Benefits of Data Enrichment?
Want to understand the benefits of data enrichment? This guide will explain how enriched data supports better decisions and analytics.
Best Practices for Data Enrichment
Learn how data enrichment best practices help businesses turn raw data into accurate and actionable insights.
9 Essential Sources of Market Intelligence
Want to boost your market knowledge? These 9 market intelligence sources will show you where to look and how to apply the insights.