Insights / Articles
How to Use Firmographic Data to Build ABM Account Lists That Convert
Struggling to build effective ABM account lists? Discover how to leverage firmographic data providers to pinpoint high-converting prospects.

- Retention and expansion reveal your real best customers, not deal size.
- A firmographic match with no growth signal, no hiring surge, and no funding event is weaker than a looser fit that's actively moving.
- An ICP is only valid if most of your recent closed-won deals actually match it.
- An ABM target list only works if it matches your team's actual capacity to personalize.
A long account list does not make an effective Account-Based Marketing (ABM) program. A focused one does.
The challenge is deciding which companies deserve your team's time. Firmographic data gives you a repeatable way to decide.
You can use patterns from your best customers to define your ideal customer profile, find similar companies, rank them by potential, and match your investment to each account.
This guide shows you how to turn firmographic data into an account list that actually converts.
1. Define ICP Firmographic Criteria From Won Deals
An ideal customer profile isn't something you just write down. It's a set of patterns you dig from accounts that acquired, retained, and expanded with your product.
Teams skipping this step chase prospects that look good on paper but never close.
The point is to spot which firmographic combinations lead to customers that generate sustainable economic value.
Teams skipping this step chase prospects that look good on paper but never become customers.
Start by exporting your last 12–24 months of closed-won deals from your CRM. If your sales volume is low or your business has long deal cycles, extend the window to 18–24 months.
Then look for characteristics that repeat across successful customers such as industry, employee count, revenue band, growth stage, headquarters location, deal size, sales cycle length, and how well each account retained and expanded after signing.
These data points matter less on their own than combined. A company with a short sales cycle and high churn looks very different from one with a long cycle and high expansion.
The point is to spot which firmographic combinations lead to customers that generate sustainable economic value.
Here is the important part: do not rank customers on initial contract value alone.
A large account can close a major contract and still be a poor ideal customer profile (ICP) reference if it requires excessive support, never expands, or churns quickly.
Assign higher weights to accounts with a high renewal rate, expansion, fast payback period, and efficient sales cycle.
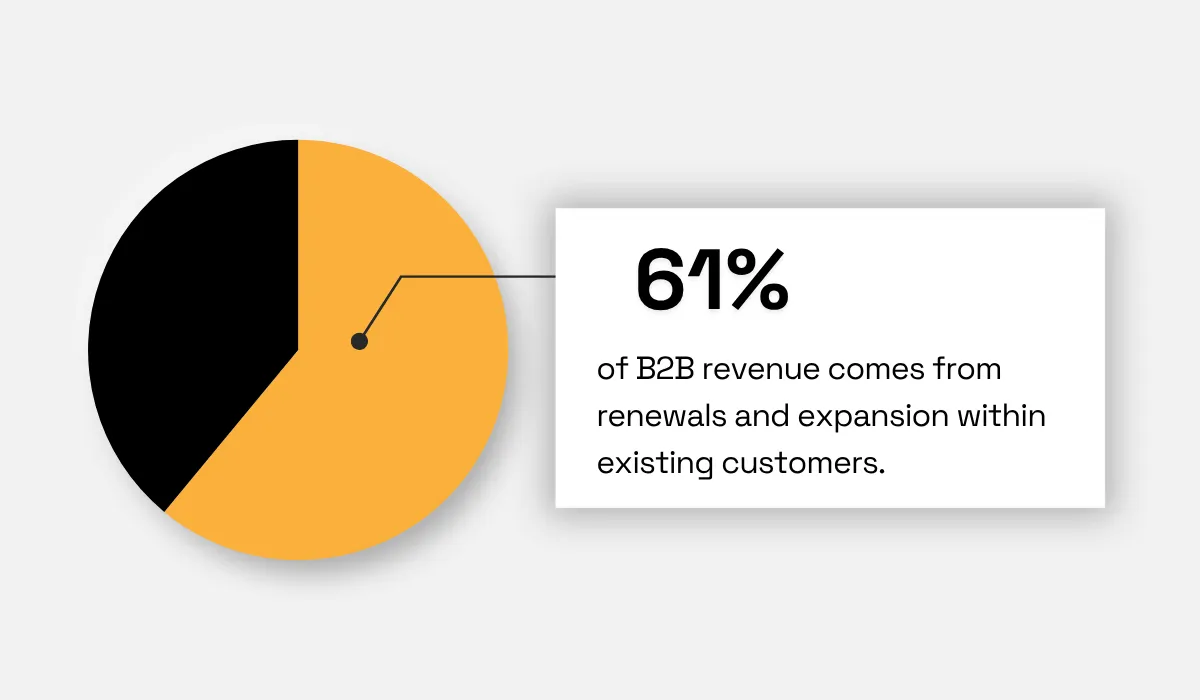
This approach is crucial in B2B, where existing customers make up a significant share of total revenue. According to research and advisory firm Forrester, renewals and expansion from existing customers account for 61% of B2B revenue.
Therefore, start by defining your best accounts. You might define each account by retention rate, expansion revenue, sales cycle length, contract value, and gross margin, then compare their firmographics.
Once you have a draft ICP, sanity check its accuracy. Pull your last 50 to 100 closed-won accounts and check what share actually matches the criteria you just wrote down.
UnboundB2B, a lead marketing agency, suggests treating a match rate below 60% across the previous 12 months of closed-won accounts as a warning that the stated ICP does not reflect actual buying patterns and is built on assumptions rather than evidence.
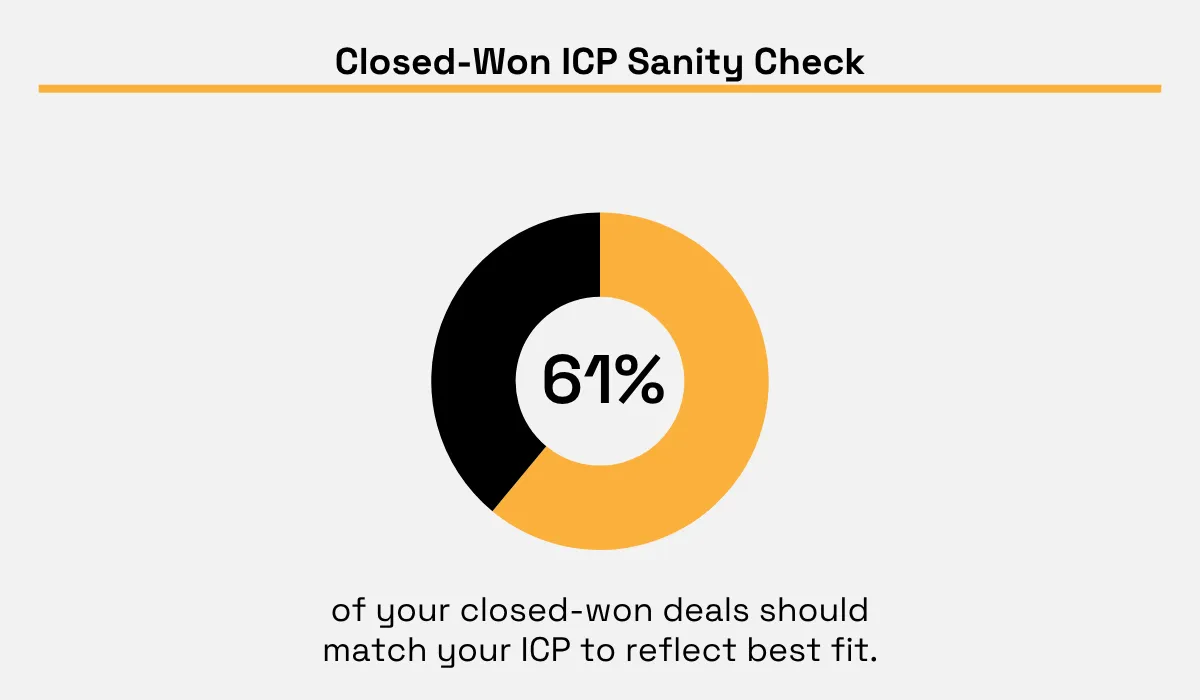
Illustration: Veridion / Data: UnboundB2B
When your match rate is low, be careful about adding new criteria. Wait until every customer fits. Your ICP should describe the repeatable center of your market, not explain every exception.
Instead, inspect the outliers. You may discover that you serve two distinct ICPs, that your market has shifted, or that one high-value segment deserves its own ABM motion.
Run the same exercise for lost accounts. To get sharp exclusion criteria, exclude losses driven by price and timing issues, then compare the result with the pattern from closed-won accounts.
Capture the result in one document and update it quarterly. Win-loss patterns change as your product evolves and your competitors change theirs, so your ICP from a two-year-old analysis is already out of date.
2. Search for Companies That Match the ICP
With an evidence-based ICP in place, it's time to transform it into search logic.
In other words, you move from the question "Which companies belong to our target industry?" to "Which companies share the characteristics common to our best customers?"
That difference matters.
A broad category such as "software companies in the United States" can produce thousands of accounts with very different business models, sizes, customers, buying processes, and commercial potential.
Filtering the same list based on the firmographic filter pattern extracted in step one (industry, size band, growth stage, geographic location, and relevant keywords) would return a smaller list with much higher average fit.
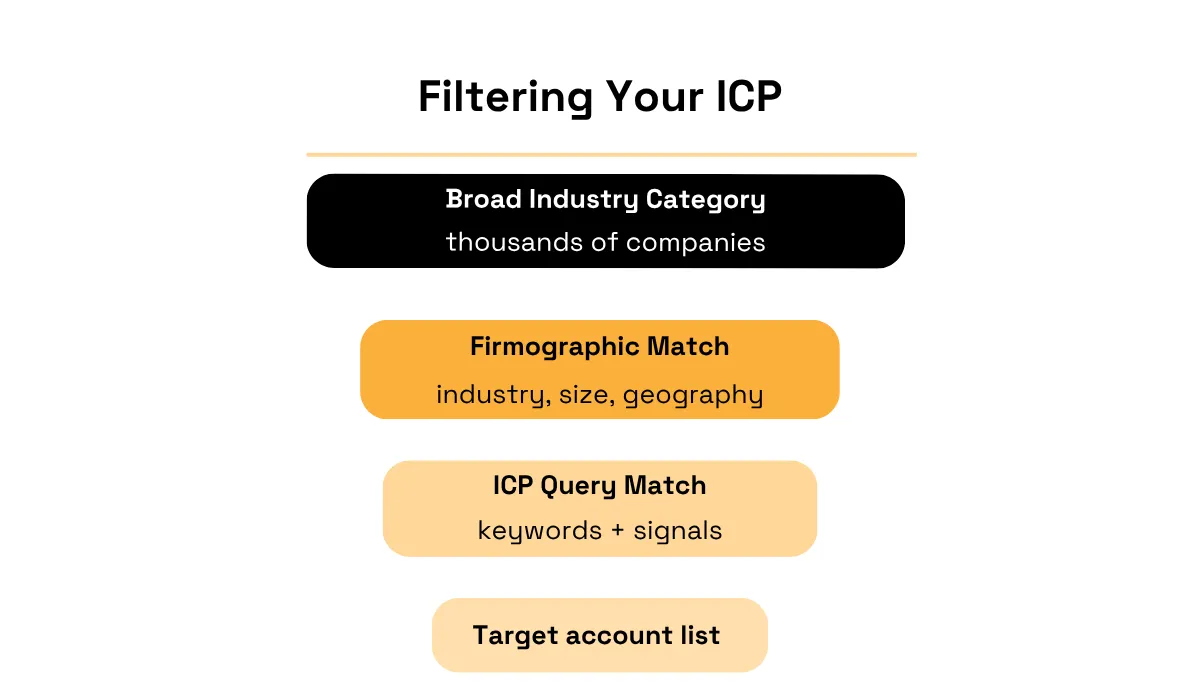
Illustration: Veridion
Every ABM team must balance casting a broad net with narrowing down. Broadening increases volume but reduces fit and wastes sales development rep (SDR) time on irrelevant matches. Narrowing improves fit but reduces volume.
Most teams draw the line based on how much personalization capacity they have downstream, which matters more in the tiering stage (discussed in the next section).
Product and service keywords are particularly useful here. Industry codes can place two companies in the same classification even when they solve different problems or sell to different buyers.
Keyword and business activity data can help you isolate companies whose actual offerings resemble your successful customer cluster.
For example, imagine your historical analysis shows strong performance with temperature-controlled logistics providers serving pharmaceutical companies. Searching only for "transportation and warehousing" will capture many irrelevant businesses.
Adding terms such as "cold chain", "pharmaceutical logistics", or "temperature-controlled storage" can make the account universe more relevant.
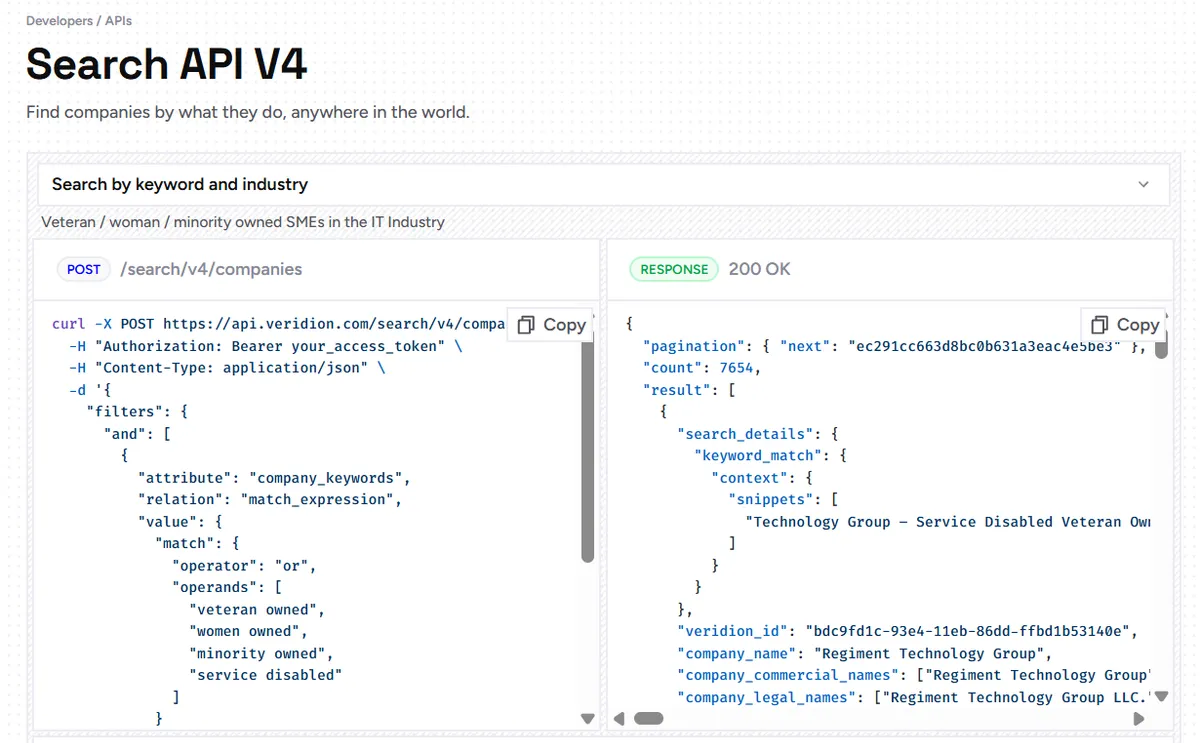
This is where a purpose-built search tool replaces a manual research spreadsheet. Veridion's Search API lets teams combine company keywords and industry criteria with Boolean logic, alongside firmographic, size, geography, ownership, and other filters.
Source: Veridion
The platform displays keyword expressions with OR in the context of the AND query, so you can capture several versions of the appropriate product description along with your core ICP conditions.
Apply the search logic to your defined ICP, not to a generic category. Layer keyword filters on top of firmographic filters to capture companies with the right pattern beyond the usual industry code.
Outdated names, duplicated accounts, incomplete domains, and subsidiaries may inflate your target list. Use entity resolution and an enrichment pipeline to reconcile disjointed company records before scoring and routing them.
The Match and Enrich API, for example, can resolve partial company identifiers to a canonical entity and return match confidence details.
Once you're done with your search, export the result set with the evidence attached, so sales can see why each account made the cut before the first email goes out.
The objective of this second step is simple: finish this stage with a defensible account universe. The reason each company is there is because it matches criteria derived from successful customers.
3. Tier Accounts Based on Fit and Buying Potential
Having a list of qualified accounts does not mean you're running an ABM program. Applying the same amount of effort to each of them without taking into account the fit strength or buying signals will not allow you to convert any of them.
Tiering helps by balancing resource intensity with the likelihood of conversion. An effective three-tiered approach differentiates between firmographic fit and buying signals.
Tier 1 | Tier 2 | Tier 3 |
|---|---|---|
A small number of accounts, 10 and 50 | A larger group, roughly 50 to 200 accounts | Broadest group, 200+ accounts |
Near-perfect firmographic match | Match your core firmographic criteria well | Companies adjacent to your ICP with lower confidence in near-term fit |
Active growth | No growth signals | No growth signals |
Strong intent signals | Low intent signals | Insufficient evidence for a larger investment |
A match on firmographics does not grant a company Tier 1 status. A company that matches all filters but shows no growth, funding events, or expansion activity is a less promising prospect than a slightly wider hit with clear growth signals.
Layering a growth or intent signal on top of the firmographic match, before assigning a tier, is what separates a genuinely hot account from one that just happens to score well on paper.
The stakes for getting this right have gone up. According to Gartner, a US research firm, B2B buying groups now run five to sixteen people across as many as four functions.
A Tier 1 account isn't one contact to win over. It's a committee, and under-resourcing that committee with Tier 3-level attention wastes the fit work already done in the first two steps.
One widely used ABM resourcing framework allocates roughly 70% of resources to Tier 1, 20% to Tier 2, and 10% to Tier 3, reflecting how much more expensive true one-to-one treatment is per account.
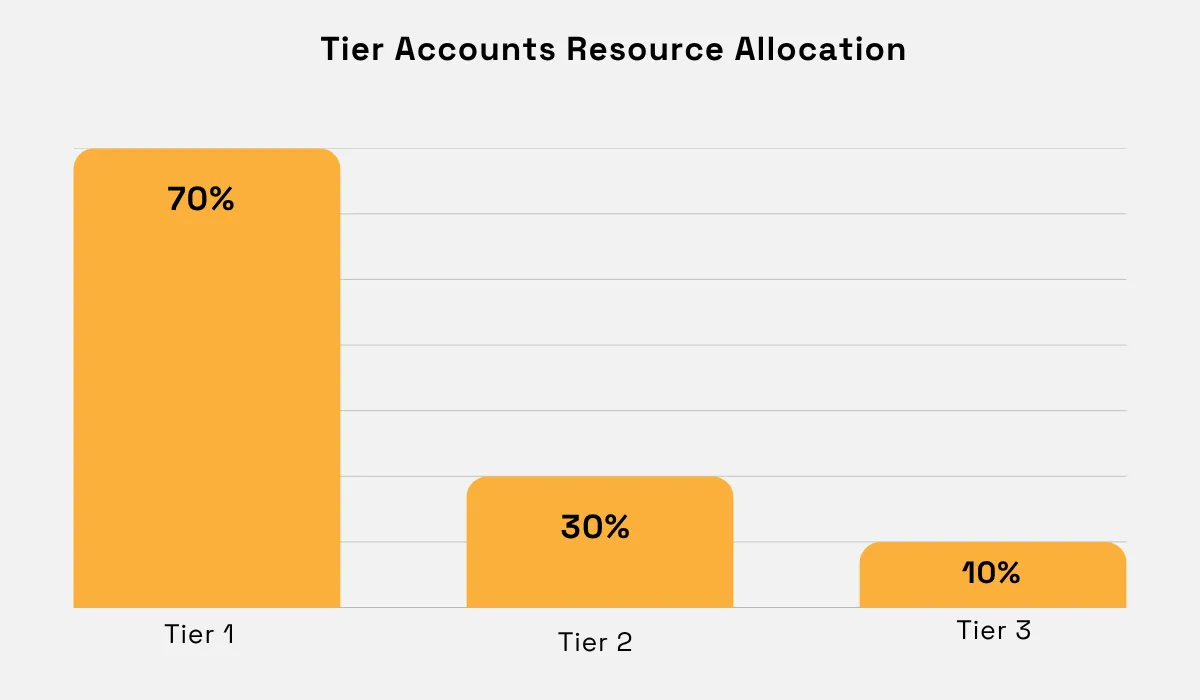
This resource allocation is just a guide. Your annual contract value (ACV), sales cycle, team size, buying group complexity, and expansion strategy should determine the final split.
The structure only works if it's paired with account counts your team can actually service. A target account list too large for the team's capacity gets the same shallow treatment as no targeting at all, since nobody can personalize hundreds of accounts at once.
Evaluate the firmographic fit first, basing the score on the filters selected in step one. Add growth and intent signals on top of that before assigning Tier 1 status.
Size each tier to what your team can genuinely research and personalize rather than to how ambitious the number looks in a planning deck.
Revisit tier assignments regularly, because even though firmographic criteria doesn't change quarterly, growth signals often do.
4. Personalize Messaging by Tier
You may have done a superb job tiering your accounts, but your effort will only pay off if outreach actually changes by tier.
Sending the same email sequence to a Tier 1 strategic account and a Tier 3 programmatic one wastes the targeting work from the previous three steps and signals to your best-fit accounts that you never treated them as priorities.
Additionally, spending Tier 1-level effort on Tier 3 accounts burns the budget before the highest-value accounts get their share. Using Tier 3-level messaging on Tier 1 accounts wastes the targeting work done in the first two steps.
Each tier should change how much research, customization, human attention, and budget an account receives.
Tier 1 personalization is built account by account. This typically includes custom landing pages, executive-to-executive outreach, account-specific research woven into the pitch, and content that references the company by name and situation rather than by category.
That level of investment aligns with established ABM practice. ABM marketing company Momentum ITSMA found in a benchmark study that account-specific bespoke content, dedicated microsites, executive relationship programs, paid social, and small executive events were among the five most effective tactics reported for one-to-one ABM.
Tier 2 focuses on cluster-based personalization, where you give companies in the same industry or in a similar situation a tailored approach to their shared context.
You might group mid-market banks expanding digital services, industrial manufacturers entering new regions, or logistics providers adding cold storage capacity. Then create a message that addresses that shared situation while still inserting account-specific proof where it matters.
The Momentum ITSMA's benchmark study ranks paid social, dedicated microsites, SDR outreach, display advertising, and email among the most effective tactics for this one-to-few ABM.
Tier 3 relies on dynamic, segment-based personalization delivered through automation, where messaging adapts by industry, region, or company size without any manual work per account.
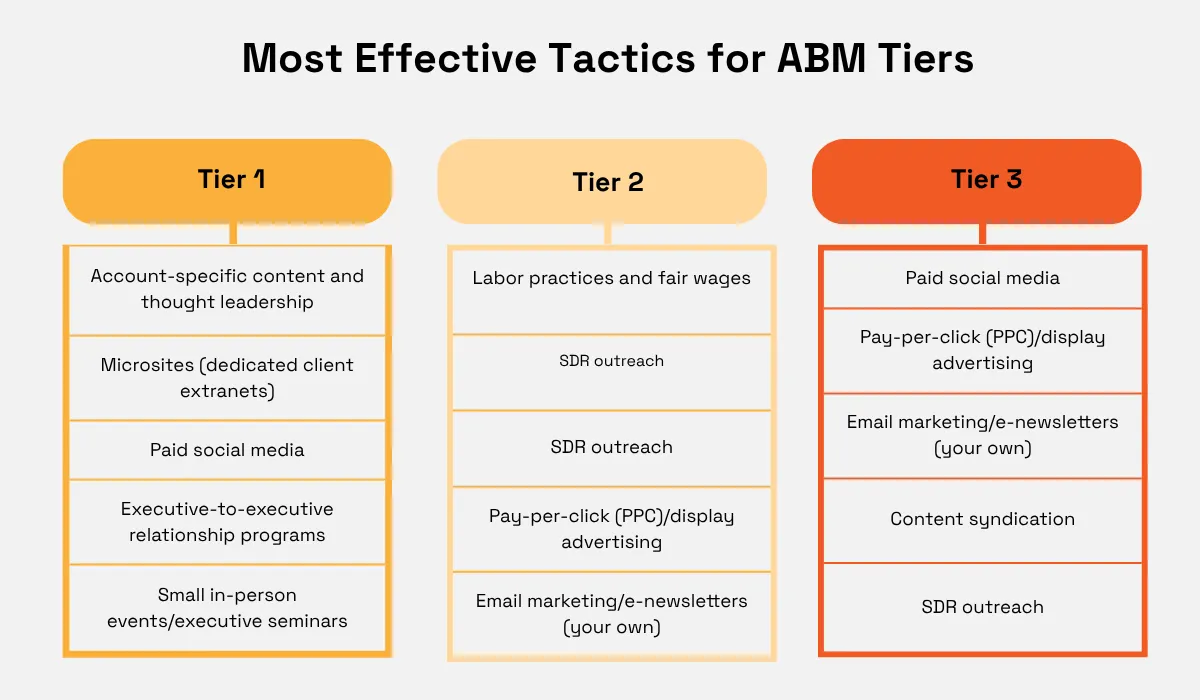
Illustration: Veridion / Data: Momentum ITSMA
Firmographic data, not just the company name, can shape your message angle in several practical ways.
Company size signals operational maturity. A 50-person company is likely still building a process from scratch, while a 2,000-person company is optimizing one that already exists, and the pitch should sound different for each.
Industry shapes the specific pain point and determines which workflows, regulations, metrics, or examples deserve emphasis.
A compliance-heavy vertical reads a message about risk very differently than a logistics company reads a message about routing efficiency, even when both companies sit in the same revenue band.
Ownership structure can change the likely approval environment, and products and services can tell you which use case is most credible.
Tiers also should not be permanent. Firmographic characteristics can change. Companies expand into new markets, acquire subsidiaries, change ownership, increase headcount, launch products, and open locations.
Operational signals may change even faster. Current technology supports different cadences for firmographics and event-based attribute updates. This lets teams reassess account fit based on major changes rather than rebuilding the list every year.
Static lists are blind to operational changes, so you need to develop and enforce rules for moving accounts between the tiers.
Think of your target account list as a dynamic prioritization system instead of a fixed document.
Conclusion
An ICP based on real closed-won firmographic data turns into a reliable ABM list once you translate it into concrete criteria.
Tier that list by fit and signal, then match personalization to each tier, and now you get an ABM program that converts accounts instead of just filling a spreadsheet.
Start with the data you already have, and let it tell you who to target next.
Articles
Discuss how these trends affect your organization.
Our analysts are available for a short call. Bring a specific question and we will ground it in the data.
Insights
Keep reading
More analysis, research, and outcomes grounded in live company intelligence.
Is Your Firmographic Data GDPR-Compliant? A Checklist for B2B Data Buyers in Europe
Are you sure your firmographic data providers are GDPR-compliant? Get our essential checklist for B2B data buyers in Europe.
How to Build a Firmographic Lead Scoring Model That Actually Predicts Revenue
Looking to build a firmographic lead scoring model? This guide will show how company data can help prioritize leads and improve revenue predictions.
A Closer Look at the Data Enrichment Providers Businesses Trust Most
We will take a closer look at data enrichment providers and show how they help organizations build more accurate and complete datasets.