Insights / Articles
6 Data Mining Strategies That Improve Business Success
Struggling to leverage your business data mining for real success? Uncover 6 powerful strategies that can transform your operations.

- 92% of organizations use business data to identify new opportunities.
- Organizations lose approximately 5% of their annual revenue to fraud.
- Collecting more data doesn’t automatically lead to better analytical models.
You rely on data to support decisions every day. It helps you understand your customers, monitor operations, forecast demand, and manage risk.
However, raw data rarely provides the answers on its own. The patterns, relationships, and exceptions that influence business decisions are often hidden across thousands or even millions of records.
This is where data mining becomes useful. It helps you uncover those insights so you can better understand your business, predict future outcomes, and identify risks and opportunities earlier.
Below, we'll explore the key techniques organizations use to turn raw data into actionable insights.
Classification
Classification models predict the category to which a new record is most likely to belong by learning from historical data.
Many business problems already have known outcomes. A transaction is either legitimate or fraudulent. A borrower is likely to repay a loan or default. A customer may stay or leave.
Classification models learn from these records, in which the correct outcome is already known, and identify the patterns associated with each category.
Once trained, the model applies those same patterns to new records. This makes it useful for tasks such as:
- Fraud detection
- Credit scoring
- Customer churn prediction
- Supplier risk assessment
This process sounds simple until you consider the scale at which modern organizations operate.
Visa, for example, processed more than 257.5 billion payment transactions during fiscal year 2025. The system must evaluate every transaction in milliseconds before it makes an authorization decision.
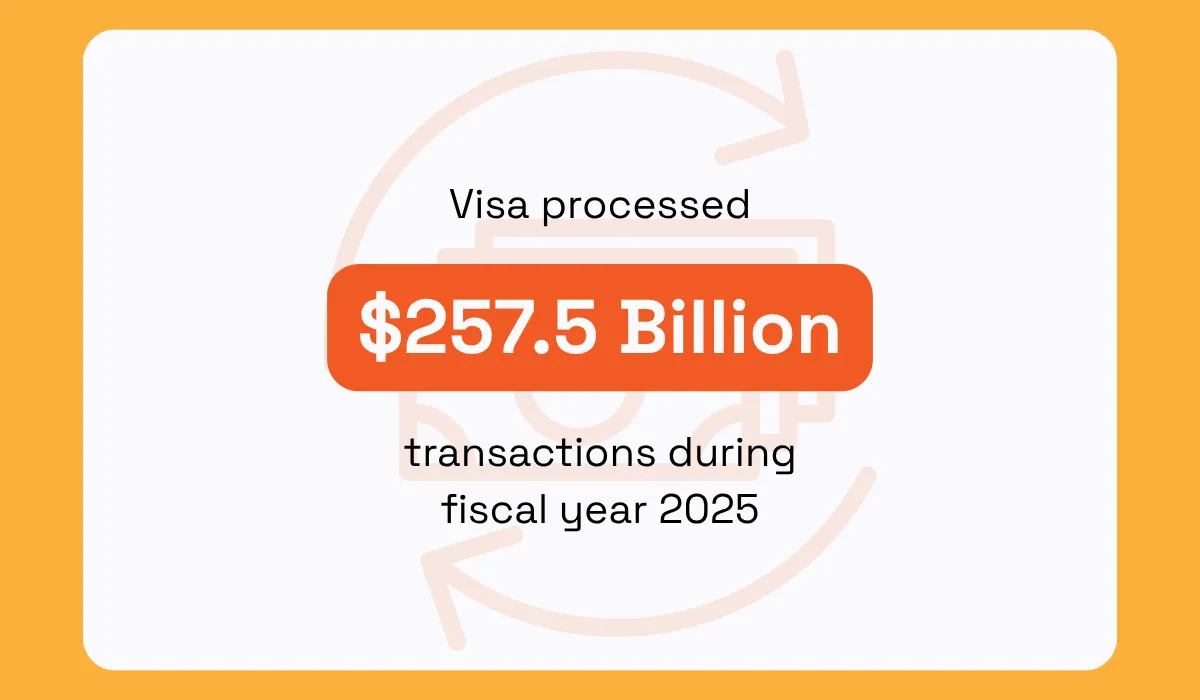
The payment network must determine whether the transaction belongs in the "approve," "decline," or "review" category before the customer even notices the payment is being processed.
That’s why organizations use classification models to make these decisions automatically.
American Express, for example, monitors 100% of transactions across 114 million cards in 106 countries.
Its AI-powered models return approximately 8 billion fraud and credit risk decisions in real time by comparing each new transaction against patterns learned from historical data.
Their AI system uses several machine learning techniques, including recurrent neural networks (RNNs).
RNNs retain information from previous transactions while analyzing the next one. This helps the model recognize patterns that unfold over time, and the additional context leads to more accurate classification.
However, classification models only learn and get better from the data available to them.
Anjali Dewan, Vice President of Risk Management at American Express, attributes much of the company’s fraud detection success to the quality of its data:
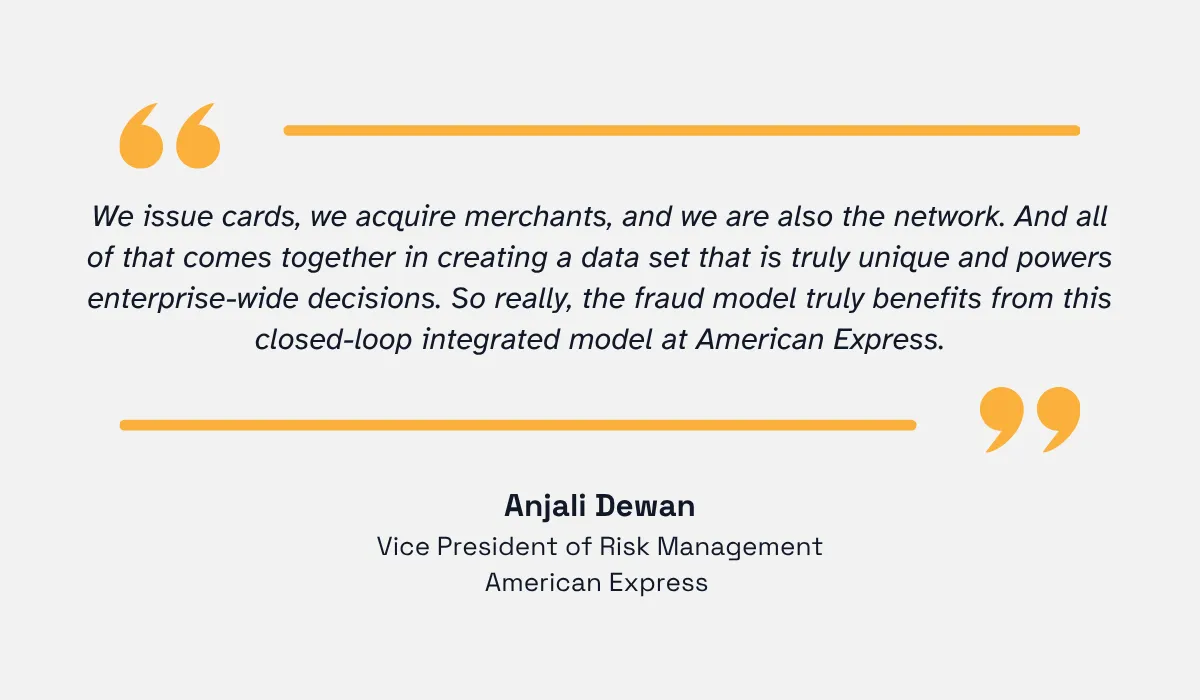
Illustration: Veridion / Quote: John Koetsier
The same principle applies to any classification model.
If your customer records contain missing attributes or outdated information, the model has less information to distinguish one record from another.
Many organizations address this by enriching their internal records before training their classification models.
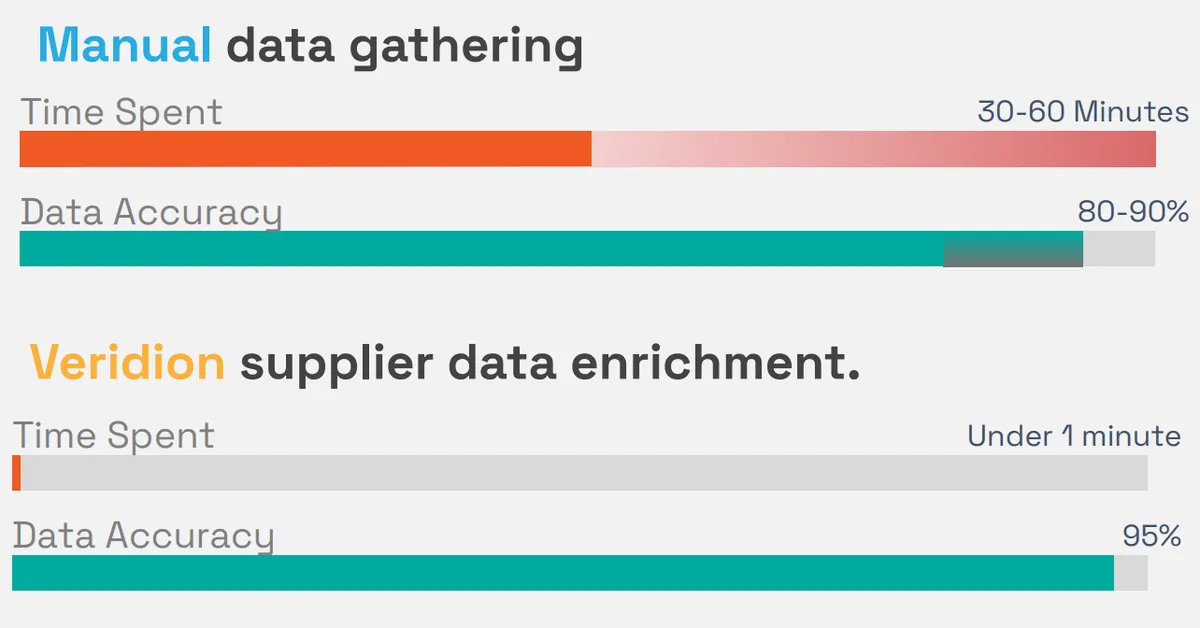
Veridion, an AI-powered business intelligence platform, helps you do exactly that.
Its Match & Enrich API can enrich existing company records using as little as a company name and country of registration. It adds more than 461 business attributes, including:
- industry classifications
- ownership information
- company size
- operational status
- geographic footprint
- digital presence
Not only that, but Veridion also tracks more than 693M companies across 250 countries and refreshes its data every week.
So instead of relying on basic customer records, your model can classify companies using various operational signals and other business characteristics.
Source: Veridion
These attributes become additional signals that help the model recognize patterns more accurately.
Classification works best when the outcome you want to predict is already known. However, business data does not always come with predefined categories.
Sometimes the first step is discovering patterns that have never been identified before. That is where clustering becomes a better data strategy.
Clustering
Clustering analyzes the similarities between your records and groups those that share common characteristics.
You can use it to segment customers with similar buying behavior, group suppliers with comparable risk profiles, identify stores with similar sales trends, or uncover spending patterns across different regions.
Without clustering, you often rely on broad customer segments. You might group customers by age, location, industry, or company size because those characteristics are easy to measure.
However, customers with similar demographic profiles do not always share the same preferences or buying behavior.
Victoria's Secret learned this lesson the hard way.

Source: Fortune
For years, the company built its brand around a single customer persona while consumer preferences were changing.
Customers who looked similar on paper increasingly wanted different products.
Many shifted toward comfort and inclusivity, while Victoria's Secret continued building its brand around the glamorous "Angel" persona.
As a result, its U.S. lingerie market share fell from 31.7% in 2013 to 24% in 2018.
Consumer preferences shifted, and competitors such as Aerie and later Savage X Fenty attracted customers with products that better reflected those changing expectations.
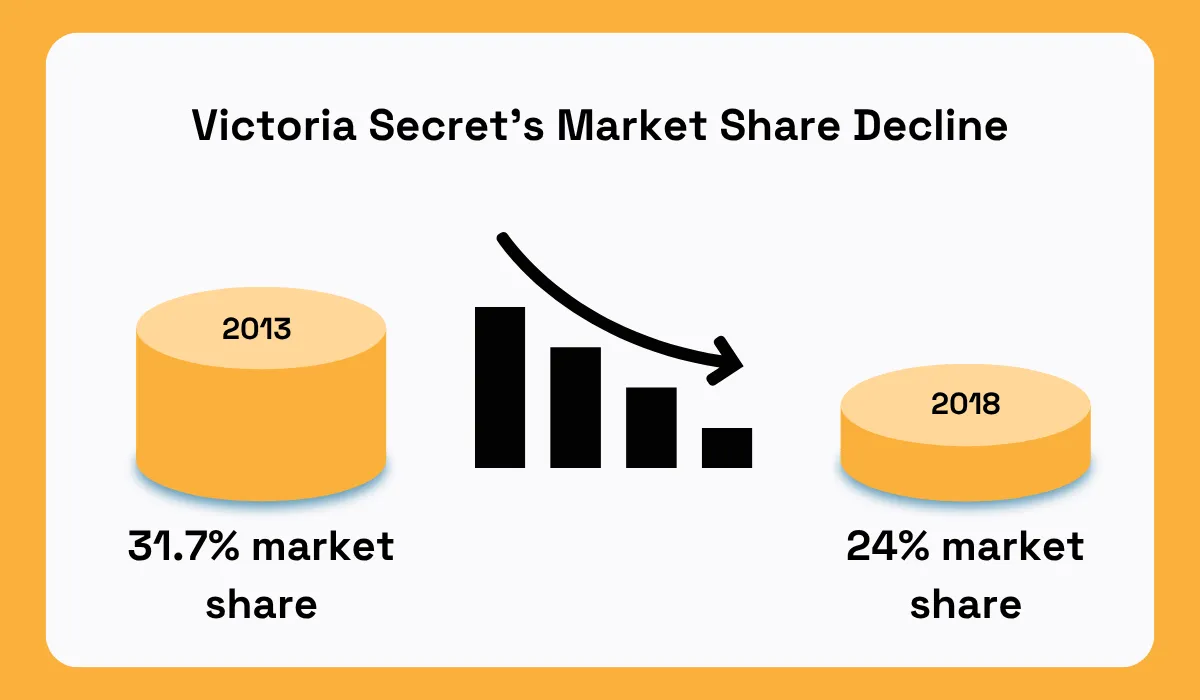
Illustration: Veridion / Data: Coresight Research
Clustering helps you uncover these kinds of behavioral differences before they become costly.
McKinsey, the multinational management and consultancy firm, documented exactly this in its work with a European retail bank that wanted to improve the profitability of its checking accounts.
The bank used clustering algorithms to identify customers with similar preferences and behaviors instead of relying on traditional demographic segments.
The analysis uncovered customer groups with buying preferences that traditional segmentation had failed to identify.
The bank used those insights to redesign its product portfolio, increasing checking account revenue by more than 20%.
Clustering helps you uncover the same kinds of opportunities in your own data.
Marketing teams can personalize campaigns. Banks can design products around customer behavior. Sales teams can prioritize their highest-value customer segments.
Clustering shows you which groups exist in your data. However, it doesn't explain why those groups behave differently or what they're likely to do next.
Regression Analysis
Regression analysis measures how different variables influence an outcome so you can predict what is likely to happen next.
You can use it to forecast revenue, estimate demand, predict customer churn, calculate the probability of loan default, or understand which factors have the greatest influence on your business performance.
Many organizations, however, still build forecasts by extending historical trends into the future.
That approach works when business conditions remain stable.
But markets rarely stand still. Prices change. Customer demand shifts. Competitors launch new products. Economic conditions fluctuate.
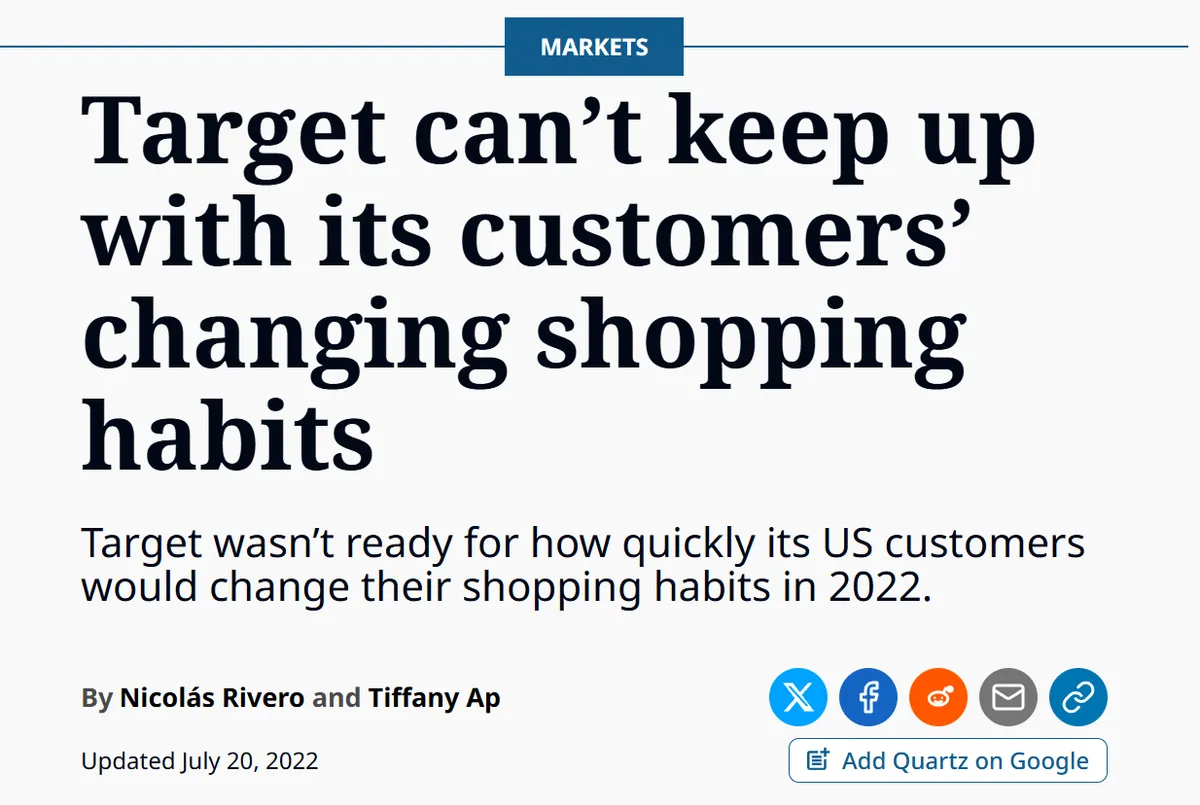
The U.S. retailer Target learned this lesson in 2022.
Source: Quartz
After two years of unusually strong pandemic sales, the retailer expected demand for home goods to remain high.
Instead, consumers shifted their spending toward travel, dining, and other experiences.
As a result, Target's warehouses were filled with televisions, patio furniture, and kitchen appliances that customers no longer wanted.
The company was forced to cancel orders and take approximately $1 billion in markdowns to clear excess inventory.
The company's forecasts reflected what customers had done during the previous two years rather than why their behavior was changing.
This is where regression analysis becomes useful.
Instead of relying on historical averages, it measures how different factors influence an outcome. And as those factors change, the prediction changes too.
You can see this in the pricing system of Uber, the transport multinational.
Uber doesn't charge a fixed fare for every trip.
Instead, its pricing models continuously estimate the appropriate price by evaluating factors such as:
- rider demand
- driver availability
- traffic conditions
- time of day
- local events
When demand suddenly increases, prices rise. Higher fares encourage more drivers to enter busy areas while reducing unnecessary ride requests.
The result is a marketplace that adjusts automatically as conditions change, rather than relying on fixed pricing or historical averages.
Regression analysis helps businesses make the same kinds of predictions.
Finance teams can forecast revenue more accurately. Sales teams can identify the opportunities most likely to convert. Procurement teams can identify suppliers that present higher levels of risk.
Regression analysis helps you predict what is likely to happen next. However, the next challenge becomes identifying which variables genuinely improve those predictions.
Dimensionality Reduction
Most organizations assume that collecting more data automatically leads to better analytical models.
In reality, the opposite often happens.
Customer, supplier, and company records can contain hundreds of variables. Some improve predictions. Others repeat the same information or contribute very little.
As a result, keeping every variable increases the amount of information the model must process.
Training will take longer because the model has more information to sort through. Computing costs increase for the same reason. Predictions eventually become less reliable because the model struggles to distinguish useful signals from unnecessary information.
This challenge is well known in machine learning. As Aurélien Géron, former lead of YouTube’s video classification team, explains:
"Many Machine Learning problems involve thousands or even millions of features for each training instance. Not only do all these features make training extremely slow, but they can also make it much harder to find a good solution."
Organizations can address this by reducing the number of variables before building analytical models.
The goal is to remove only the redundant information so the model can focus on the variables that matter most.
One of the most widely used dimensionality reduction techniques is Principal Component Analysis (PCA).
Instead of analyzing dozens of related variables separately, PCA combines them into sets of components that preserve most of the useful information.
You can see this in fraud detection.
Every card transaction generates hundreds of data points, including:
- purchase location
- Merchant
- customer device
- transaction history
Analyzing every variable makes fraud detection models more complex, and many of those records also contain sensitive customer information.
That’s why banks often use PCA before building fraud detection models.
PCA combines many related variables into a much smaller set of anonymous mathematical components. As a result, the original customer information is removed, but the underlying patterns remain.
This allows the model to identify fraudulent transactions while working with fewer variables and without exposing sensitive financial data.
The same idea applies to your own data.
Customer records, supplier profiles, and operational datasets often contain variables that describe nearly the same thing.
Removing that redundancy helps analytical models focus on the information that genuinely improves predictions.
The benefits extend across every analytical technique.
Classification models identify cleaner decision boundaries. Clustering algorithms uncover more meaningful customer groups.
Regression models focus on the variables that have the greatest influence on future outcomes.
Data Visualization
Data visualization presents complex data through dashboards, charts, and other visuals that help decision makers quickly understand what the data is telling them.
However, many organizations still struggle to build a truly data-driven culture because those insights never become part of everyday decision making.
According to the NewVantage Partners Executive Survey, 92% of organizations have used data to identify new business opportunities.
Yet only 23.9% have created a truly data-driven organization.
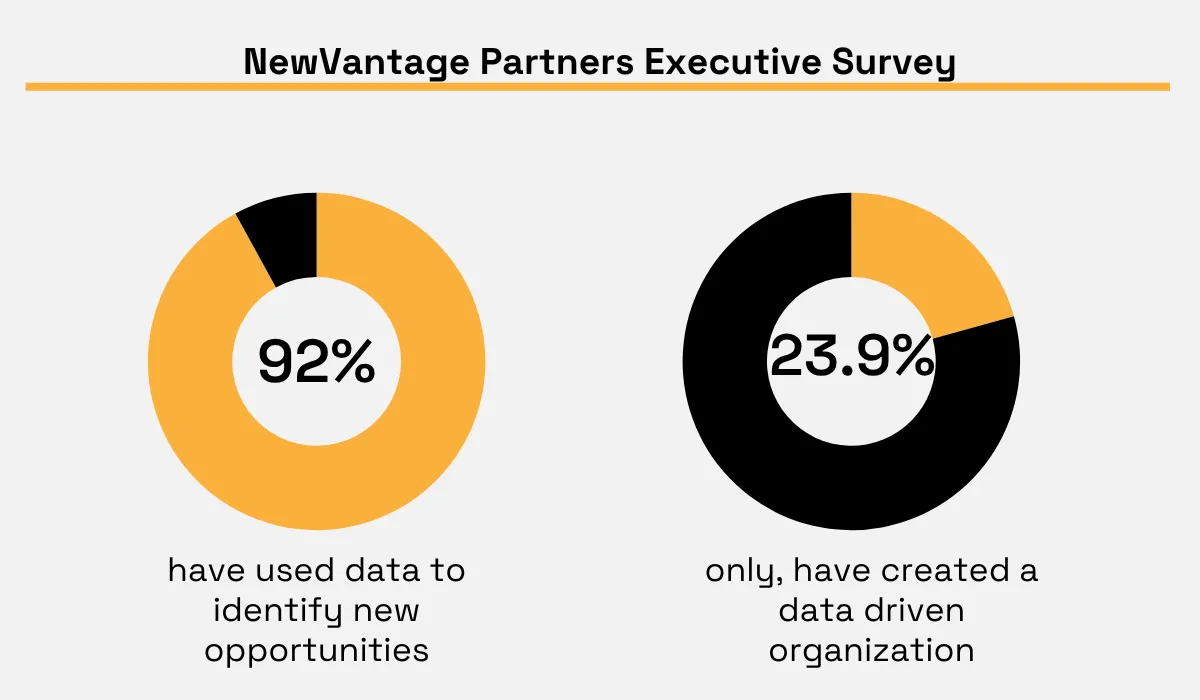
Illustration: Veridion / Data: NewVantage Partners
The challenge is getting these insights into the hands of the people responsible for making decisions.
Visualization helps bridge that gap. You can immediately spot trends, relationships, and anomalies instead of searching through thousands of rows of data.
A study involving a large financial services company illustrates this well.
The company already collected detailed file activity data across the organization. The challenge was helping security analysts recognize unusual behavior quickly enough to investigate it.
So instead of relying on raw logs, researchers developed interactive dashboards that visualized file transfers, employee activity, and other indicators that could point to suspicious behavior.
One of the study's use cases involved an employee who had copied an unusually large number of project files to a USB device over several weekends.
The dashboards made that unusual behavior immediately visible by comparing the employee's activity with typical patterns for similar roles.
The data was already there. Visualization simply made the unusual activity much easier to identify.
Analysts could then investigate the activity instead of searching through thousands of individual records.
The researchers also found that users considered the dashboards intuitive and believed they could reduce the time needed to investigate potential anomalies.
The same principle applies across every data mining strategy.
Classification results become fraud-risk dashboards. Clustering results become customer segmentation dashboards. Regression forecasts become demand planning reports. Dimensionality reduction produces cleaner datasets that are easier to visualize.
Visualization makes the outputs of data mining easier to understand and use.
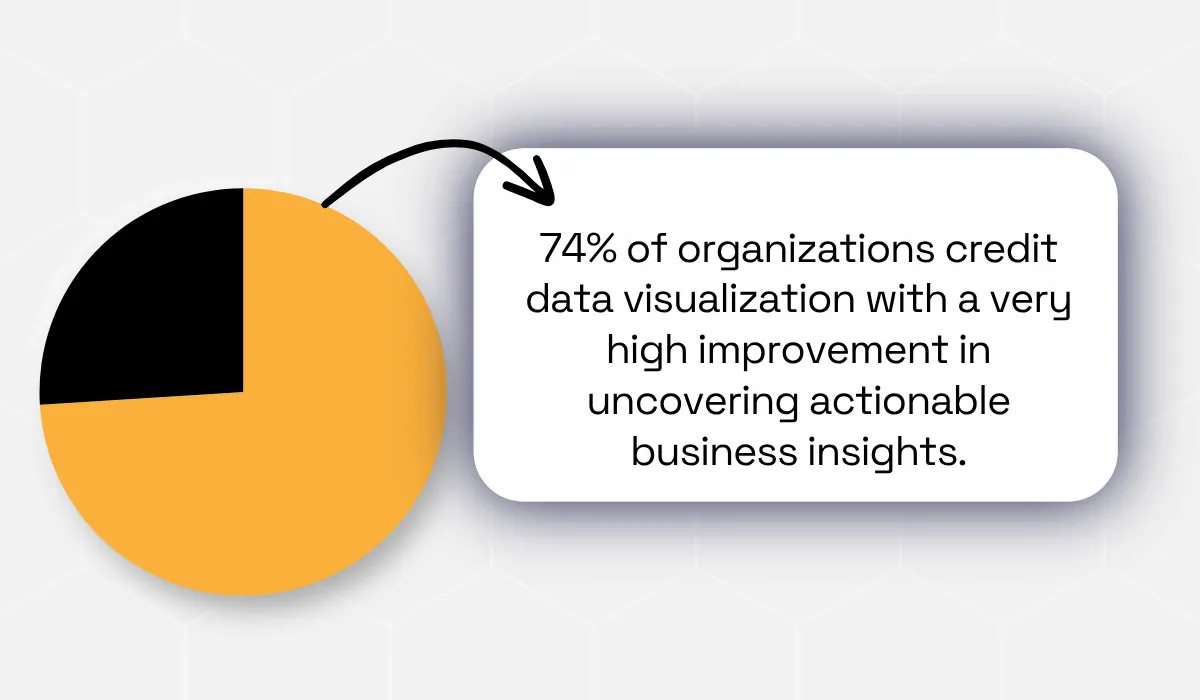
In fact, the data research and education company TDWI reports that 74% of organizations credit data visualization with a high or very high improvement in uncovering actionable business insights.
Visualization helps you see what is happening in your data. The next step is identifying the records that behave differently from the rest.
Outlier Detection
While most data mining techniques help you find patterns, outlier detection helps you identify the records that deserve closer attention.
Those unusual records often reveal hidden risks or new opportunities.
The challenge is that unusual events are easy to overlook.
You probably monitor average sales, spending, production, and customer activity to understand how your business is performing. These metrics provide a useful overview, but they can also hide the individual records that require immediate investigation.
You can see this in payment fraud.
Every day, millions of transactions follow normal spending patterns.
Outlier detection learns what normal spending looks like, then highlights the transactions that fall outside those patterns.
A purchase in an unfamiliar location, an unusually large payment, or a sudden change in spending may indicate that something is wrong.
The payment giant Mastercard is the perfect example.
Instead of relying only on fixed rules, Mastercard’s fraud detection systems evaluate each transaction in context.
They consider signals such as:
- spending behavior
- purchase history
- merchant information
- transaction location
…to determine whether a payment matches a customer's normal activity.
Looking at those signals together helps the system distinguish suspicious transactions from legitimate ones, reducing unnecessary fraud alerts.
The same approach works beyond payment fraud.
An unusual supplier payment may indicate fraud. A customer whose buying behavior changes unexpectedly may be preparing to leave or could represent a new sales opportunity.
Finding those exceptions early can have a significant business impact.
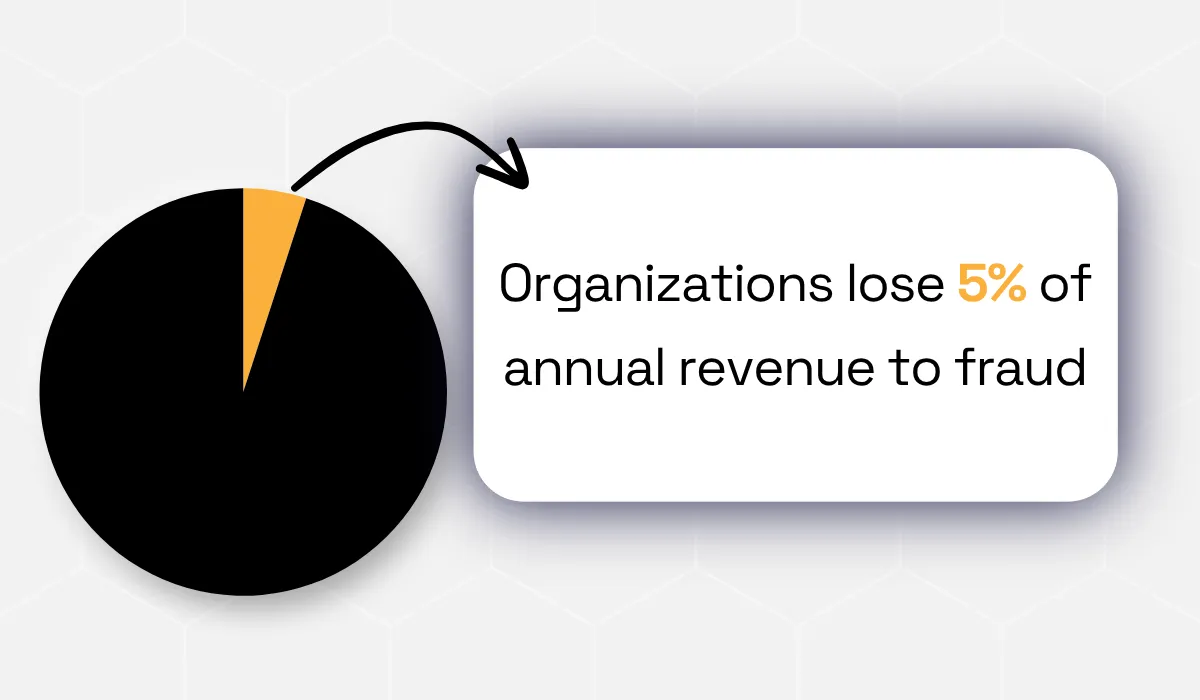
According to the Association of Certified Fraud Examiners, organizations lose approximately 5% of annual revenue to fraud, yet many fraud schemes continue for months before they are discovered.
Outlier detection helps you identify these records early, giving you more time to reduce risk, uncover opportunities, and make better business decisions.
Conclusion
Data mining helps you uncover the patterns, relationships, and exceptions hidden within your data.
The benefits can be significant. You can understand your customers more clearly, forecast future outcomes more accurately, identify risks earlier, and make faster decisions.
Each strategy serves a different purpose, but they all help you turn raw data into information you can wield for your benefit.
Choosing the right technique for the problem you're trying to solve helps you get more value from your data.
Articles
Discuss how these trends affect your organization.
Our analysts are available for a short call. Bring a specific question and we will ground it in the data.
Insights
Keep reading
More analysis, research, and outcomes grounded in live company intelligence.
What Are the Top AI Data Collection Companies?
Need better training data for your AI models? Here are the top companies specializing in AI data sourcing and enrichment.
Top Data Collection Companies
In this article, you will discover top data collection companies and learn how their solutions help businesses gather reliable data.
Data Companies to Know About in 2026
Looking for data companies to follow in 2026? This guide will introduce key players shaping the future of data and analytics.