Insights / Articles
How Decision-Grade Data Powers More Efficient Commercial Insurance Pricing
Tired of inefficient commercial insurance pricing? See how decision automation with decision-grade data transforms your underwriting.

- 50% of commercial properties are misclassified, causing $4.5B in premium leakage.
- Underwriters waste 41% of their time on manual administrative tasks.
- Decision-grade data prices actual business operations, not generic industry codes.
- Pre-validated data lets you quote in minutes to win competitive deals.
Commercial insurance pricing fails when your data doesn't reflect current circumstances.
A company relocates, launches new product lines, expands its fleet, or changes suppliers, yet your rating algorithm still relies on outdated information.
Here's the thing: decision-grade data turns those changes into usable pricing signals.
The result?
You price faster, segment risk more effectively, and protect margins without adding friction.
Here is how decision-grade data can sharpen five parts of your pricing process, and what you can do to put it to work.
Better Risk Segmentation
Traditionally, when pricing commercial insurance, companies often begin with industry code, revenue band, location, and claims history.
While these factors remain relevant, they mask what truly determines loss costs.
Two businesses can share all these inputs and still carry very different exposures.
For instance, two companies can have a similar NAICS code while carrying different risk.
Think about a food distributor with refrigerated storage, high nighttime fleet usage, and a single vulnerable cold-chain supplier.
It certainly cannot have the same exposure as a distributor with dry goods, local routes, and redundant suppliers.
When your data ends with the code, low-risk accounts subsidize high-risk accounts, and your better accounts will have cause to switch.
Decision-grade data helps close that gap.
It captures footprint, function, activity, product, and service lines, corporate structure, ESG metrics, and location-based exposure, so you can segment by what a company does rather than how it is classified.
When you rely purely on generic categories, basic facts get missed.
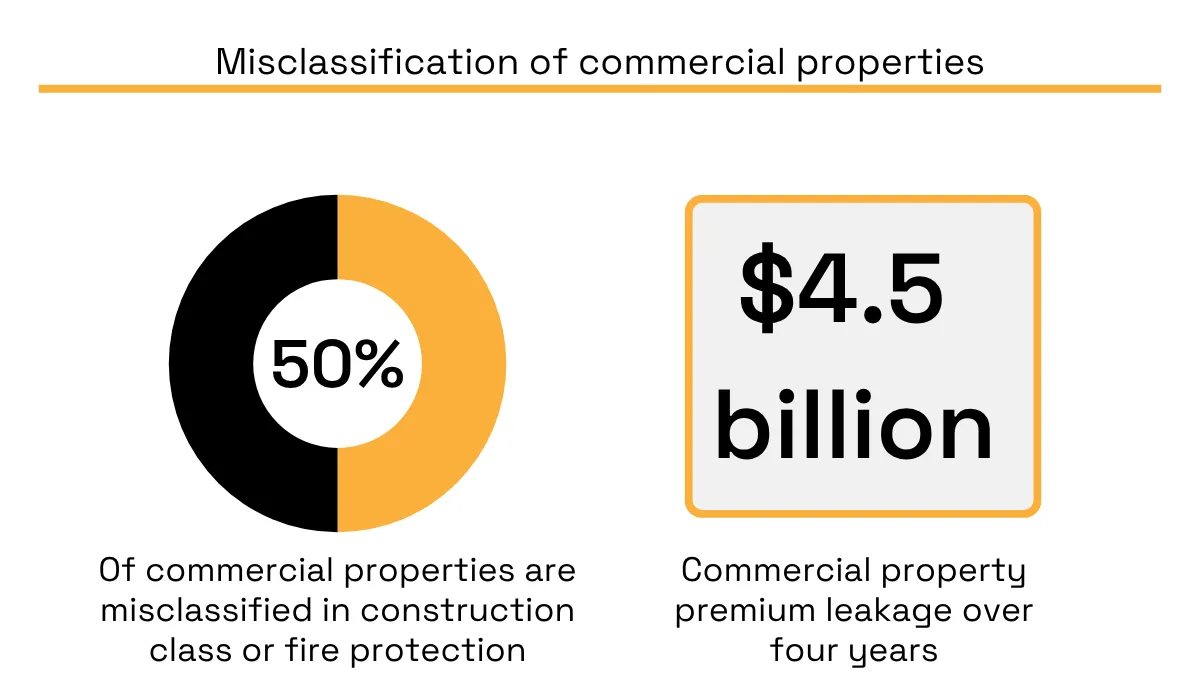
Verisk found that almost 50% of commercial properties are misclassified in construction class or fire protection, resulting in an estimated $4.5 billion in commercial property premium leakage over four years.
Segmentation closes that hole.
It stops you from overpaying the good accounts that you want to keep, and from underpaying the risky accounts you don't realize you have.
Create your segmentation based on data that can drive your pricing.
You can make use of:
- legal entity verification
- current operating sites
- products and services
- employment and revenue brackets
- business activities codes
- ESG events
- asset utilization
- supply chain interdependence
- ownership connections
- hazard indicators on an individual site level
Link each of these data signals to a pricing action.
For example, a new cold storage facility could prompt an examination of spoilage coverage.
On the other hand, a new overseas supplier could prompt a business interruption aggregation assessment.
Additionally, a new facility in a wildfire zone can trigger changes to property deductibles, and a new product line could prompt a class code review.
A valuable segmentation audit requires three steps.
First, compare your existing rating classes to enhanced operational characteristics.
Second, pinpoint the classes where claims tend to cluster around behaviors that have not yet been priced.
Third, check whether a new characteristic changes the ranking effect among accounts that now receive identical ratings.
Fourth, determine whether a new characteristic is sufficiently understandable for underwriting, compliance, and broker discussions.
The reward is better pricing.
When you price based on verified attributes rather than broad categories, you keep the good accounts and price the bad ones correctly.
Here is where decision-grade data pays for itself.
Faster Underwriting Decisions
Speed is a pricing variable in competitive commercial lines.
If your quote takes days and another company responds in minutes, the broker has less reason to wait.
The time waster is rarely one big task. It is the pileup of small checks.
Commercial underwriting slows down because underwriters have to verify names, addresses, class codes, operations, ownership, limits, prior information, missing fields, and documents.
That work wastes your billable hours.
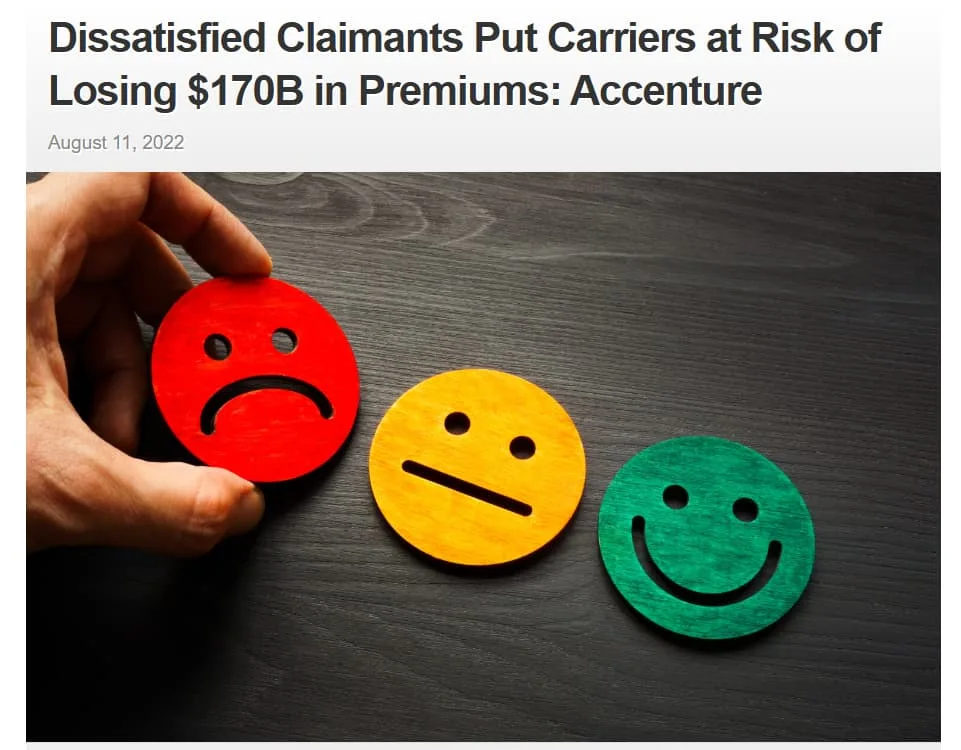
According to the Accenture Future of Underwriting Survey, reported by Insurance Journal, underwriters spend about 40% of their time doing non-core and administrative activities. The loss from those activities was estimated at between $85 and $160 billion over five years.
Source: Insurance Journal
Here is where decision-grade data impacts your process.
Decision-grade data does not require underwriters to trust raw data.
It simply enables underwriters to see standardized, deduplicated, fresh, and confidence-scored data before even looking at the account.
Clean company data will immediately impact the quote pathway.
Veridion's Match & Enrich API enables a complete business overview based on the company name and address, quick pre-fill and applicant verification, and faster quote-to-bind workflows through business validation.
Source: Veridion
Apply that type of enhancement right at the beginning, before any human has even touched the file.
Here's the nuts-and-bolts play: create an automatic verification lane.
If the name, address, industry classification, website, operational status, and location of the risk are verified against reliable sources and meet your criteria for accuracy, move the risk to the straight-through triage.
If it does not fit your criteria, end it to an underwriter with a code indicating why.
This kind of verification eliminates any "general inquiry" follow-ups and allows your team to spend broker time on exceptions, coverage design, and pricing judgment.
Measure the process by hour, not project phase.
Track how much time is spent from submission to appetite decision, from appetite decision to quote, and from quote to binding.
Next, separate delays into two categories: those due to insufficient data and those due to underwriting judgment.
This distinct separation shows you when decision-grade data could speed things up without compromising controls.
As a result, speed becomes a pricing advantage.
Generating quotes from pre-validated data lets you deliver the first credible quote and win the deal.
Improved Loss Prediction Models
Your premium depends on your estimated losses.
Each premium is a prediction based on expected losses, driven by the data that inform the actuarial and statistical models.
Input poor data into your models, and you will get poor predictions.
But feed them good quality, fine-grained, validated data, and predictions become more accurate.
A small improvement in each risk estimate makes a big difference when applied to many thousands of policyholders.
What makes data quality so important in this case?
Today, pricing uses both actuarial and machine learning models.
The Casualty Actuarial Society notes that the adoption of machine learning in the insurance industry has been hampered by regulatory concerns, privacy and communication issues, and insufficient data.
The algorithms are only as powerful as the data they are given.
According to the Society of Actuaries, generalized linear models are the industry's workhorses, but insurance claims data are sparsely distributed, volatile, skewed, and time-variant.
Lenny Shteyman, an actuary at MetLife, puts it plainly:
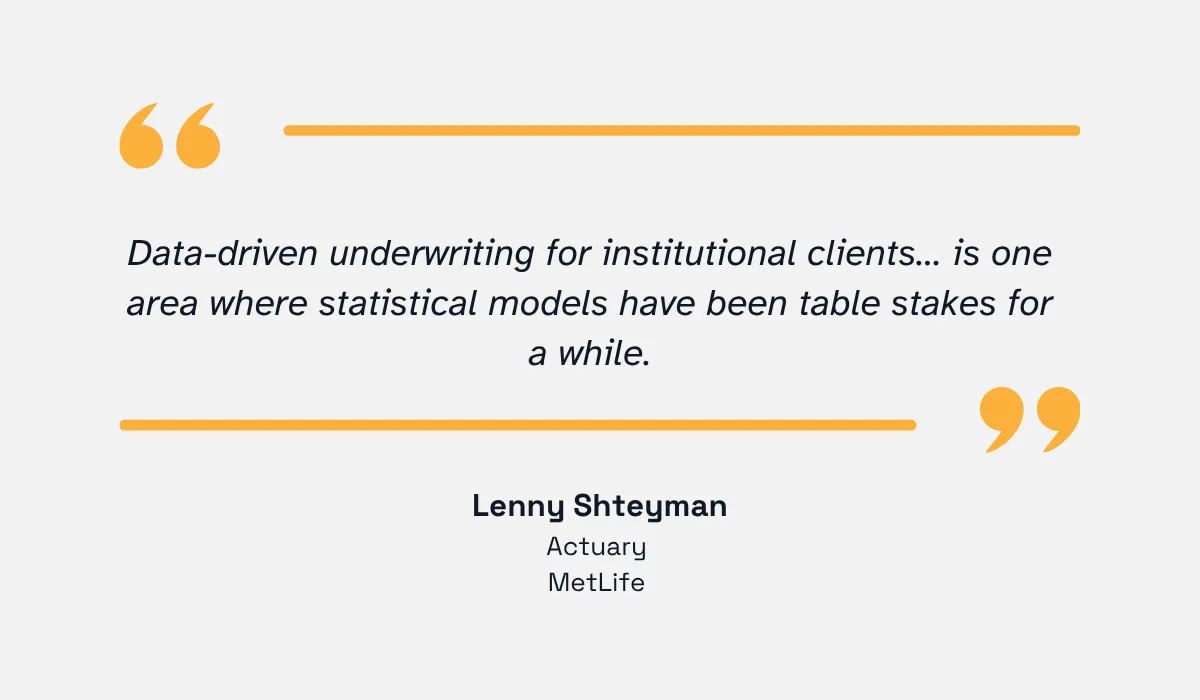
Illustration: Veridion / Quote: American Academy of Actuaries
That is because it contains data, is multidimensional, has business implications, and requires a repeatable process.
So how do you feed your models higher-quality data?
Begin by creating a model data contract.
Specify required fields, formatting possibilities, refresh rate, lineage, and confidence scores.
After that, test if enriching the variables increases the lift, calibration, and stability for the renewals cohort, new business, and brokers.
Do not just create one aggregate lift chart.
Evaluate performance by industries, geographies, accounts, sizes, and distribution partners because even a variable improving the whole portfolio might introduce bias in a smaller segment.
The main idea here is very simple: your model will be as good as its input data.
Enriched, clean data makes loss prediction more accurate, allowing you to price closer to actual risk.
Dynamic and Usage-Based Pricing
An annual premium assumes that the business stays static for an entire year.
It never happens like that.
Sometimes revenue changes, the company opens another office, the fleet grows, and the ownership changes.
Each change in the business is left behind by the static annual premium, and you keep charging last year's price for this year's risk.
Better data pipelines close that gap.
When verified attributes refresh continuously, you can move toward dynamic and usage-based pricing that responds to changing exposure.
Why is this shift gaining ground now?
Because the market is alongside it.
The usage-based insurance market is projected to grow from 34.79 billion dollars in 2026 to 69.18 billion dollars by 2031, and commercial vehicles are among the fastest-growing segments, with a 16.21 percent compound annual growth rate.
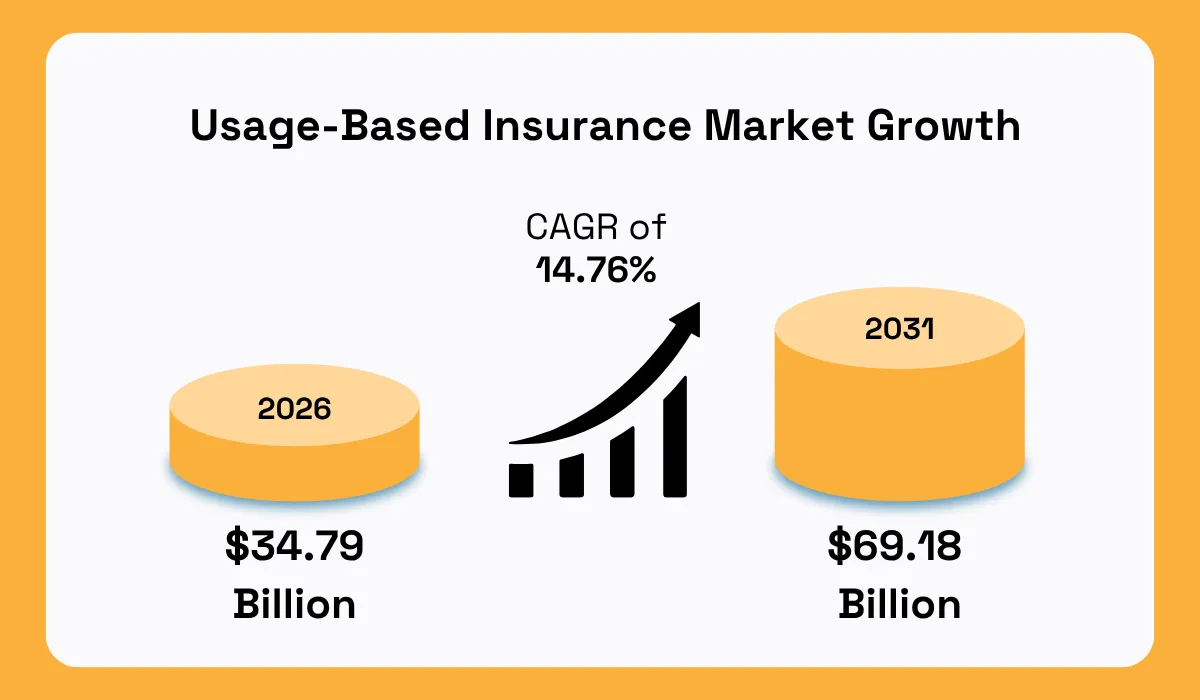
Illustration: Veridion / Data: Mordor Intelligence
A good example is fleet telematics that prices based on miles driven and driving behavior.
Trigger-based parametric insurance coverage, which pays out based on a specific metric such as wind speed or temperature, is another example.
These rely on the availability of new data, and both help reduce the delay between changes in the risk profile and changes in the price.
How does one start going down this road?
Select a line where the risk is changing quickly and where there is clear data, and price using a live feed instead of a snapshot.
Both commercial auto and property will work well here.
Monitor the risks of your current business so that new exposures, increased revenue, or even a change in ownership will initiate a new assessment rather than waiting until renewal.
Much of renewal churn stems from poorly priced renewals driven by outdated pricing data.
Better yet, it helps improve renewals.
You no longer surprise your insured with an increase in annual premiums; you tell them exactly why.
Create guardrails before you get started.
Define update windows, credibility levels, broker notifications, and manual review in case of a material change to the premium.
Make sure to separate rating changes from alerting changes.
The signal strength may be sufficient for review, but not yet enough to change a premium.
This kind of separation will help you take action sooner while keeping the pricing system stable.
Now, your end product becomes a premium that reflects the actual risk level.
You reduce the lag between risk changes and premium adjustments, and you turn annual surprises into changes your insureds can understand.
Lower Operational Cost in the Pricing Process
Data wrangling is costly, and you don't even see it on the balance sheet.
Your analysts spend countless hours manually cleaning the data.
Your underwriters re-underwrite the account because a crucial field was either missing or inconsistent.
Your staff reconciles the same business from three different vendor data files.
None of this work shows up as a line item, yet it drains hours every day.
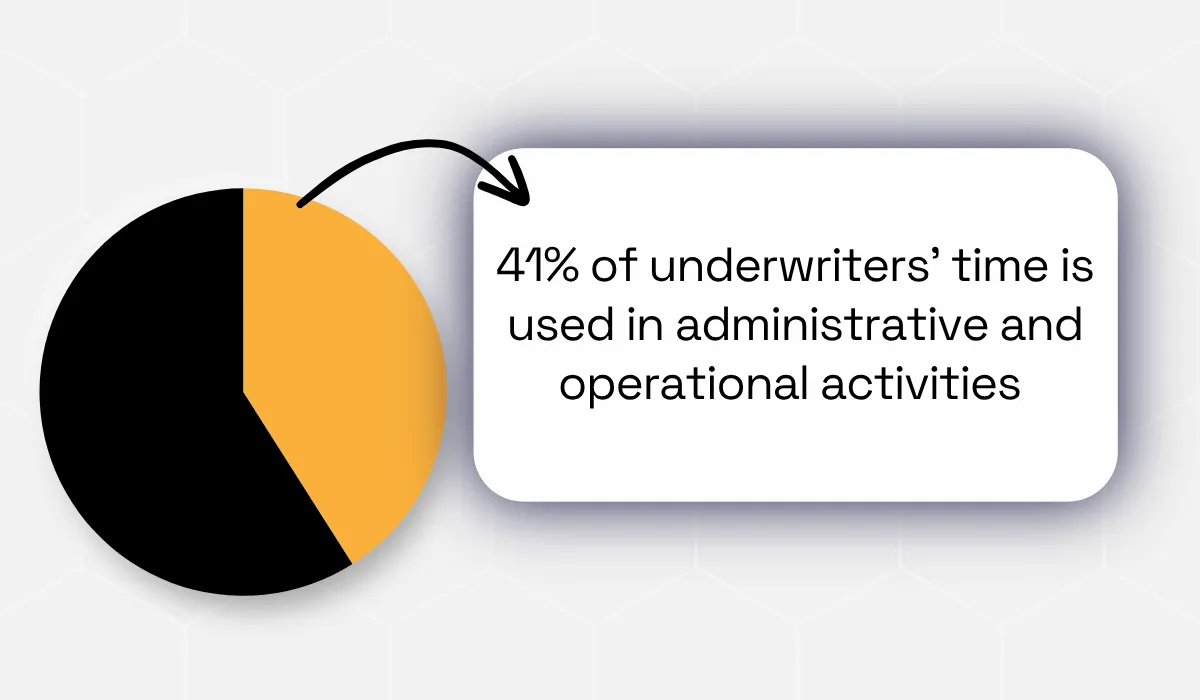
Capgemini's 2024 World Property and Casualty Insurance Report found that more than 41 percent of underwriters' time is devoted to administrative and operational activities, constraining pricing and the broker or customer experience.
The cost of the problem is straightforward.
If your submission team processes 5,000 files a month and spends 30 minutes per file on avoidable validation, that's 2,500 hours of capacity.
At the enterprise level, that translates into delayed quotes, slowed referral processing, higher expense ratios, and wasted time steering the portfolio.
Decision-grade data helps you eliminate inefficiency at its roots because all inputs are cleansed, standardized, and reconciled.
How does that extra capacity help your insurance business?
If your underwriters and actuaries are not wasting their time reconciling data, then they are reviewing the policies that require thoughtful consideration: risky deals, unusual situations, and negotiations in which experience counts.
And so the scarce resource is not data input but decision-making.
The logic here is straightforward.
If you regain a significant share of the 40 percent of time previously wasted, you either increase the number of policies reviewed by the same submission team or give your valuable employees time to review the complex policies.
Both solutions will result in cost savings on each policy and improve its quality.
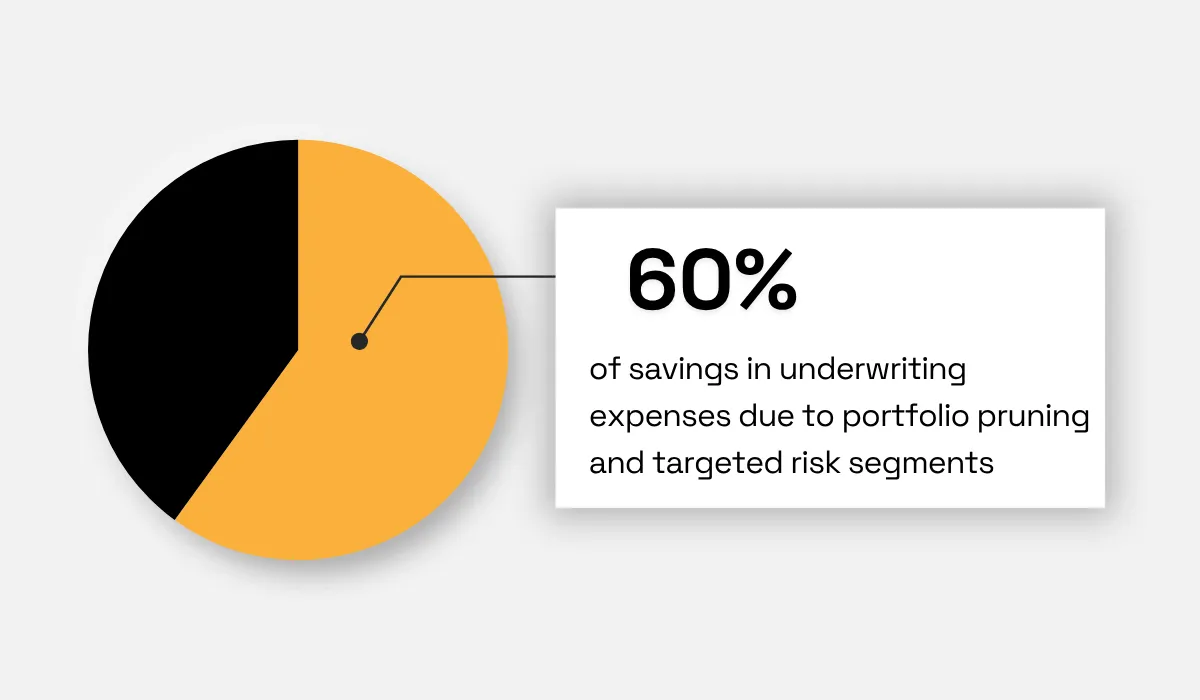
Swiss Re reports examples where analytics produced 60% savings in SME underwriting expenses through portfolio pruning and targeting preferred risk segments.
But how do you actually achieve such savings?
Integrate all your data sources into a single verified data stream so you don't have to reconcile inconsistent files.
Automatically standardize and augment incoming data before a human starts handling it.
Send only the really tricky risks for manual processing, and let clean, verified submissions go smoothly through a light check.
The outcome will be decreased cost per policy and efficient use of your best people.
Clean inputs in the intake phase mean less time spent fighting data issues and more time on proper risk pricing.
Conclusion
Good data delivers greater precision, faster speed, and lower costs in the pricing of commercial insurance products.
It helps you segment risks by actual business operations, reduce underwriting cycles, build better loss models, offer dynamic pricing, and prevent rework.
The next step should be practical.
Choose one line, one segment, and one decision about pricing that suffers from poor data.
Improve that data flow first.
Scale the improvements that positively affect conversion, loss ratio, and underwriting capacity.
Articles
Discuss how these trends affect your organization.
Our analysts are available for a short call. Bring a specific question and we will ground it in the data.
Insights
Keep reading
More analysis, research, and outcomes grounded in live company intelligence.
4 Types of Business Data Your Company Needs
In this article, we cover the four key types of data your company truly needs to both collect and use in procurement.
5 Insurance Underwriting Trends to Watch For
Learn about the top 5 insurance underwriting trends redefining risk assessment, pricing, and portfolio resilience in the years ahead.
Top 5 Challenges In Insurance Underwriting
This article outlines five major underwriting challenges insurers must manage to maintain accuracy, compliance, and profitability.