Insights / Articles
What Is Firmographic Data? A Plain-English Guide for B2B Teams
What is firmographic data? Understand the essential B2B data points that drive sales and marketing success. Find top firmographic data providers.

- Firmographic data helps B2B teams assess whether a company fits their target market.
- Industry, company size, location, and ownership form the foundation of a firmographic profile.
- Modern firmographic providers add hundreds of structured attributes for deeper company analysis.
Outbound campaigns often raise the same question: Is this company worth your team's time?
Answering that requires a consistent way to describe what a company is, structurally, so your team can compare one account against another and make that call with confidence.
That's what firmographic data does.
This guide breaks down what it covers, the variables most B2B teams build around, and why modern providers are expanding the profile far beyond the basics.
What Is Firmographic Data?
Firmographic data is the set of company-level attributes that play the same role for businesses as demographic data plays for people.
People can be described by demographic attributes such as age, income, and location.
Companies can be described in much the same way, using industry, revenue, employee count, and location to determine if they belong in your target market.
A company can match your industry criteria but fall outside your size range. Yet another might have the right revenue but not be the best fit for your solutions.
Firmographic data gives you the structured attributes needed to make those distinctions before you invest time in any company.
The Core Firmographic Variables
A firmographic profile can run to dozens of data points, including growth signals, funding history, hiring velocity, and more.
Addresses, B2B teams, and all of it to start segmenting beginning.
They usually build around these smaller, consistent core variables instead:
- Industry classification
- Company size
- Geographic location
- Ownership structure and growth stage
Each variable answers a different piece of the same underlying question, starting with the one most teams apply first.
Industry Classification
The industry field is usually the first filter applied.
A company's industry shapes the regulatory environment it operates in, the budget cycle it follows, and how its buying committee typically makes decisions.
A healthcare company and a manufacturing company can sit at the same size and revenue and still clear a purchase through entirely different approval chains.
Take HubSpot, the CRM and marketing software company.
Its SEC filings classify it under Standard Industrial Classification (SIC) code 7372, “Services-Prepackaged Software,” a code that appears on its filings as far back as 2018 and remains on its most recent 10-K.
That classification gives you an immediate starting point for understanding the kind of business you're dealing with.
But the classification systems themselves vary by source.
The U.S. government established the Standard Industrial Classification system in 1937.
The North American Industry Classification System (NAICS) replaced it as the federal statistical standard in 1997.
The SEC never made the switch, though. It still assigns SIC codes to every public company filing today, which means the same company can carry a SIC code in one database and a NAICS code in another, and the two won't always point to the same conclusion.
That kind of mismatch isn't rare.
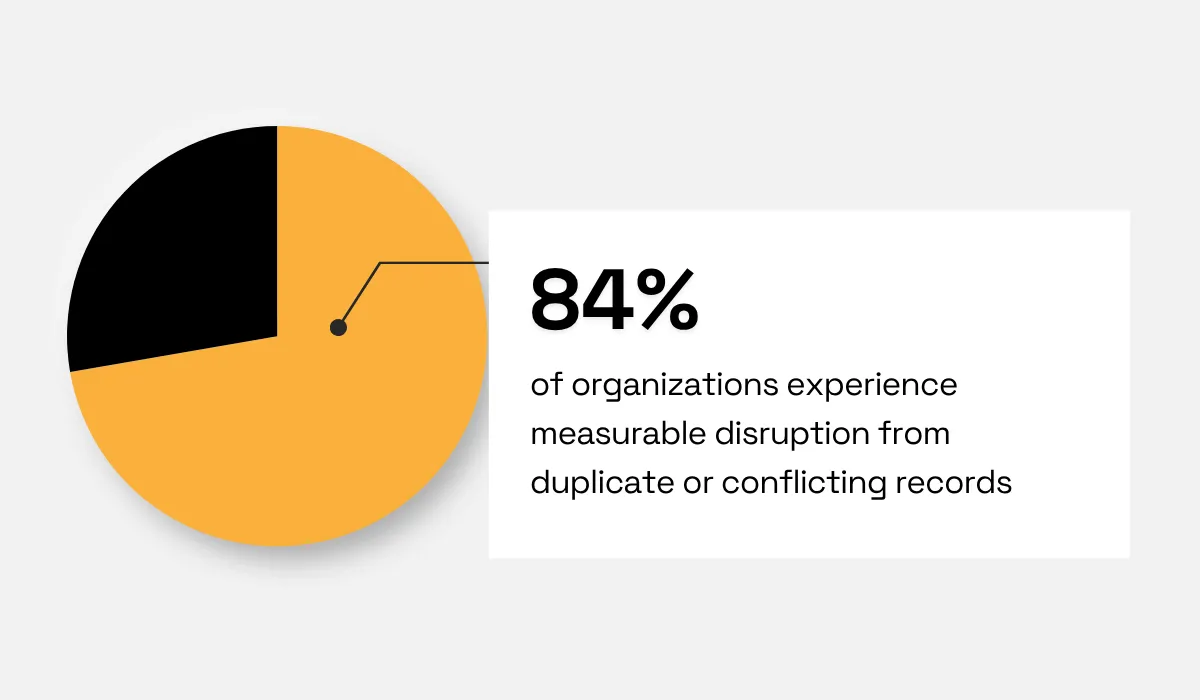
A 2025 survey of enterprise data teams by Melissa, a data quality and address verification provider, found that 84% of organizations experience measurable disruption from duplicate or conflicting records, the same underlying problem that produces multiple classification codes for one company.
That is why industry classification works best as a starting filter.
It tells you which regulatory and budget environment a company likely operates in.
It doesn't tell you whether that specific company is ready to buy, which company size helps answer next.
Company Size: Employees and Revenue
Employee count and revenue together determine whether a company has the scale and budget to be your realistic buyer.
Shopify, the e-commerce platform provider, is a useful illustration.
According to Shopify's 2025 annual results, the company closed the year with roughly 7,600 employees and $11.6 billion in revenue.
Those figures place Shopify well beyond the size range of a small or mid-market prospect, which is relevant if you're deciding whether an enterprise-tier offering is the right fit.
Looking at only the employee count to decide can be misleading because two companies with 250 employees can have very different financial capacity depending on their margin structure.
Employee count reflects operational size, while revenue reflects financial scale, and the two don't always move together.
Revenue alone, on the other hand, has the opposite problem.
A company can report substantial revenue with a relatively small workforce because it resells products, passes revenue through its business model, or runs a highly automated operation.
Using both fields gives you a better basis for judging how much money flows through the company and how much operational capacity sits behind it.
It also gives your scoring and segmentation models two complementary signals rather than forcing one number to carry the entire qualification decision.
Geographic Location
Geographic location affects everything from sales territory assignment to the legal and commercial conditions surrounding a potential buyer.
At the basic level, that means knowing the city, region, or country where a company operates.
At a broader level, it gives you context for how that market works.
The location determines which regional team owns an opportunity, where sales resources should be concentrated, and how companies are grouped for market coverage.
It can also shape how a sales team approaches the same industry across different markets, because language, procurement practices, and local business regulations vary by region.
A 2025 research dataset from the European University Institute tracked 331 separate data localization regulations across 155 countries as of December 2024.
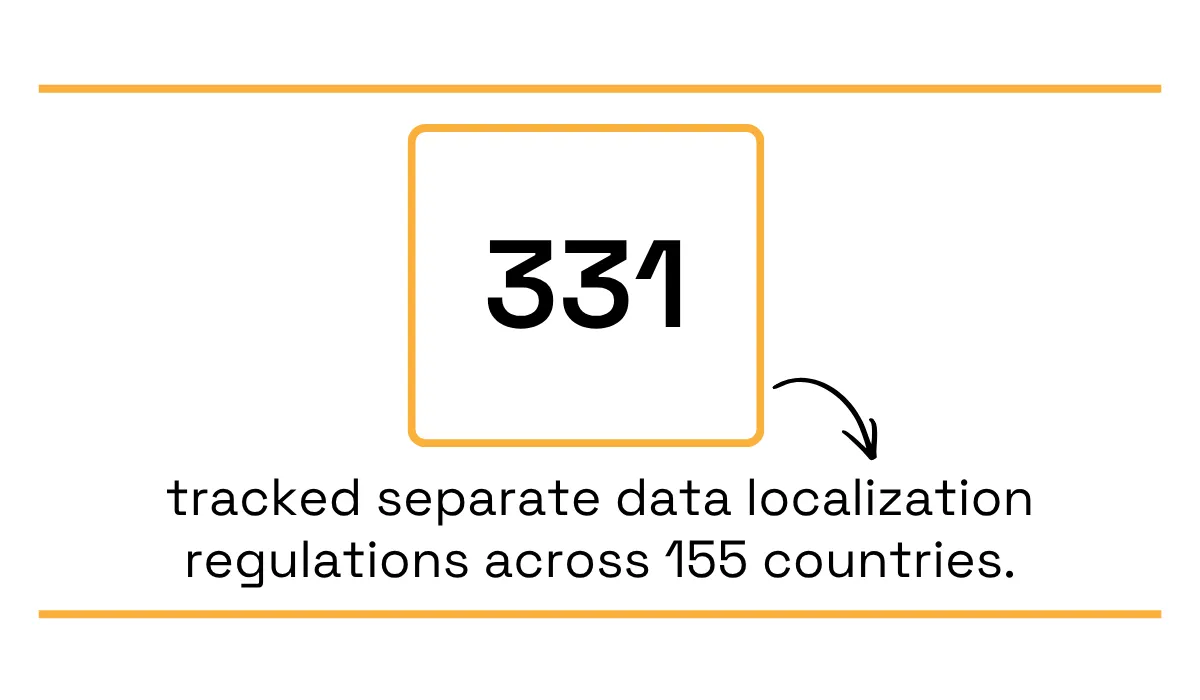
Illustration: Veridion / Data: European University Institute
When a prospect's own data has to stay within its borders, that shapes how they'll expect any vendor, including you, to handle their information.
Atlassian, the enterprise software company behind products such as Jira and Confluence, offers an example of this in practice.
Its cloud customers can choose defined data-residency locations, including the EU, Germany, the United Kingdom, Australia, Canada, India, Japan, and the United States, among others.
Atlassian explains that data residency can help organizations meet regulatory and internal data-management requirements, with stricter requirements often applying in regulated industries such as finance, government, and healthcare.
Even when every sales interaction happens entirely online, there's still a need to account for where your target companies operate.
Ownership Structure and Growth Stage
Ownership structure and growth stage give you another layer of context when evaluating a company.
Together, they tell you who influences major decisions, how much external pressure surrounds spending, and how quickly the business is likely to change its priorities as it grows.
That picture starts with who controls the company.
A bootstrapped business generally retains control with its founders and operates from internally generated revenue, while a venture-backed business has taken outside capital to fund growth.
This affects how much financial flexibility the business has and what it prioritizes when allocating resources.
Mailchimp, an email marketing company, never raised a single round of outside funding across two decades in business, building its way to roughly $800 million in annual revenue before Intuit acquired it for $12 billion in 2021.
Every resource decision along the way stayed with its two co-founders, not a board of outside investors.
But most companies don't follow that path.
An analysis by ChartMogul of more than 2,500 SaaS companies found that VC-backed businesses generally reach growth milestones faster once they pass roughly $500,000 in annual recurring revenue, while bootstrapped companies grow more consistently across market cycles and adapt faster when conditions turn.
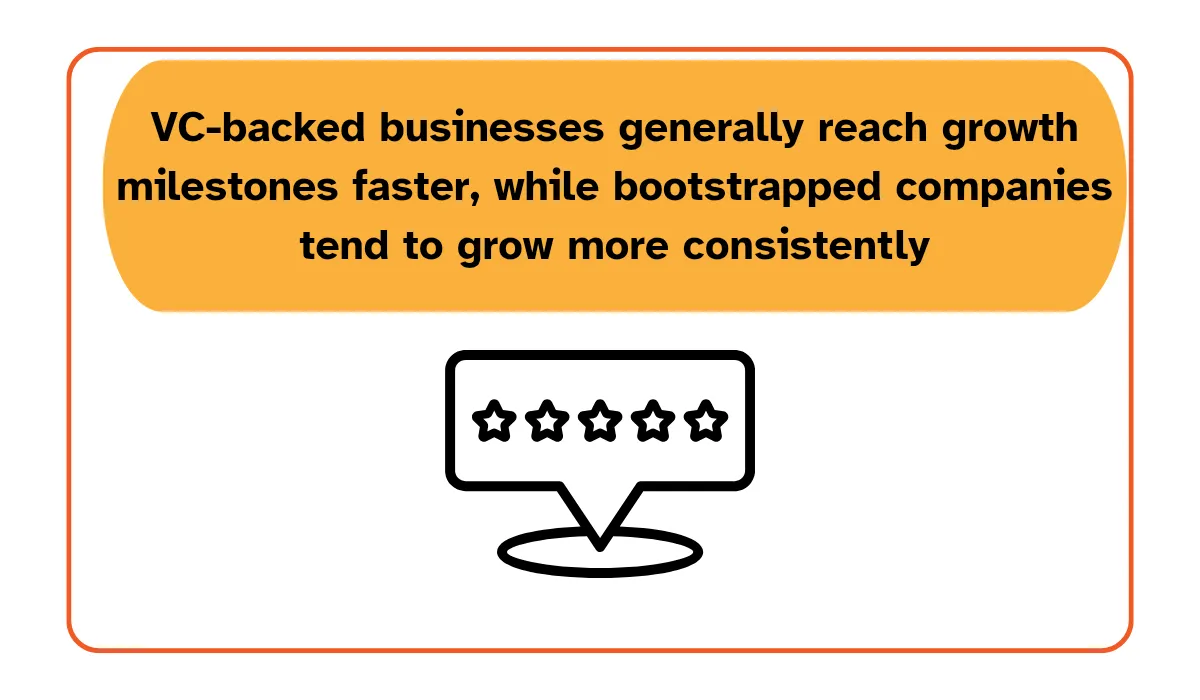
Illustration: Veridion / Data: ChartMogul
That does not make one ownership structure a better prospect than another.
A VC-backed company may have access to external capital and a stronger mandate to scale, while a bootstrapped business may place greater emphasis on efficiency and sustainable growth.
The company's stage tells you where it currently sits within that trajectory, and helps put its budget, priorities, and operational needs into context, especially when assessing if it fits your target market.
Beyond the Basics: What Modern Firmographics Include
Industry, company size, location, and ownership give you a useful starting point for defining your target market.
But those attributes only describe part of the picture.
Modern firmographic data expands beyond those traditional attributes to include a much broader set of structured company information.
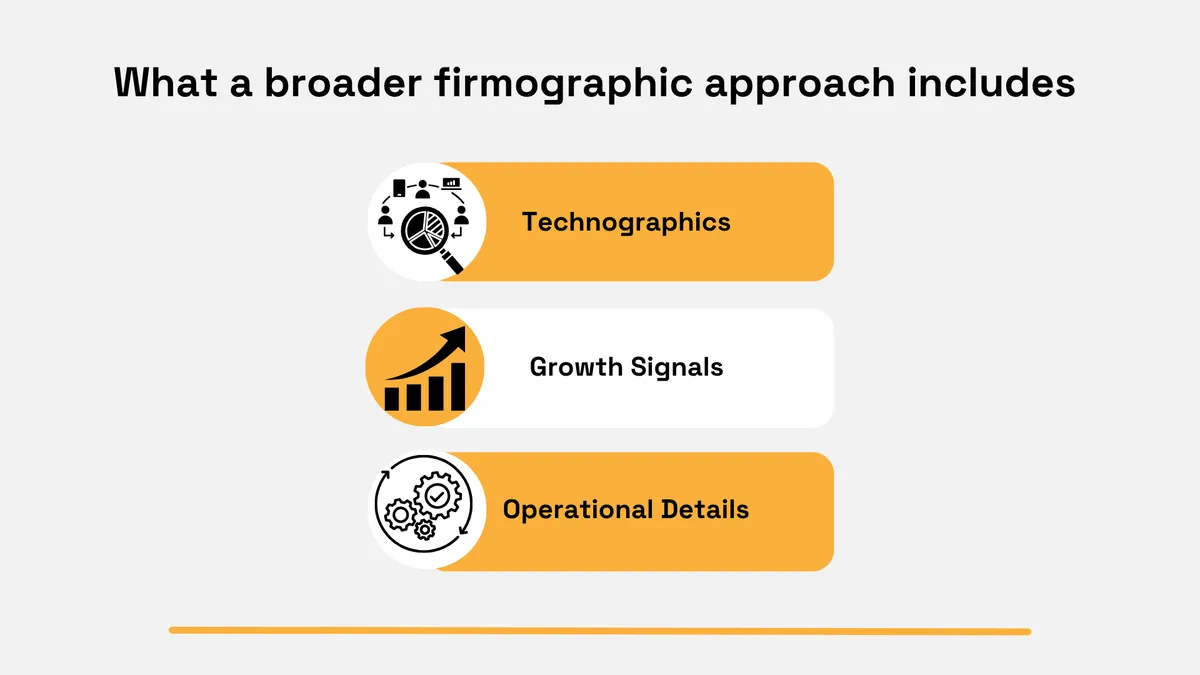
That broader approach can cover hundreds of attributes, including technographics, growth signals, and operational details.
Source: Veridion
It also lets you distinguish between companies that may look similar when evaluated only against the traditional firmographic variables.
Veridion takes this broader approach with its company data.
Its company profiles bring together information across company identity, business classification, industry, location, size and financials, products and services, corporate relationships, ESG, and technographics.
Source: Veridion
The data is continuously refreshed, with each attribute carrying its source and a confidence score so you can trace where the information came from.
You can combine attributes to answer more specific market questions, identify companies that fit a particular industry and size range, find companies in specific geographic markets, or build more detailed segments.
Veridion's market-intelligence data is also designed for applications such as market sizing, thematic research, competitive landscape analysis, and identifying growth-stage companies in specific sectors.
You can pull these attributes directly into an existing workflow through Veridion's Match and Enrich API, which appends the full profile to records you already hold.
The traditional variables give you the foundation for defining your market, while a broader attribute set gives you more information to work with when deciding which companies deserve further attention.
Conclusion
Firmographic data still starts with the same question it always has: is this company worth your team's time? What's changed is how much evidence you can bring to that answer.
Industry, size, location, and ownership structure remain the foundation, but a profile built on hundreds of attributes catches nuance a five-variable model misses entirely- the kind that separates a good-fit account from one that only looks like one on paper.
Build your targeting on that deeper foundation, and every account your team pursues starts from a stronger read on whether it deserves the attention.
Please introduce new information, or remove two of these mentions to avoid repetition.
Articles
Discuss how these trends affect your organization.
Our analysts are available for a short call. Bring a specific question and we will ground it in the data.
Insights
Keep reading
More analysis, research, and outcomes grounded in live company intelligence.
How Is AI Revolutionizing Market Intelligence?
Explore the key ways AI is transforming market intelligence workflows and helping businesses stay ahead of the competition.
Looking for a Global Data Collection Partner? These Companies are Worth Considering
Looking for a global data collection partner? This guide will introduce companies worth considering and explain what sets them apart.
How to Build a Firmographic Lead Scoring Model That Actually Predicts Revenue
Looking to build a firmographic lead scoring model? This guide will show how company data can help prioritize leads and improve revenue predictions.